| Param | Original file | Final file |
|---|---|---|
| Filename | modeM0/AS1A10_103T02_9000004416_30644cztM0_level2.evt | modeM0/AS1A10_103T02_9000004416_30644cztM0_level2_quad_clean.evt |
| Size (bytes) | 802,612,800 | 75,905,280 |
| Size | 765.4 MB | 72.4 MB |
| Events in quadrant A | 3,805,631 | 489,500 |
| Events in quadrant B | 5,342,082 | 485,763 |
| Events in quadrant C | 4,490,121 | 458,083 |
| Events in quadrant D | 10,244,729 | 424,291 |
| Mode M9 | |||
|---|---|---|---|
| Quadrant | BADHDUFLAG | Total packets | Discarded packets |
| A | 0 | 15 | 0 |
| B | 0 | 16 | 0 |
| C | 0 | 16 | 0 |
| D | 0 | 16 | 0 |
| Mode M0 | |||
|---|---|---|---|
| Quadrant | BADHDUFLAG | Total packets | Discarded packets |
| A | 0 | 15435 | 2 |
| B | 0 | 19960 | 2 |
| C | 0 | 17671 | 2 |
| D | 0 | 34790 | 2 |
| Mode SS | |||
|---|---|---|---|
| Quadrant | BADHDUFLAG | Total packets | Discarded packets |
| A | 0 | 128 | 0 |
| B | 0 | 128 | 0 |
| C | 0 | 128 | 0 |
| D | 0 | 128 | 0 |
| Quadrant | Total seconds | Saturated seconds | Saturation percentage |
|---|---|---|---|
| A | 6311 | 176 | 2.788781% |
| B | 6311 | 242 | 3.834575% |
| C | 6310 | 799 | 12.662441% |
| D | 6310 | 1572 | 24.912837% |
Noise dominated data is calculated using 1-second bins in cleaned event files. If a bin has >2000 counts, and if more than 50% of those come from <1% of pixels, then it is considered to be noise-dominated and hence unusable.
| Quadrant | # 1 sec bins | Bins with >0 counts | Bins with >2000 counts | High rate bins dominated by noise | Noise dominated (total time) | Noise dominated (detector-on time) | Marked lightcurve |
|---|---|---|---|---|---|---|---|
| A | 7621 | 6312 | 25 | 25 | 0.33% | 0.40% | 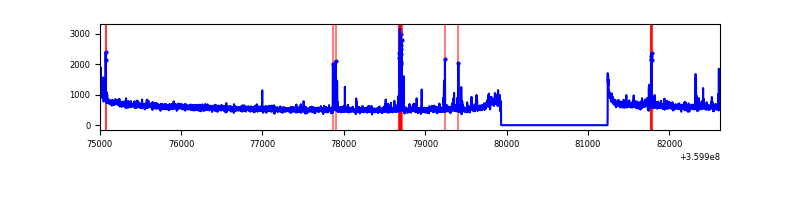 |
| B | 7621 | 6312 | 7 | 7 | 0.09% | 0.11% | 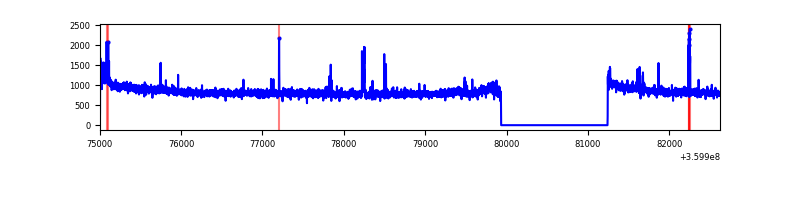 |
| C | 7620 | 6311 | 113 | 113 | 1.48% | 1.79% | 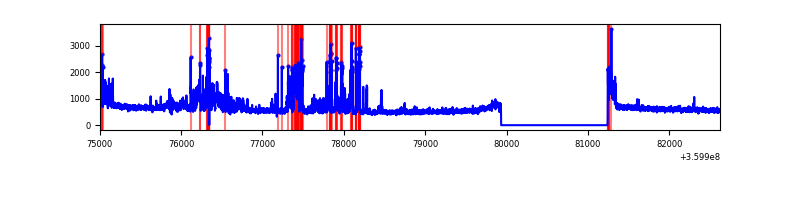 |
| D | 7620 | 6311 | 1277 | 1277 | 16.76% | 20.23% | 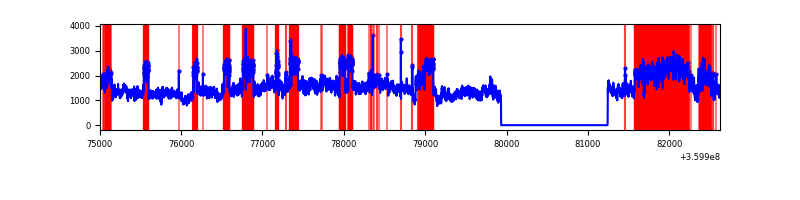 |
Top three noisy pixels from each quadrant. If the there are fewer than three noisy pixels in the level2.evt file, extra rows are filled as -1
| Pixel properties | Quadrant properties | ||||||
|---|---|---|---|---|---|---|---|
| Quadrant | DetID | PixID | Counts | Sigma | Mean | Median | Sigma |
| A | 0 | 13 | 211802 | 1164.53 | 928 | 914 | 181.1 |
| A | 8 | 192 | 19110 | 100.48 | 928 | 914 | 181.1 |
| A | 13 | 254 | 11926 | 60.81 | 928 | 914 | 181.1 |
| B | 6 | 159 | 1665755 | 10061.0 | 905 | 884 | 165.5 |
| B | 0 | 229 | 63836 | 380.43 | 905 | 884 | 165.5 |
| B | 6 | 36 | 36027 | 212.37 | 905 | 884 | 165.5 |
| C | 10 | 22 | 575087 | 2982.59 | 848 | 856 | 192.5 |
| C | 14 | 238 | 260074 | 1346.4 | 848 | 856 | 192.5 |
| C | 14 | 254 | 165326 | 854.27 | 848 | 856 | 192.5 |
| D | 8 | 195 | 6422982 | 32828.21 | 845 | 826 | 195.6 |
| D | 10 | 253 | 410611 | 2094.7 | 845 | 826 | 195.6 |
| D | 12 | 227 | 76157 | 385.07 | 845 | 826 | 195.6 |
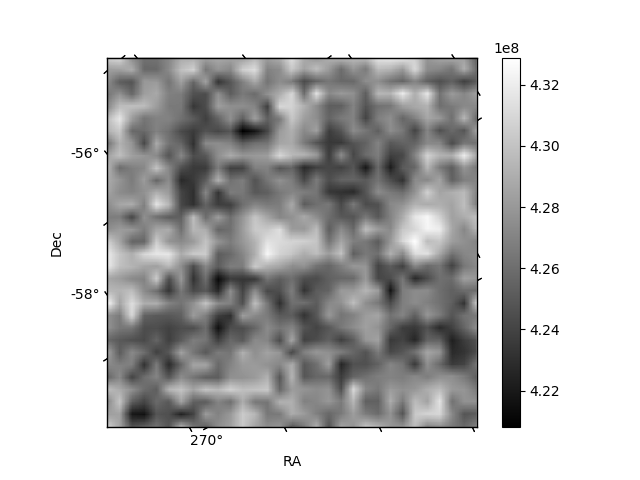
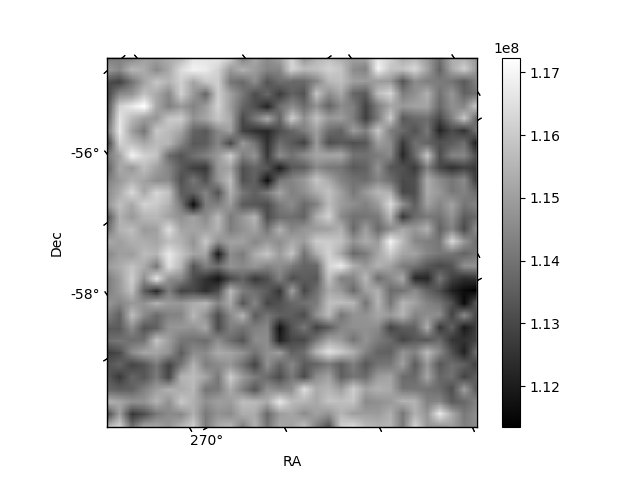
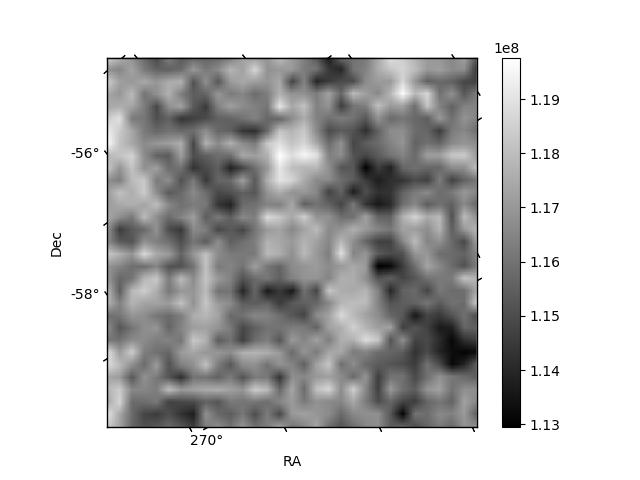
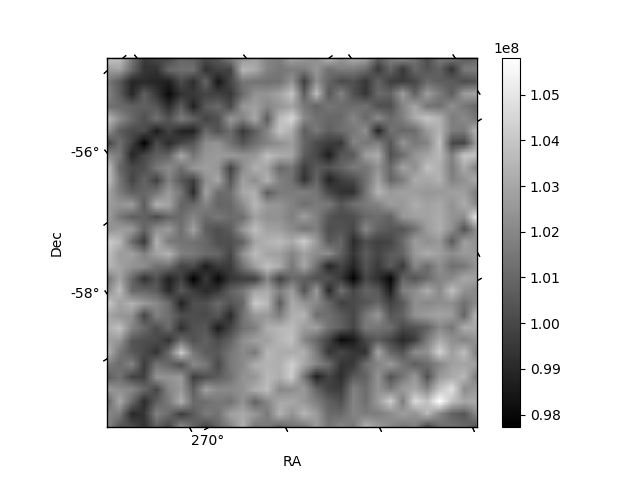
Histogram calculated using DETX and DETY for each event in the final _common_clean file
| Quadrant A | 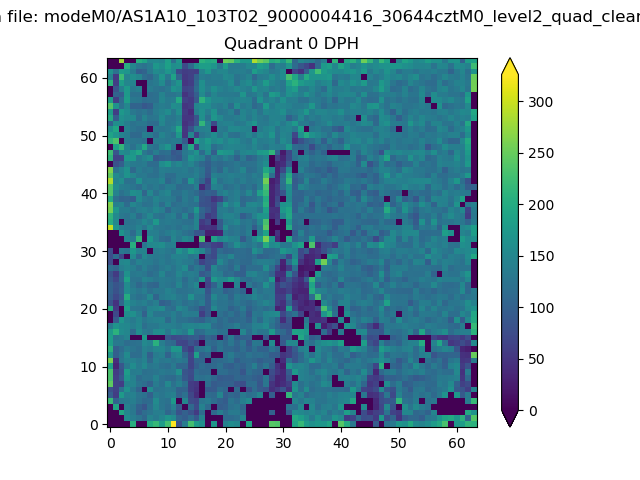 |
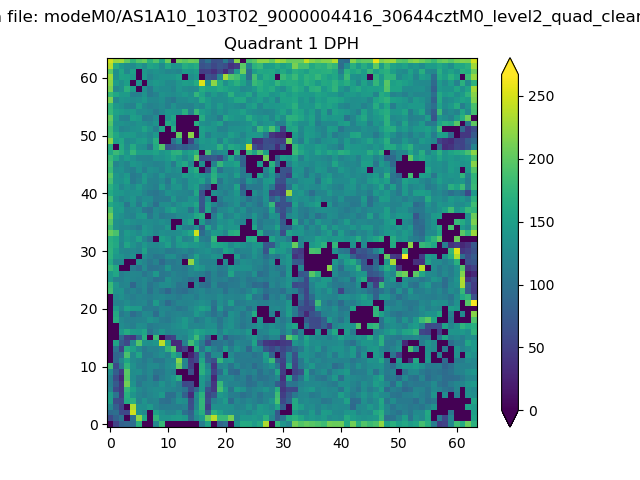 |
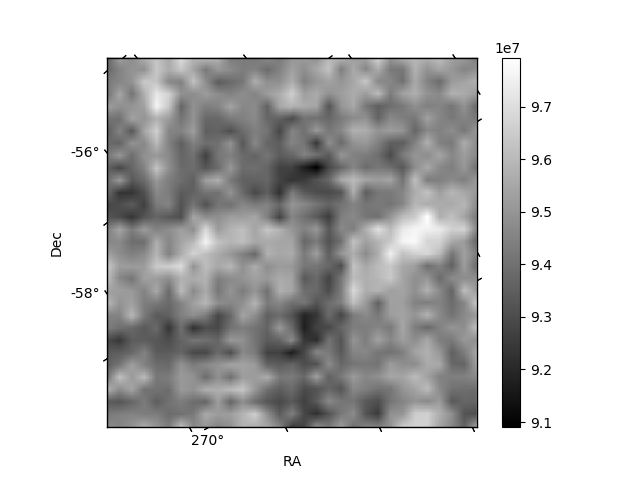
Quadrant B |
|---|---|---|---|
| Quadrant D | 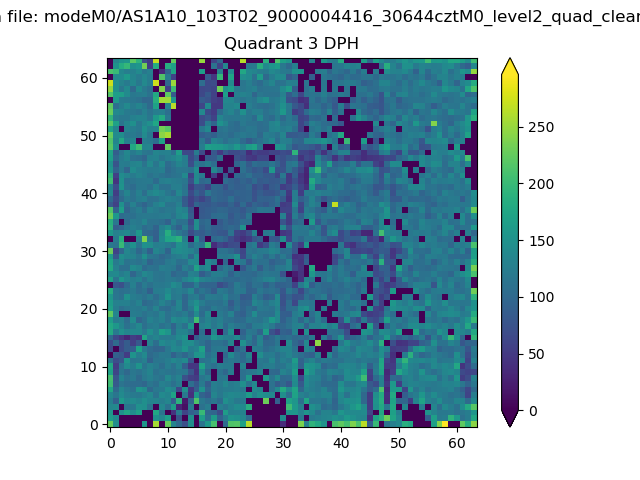 |
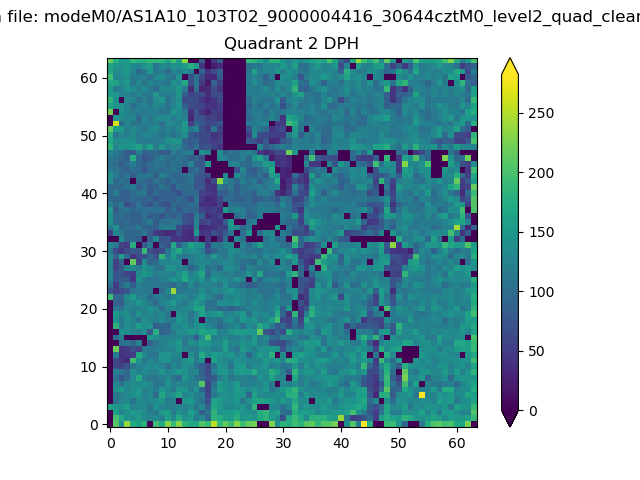 |
Quadrant C |
| Plot type | Count rate plots | Images |
|---|---|---|
| Comparison with Poisson distribution Blue bars denote a histogram of data divided into 1 sec bins. Red curve is a Poisson curve with rate = median count rate of data. |
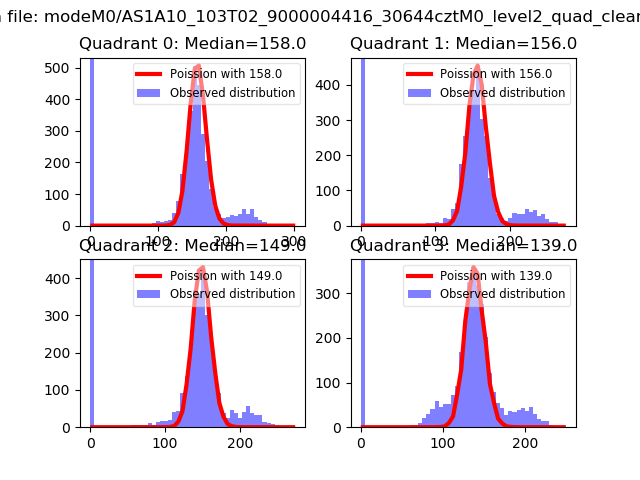 |
 |
| Quadrant-wise count rates Data is divided into 100 sec bins |
 |
|
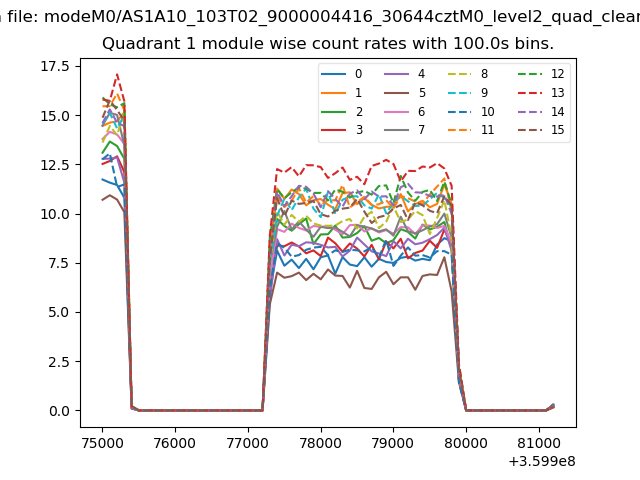
| Module-wise count rates for Quadrant A Data is divided into 100 sec bins |
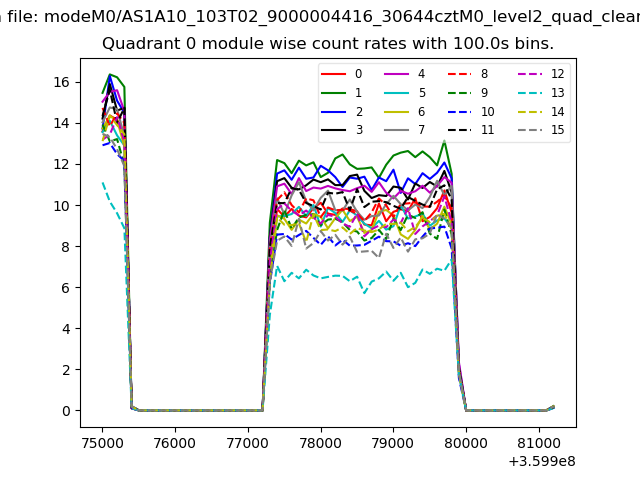 |
 |
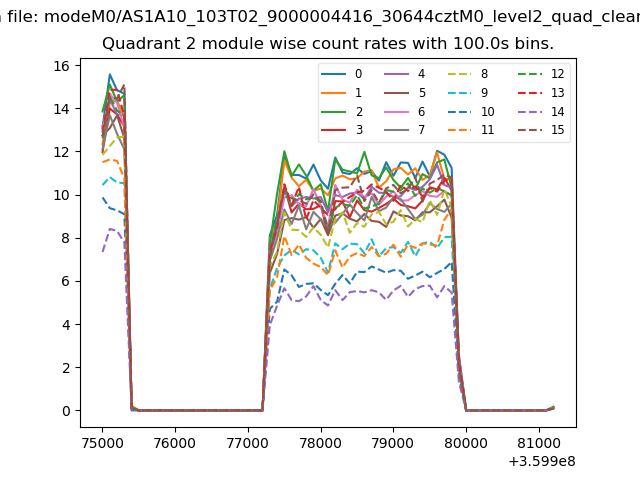
| Module-wise count rates for Quadrant B Data is divided into 100 sec bins |
 |
 |
| Module-wise count rates for Quadrant C Data is divided into 100 sec bins |
 |
 |
| Module-wise count rates for Quadrant D Data is divided into 100 sec bins |
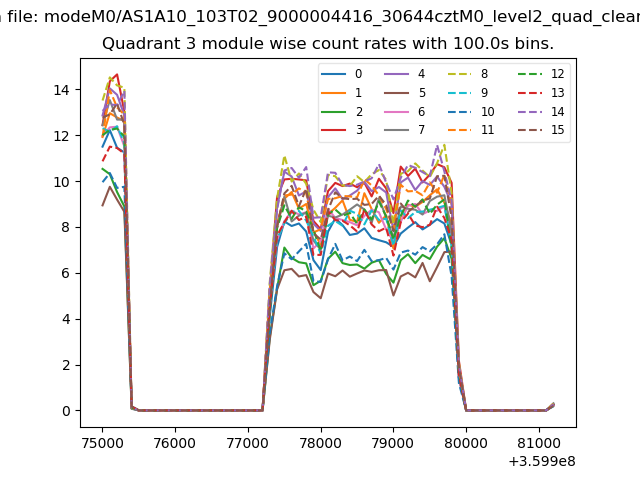 |
 |
| Parameter | Plot |
|---|---|
| CZT HV Monitor | 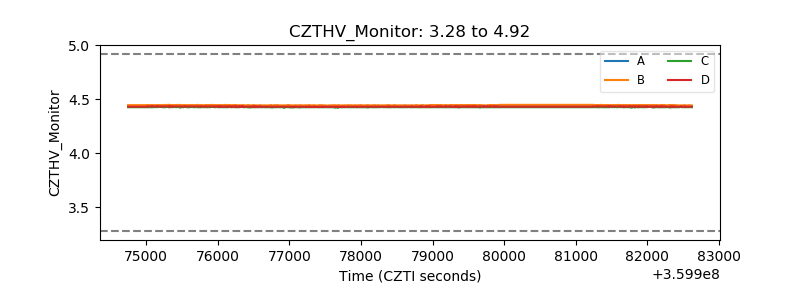 |
| D_VDD | 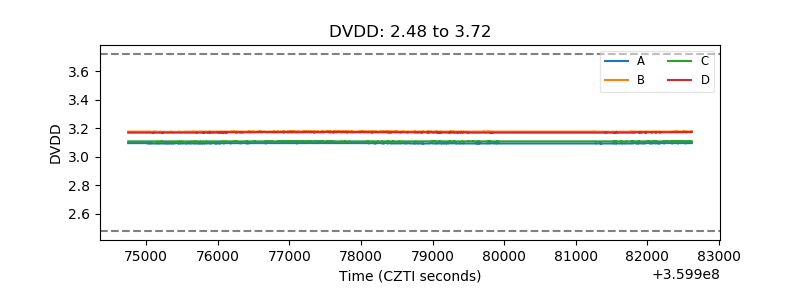 |
| Temperature 1 | 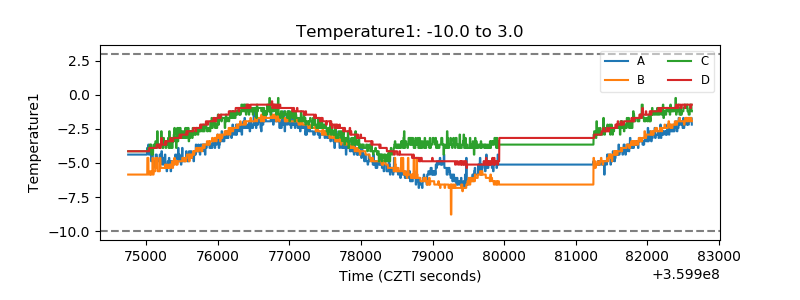 |
| Veto HV Monitor | 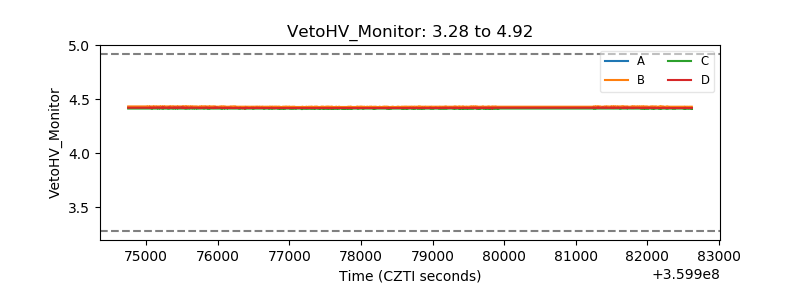 |
| Veto LLD | 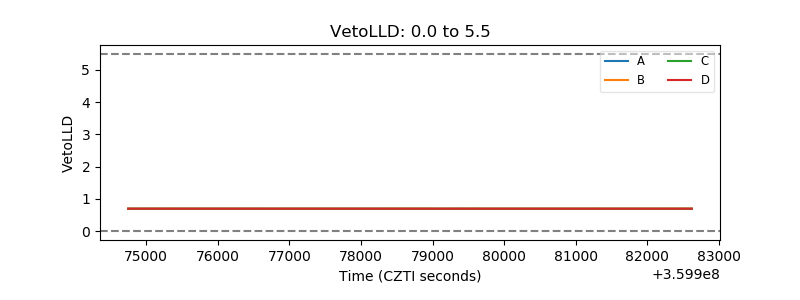 |
| Alpha Counter | 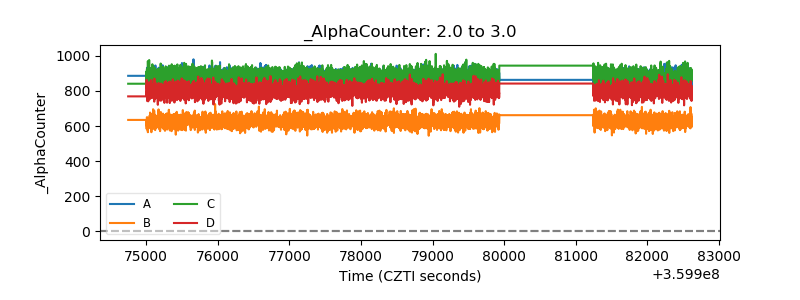 |
| _CPM_Rate | 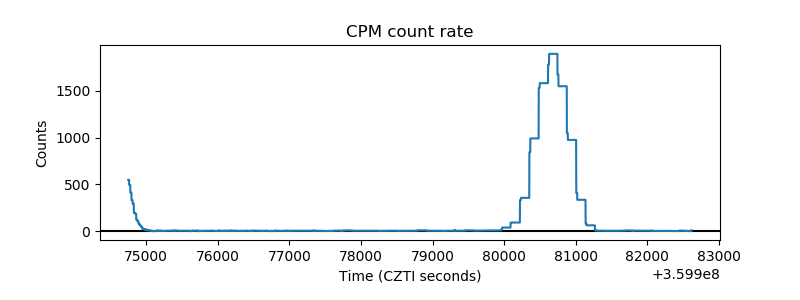 |
| CZT Counter | 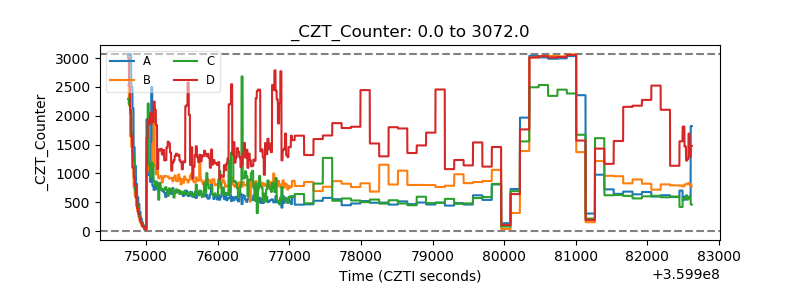 |
| +2.5 Volts monitor |  |
| +5 Volts monitor |  |
| _ROLL_ROT | 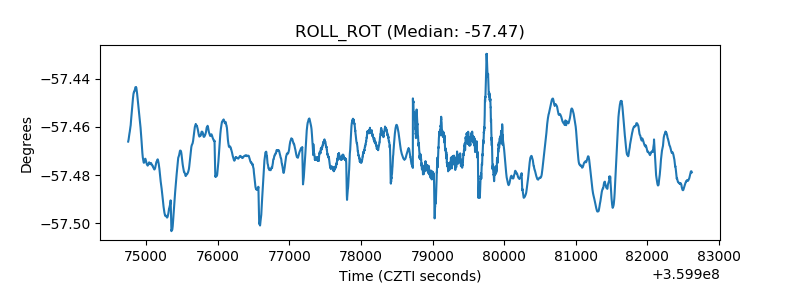 |
| _Roll_DEC | 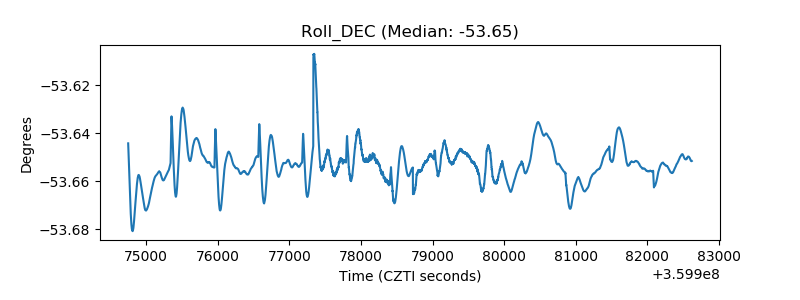 |
| _Roll_RA | 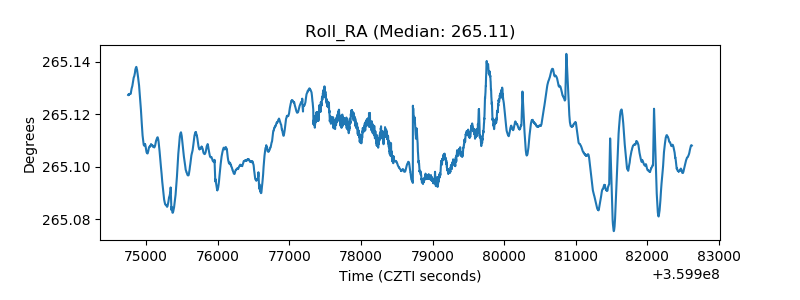 |
| Veto Counter | 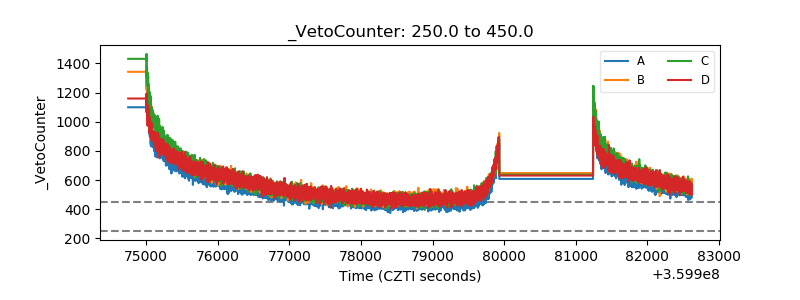 |