| Param | Original file | Final file |
|---|---|---|
| Filename | modeM0/AS1A10_103T02_9000004416_30646cztM0_level2.evt | modeM0/AS1A10_103T02_9000004416_30646cztM0_level2_quad_clean.evt |
| Size (bytes) | 821,387,520 | 92,194,560 |
| Size | 783.3 MB | 87.9 MB |
| Events in quadrant A | 4,156,153 | 607,446 |
| Events in quadrant B | 5,500,033 | 607,290 |
| Events in quadrant C | 3,922,091 | 584,003 |
| Events in quadrant D | 10,830,762 | 509,545 |
| Mode M9 | |||
|---|---|---|---|
| Quadrant | BADHDUFLAG | Total packets | Discarded packets |
| A | 0 | 12 | 0 |
| B | 0 | 13 | 0 |
| C | 0 | 13 | 0 |
| D | 0 | 13 | 0 |
| Mode M0 | |||
|---|---|---|---|
| Quadrant | BADHDUFLAG | Total packets | Discarded packets |
| A | 0 | 16556 | 2 |
| B | 0 | 21370 | 2 |
| C | 0 | 15881 | 2 |
| D | 0 | 36997 | 2 |
| Mode SS | |||
|---|---|---|---|
| Quadrant | BADHDUFLAG | Total packets | Discarded packets |
| A | 0 | 140 | 0 |
| B | 0 | 140 | 0 |
| C | 0 | 140 | 0 |
| D | 0 | 140 | 0 |
| Quadrant | Total seconds | Saturated seconds | Saturation percentage |
|---|---|---|---|
| A | 6931 | 238 | 3.433848% |
| B | 6931 | 207 | 2.986582% |
| C | 6931 | 234 | 3.376136% |
| D | 6931 | 1588 | 22.911557% |
Noise dominated data is calculated using 1-second bins in cleaned event files. If a bin has >2000 counts, and if more than 50% of those come from <1% of pixels, then it is considered to be noise-dominated and hence unusable.
| Quadrant | # 1 sec bins | Bins with >0 counts | Bins with >2000 counts | High rate bins dominated by noise | Noise dominated (total time) | Noise dominated (detector-on time) | Marked lightcurve |
|---|---|---|---|---|---|---|---|
| A | 7901 | 6932 | 104 | 104 | 1.32% | 1.50% | 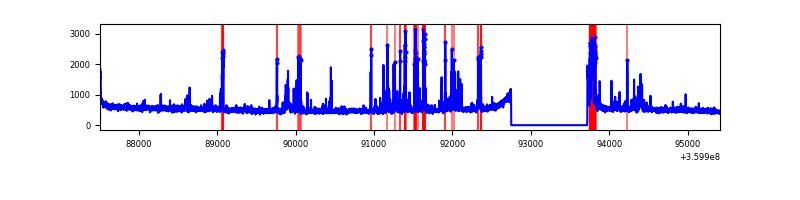 |
| B | 7901 | 6932 | 28 | 28 | 0.35% | 0.40% | 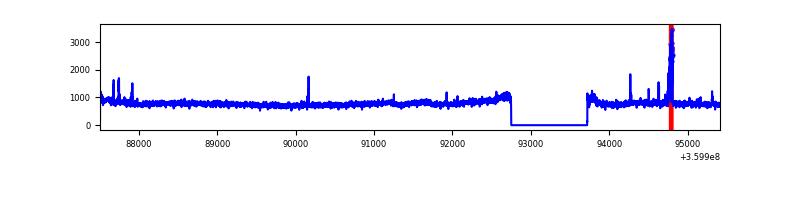 |
| C | 7901 | 6932 | 43 | 43 | 0.54% | 0.62% | 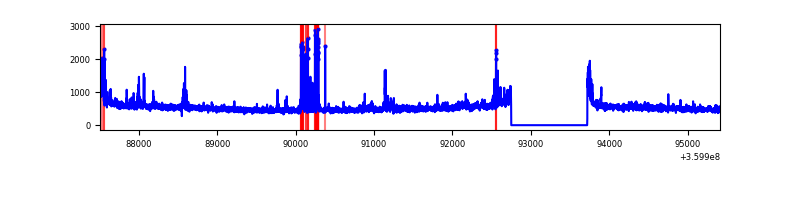 |
| D | 7901 | 6932 | 1315 | 1315 | 16.64% | 18.97% | 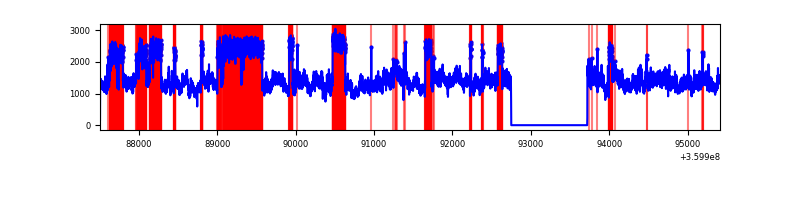 |
Top three noisy pixels from each quadrant. If the there are fewer than three noisy pixels in the level2.evt file, extra rows are filled as -1
| Pixel properties | Quadrant properties | ||||||
|---|---|---|---|---|---|---|---|
| Quadrant | DetID | PixID | Counts | Sigma | Mean | Median | Sigma |
| A | 0 | 13 | 662471 | 3727.25 | 899 | 882 | 177.5 |
| A | 8 | 192 | 20341 | 109.63 | 899 | 882 | 177.5 |
| A | 13 | 254 | 12816 | 67.23 | 899 | 882 | 177.5 |
| B | 6 | 159 | 1845912 | 10992.8 | 889 | 869 | 167.8 |
| B | 5 | 172 | 92995 | 548.89 | 889 | 869 | 167.8 |
| B | 12 | 111 | 20219 | 115.29 | 889 | 869 | 167.8 |
| C | 10 | 22 | 253099 | 1273.85 | 858 | 864 | 198.0 |
| C | 14 | 238 | 140748 | 706.45 | 858 | 864 | 198.0 |
| C | 3 | 233 | 91028 | 455.35 | 858 | 864 | 198.0 |
| D | 8 | 195 | 7220972 | 37646.4 | 814 | 793 | 191.8 |
| D | 10 | 253 | 254969 | 1325.29 | 814 | 793 | 191.8 |
| D | 12 | 227 | 199195 | 1034.48 | 814 | 793 | 191.8 |
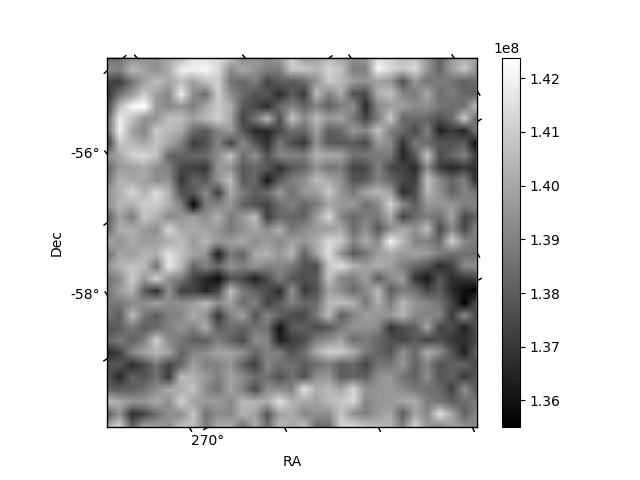
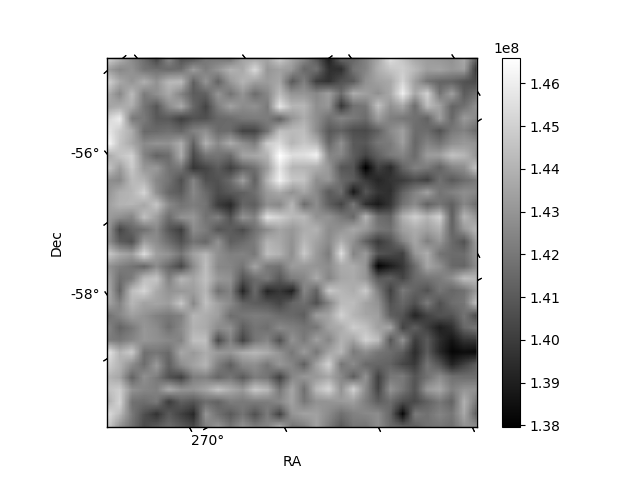
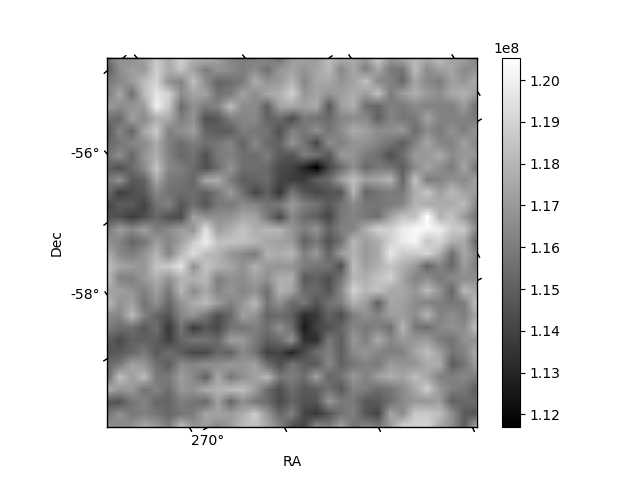
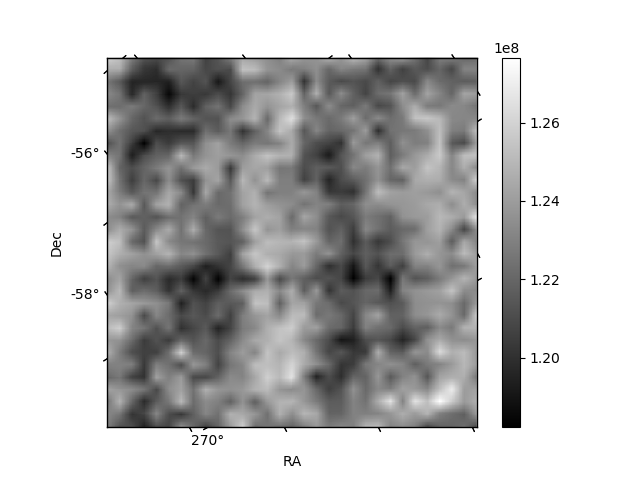
Histogram calculated using DETX and DETY for each event in the final _common_clean file
| Quadrant A |  |
 |
Quadrant B |
|---|---|---|---|
| Quadrant D |  |
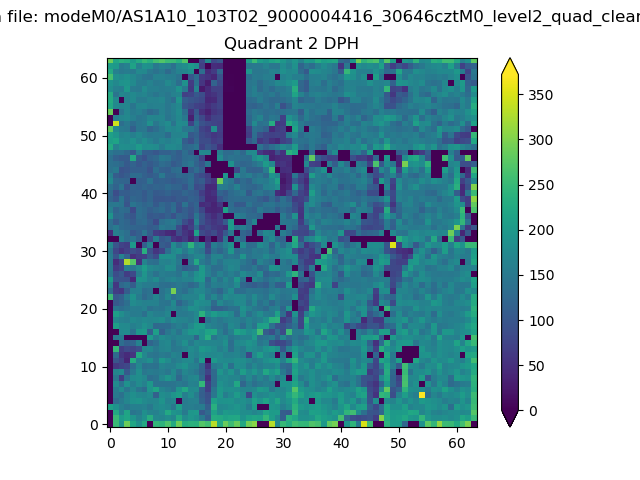 |
Quadrant C |
| Plot type | Count rate plots | Images |
|---|---|---|
| Comparison with Poisson distribution Blue bars denote a histogram of data divided into 1 sec bins. Red curve is a Poisson curve with rate = median count rate of data. |
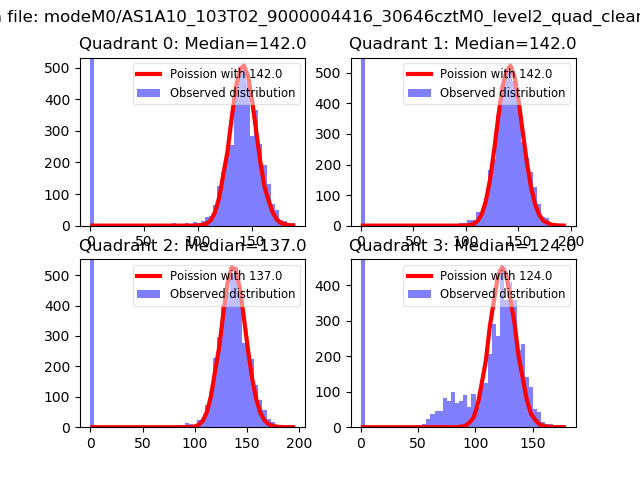 |
 |
| Quadrant-wise count rates Data is divided into 100 sec bins |
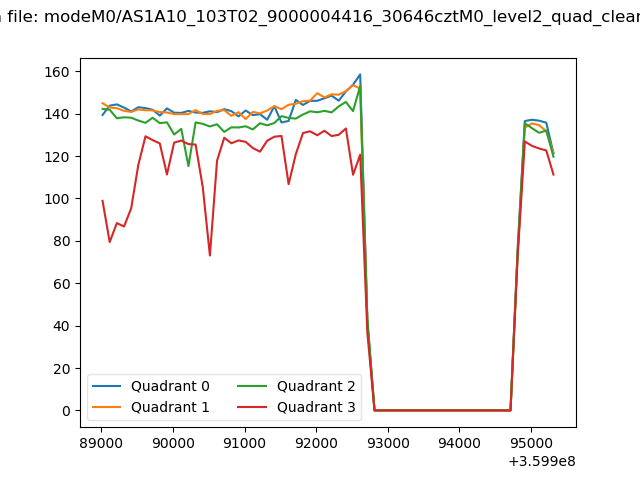 |
|
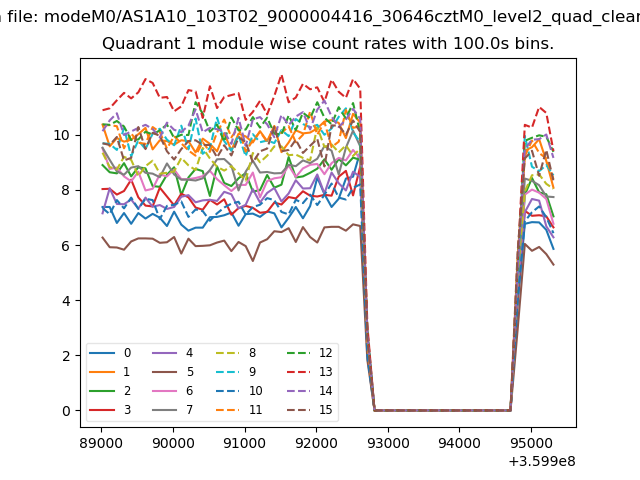
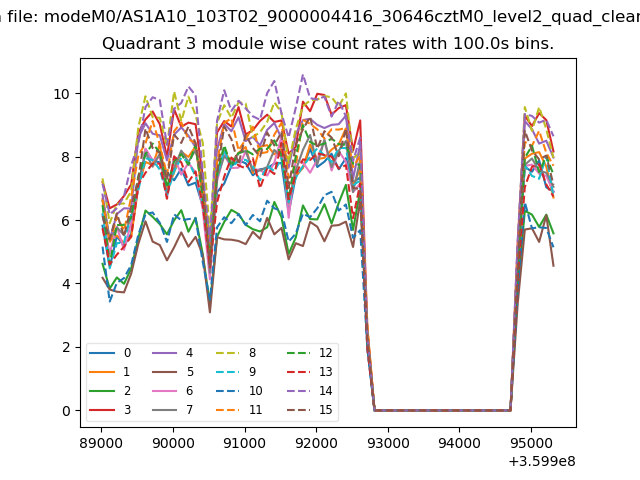
| Module-wise count rates for Quadrant A Data is divided into 100 sec bins |
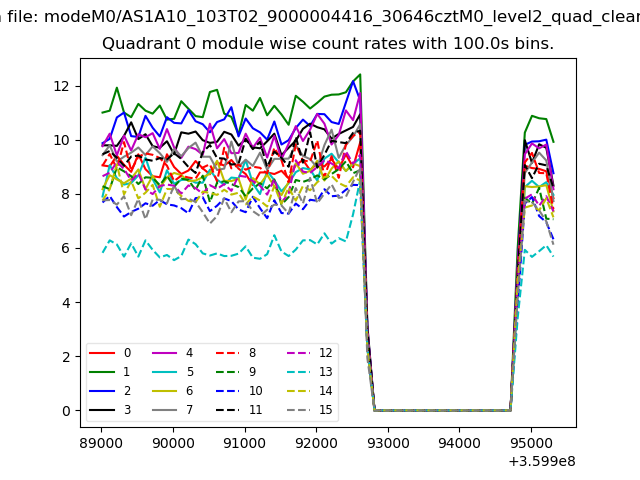 |
 |
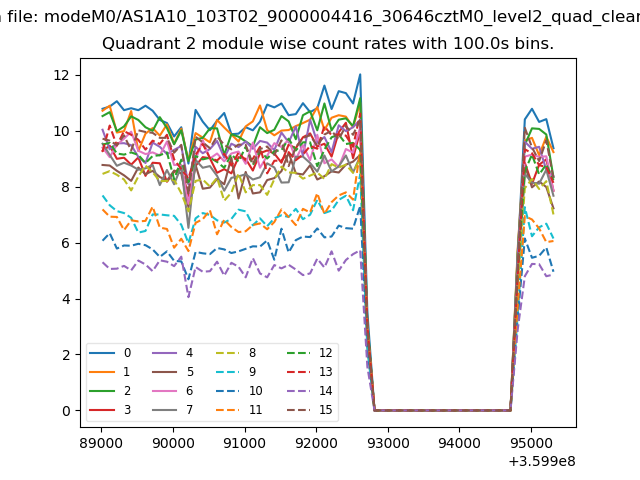
| Module-wise count rates for Quadrant B Data is divided into 100 sec bins |
 |
 |
| Module-wise count rates for Quadrant C Data is divided into 100 sec bins |
 |
 |
| Module-wise count rates for Quadrant D Data is divided into 100 sec bins |
 |
 |
| Parameter | Plot |
|---|---|
| CZT HV Monitor | 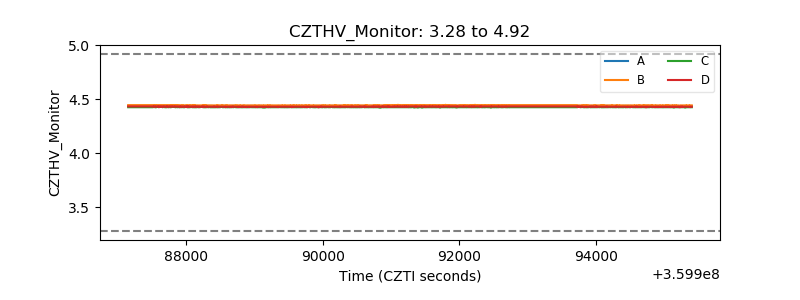 |
| D_VDD | 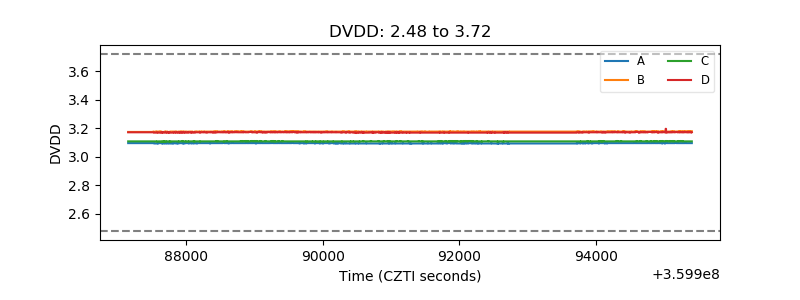 |
| Temperature 1 | 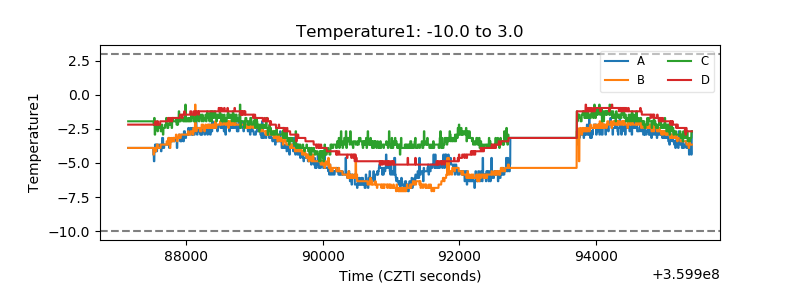 |
| Veto HV Monitor | 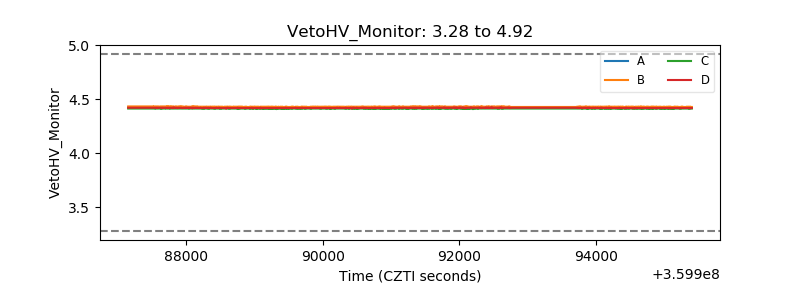 |
| Veto LLD |  |
| Alpha Counter | 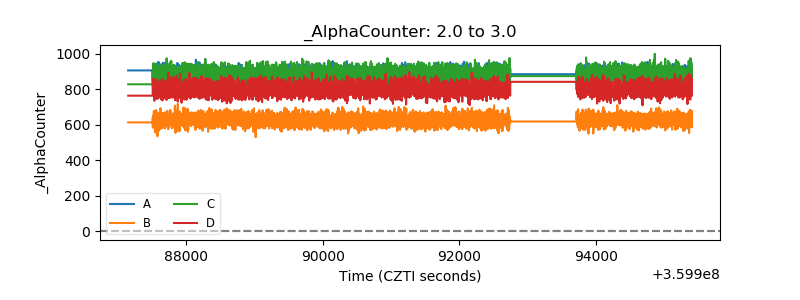 |
| _CPM_Rate | 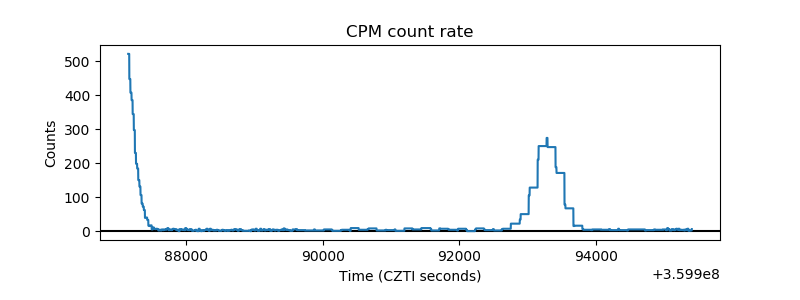 |
| CZT Counter | 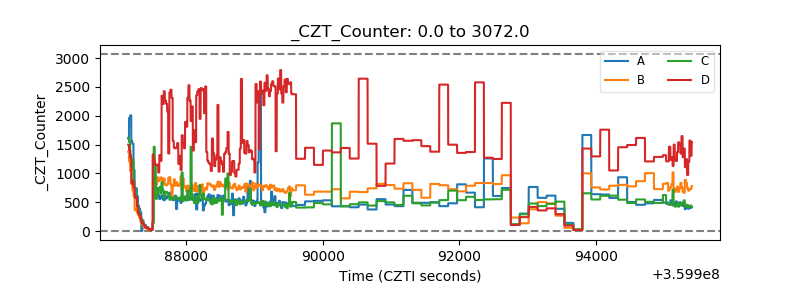 |
| +2.5 Volts monitor |  |
| +5 Volts monitor | 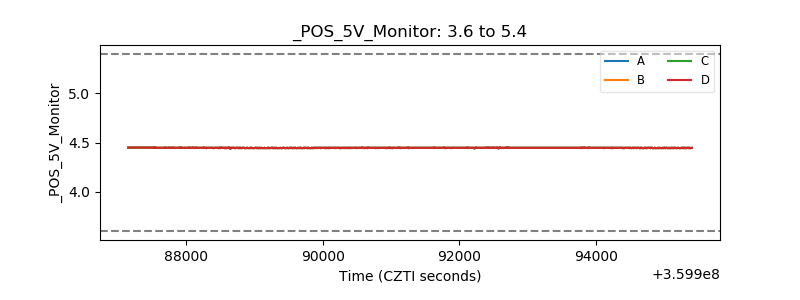 |
| _ROLL_ROT | 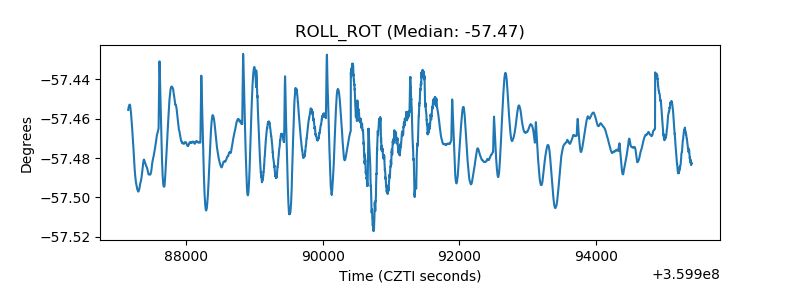 |
| _Roll_DEC | 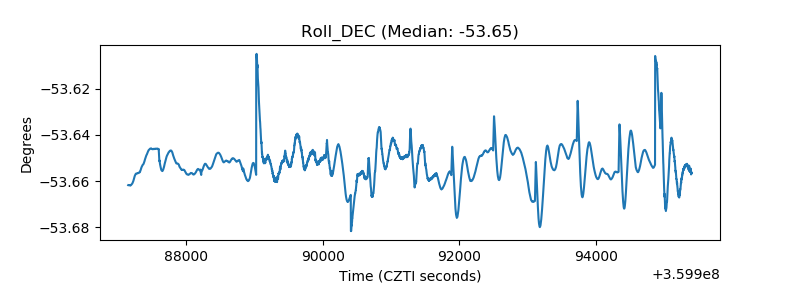 |
| _Roll_RA |  |
| Veto Counter | 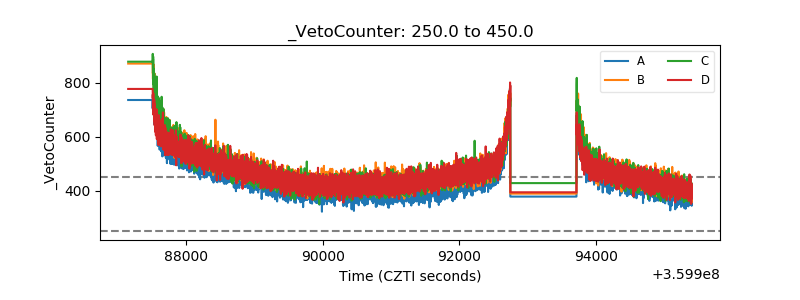 |