| Param | Original file | Final file |
|---|---|---|
| Filename | modeM0/AS1A10_103T02_9000004416_30647cztM0_level2.evt | modeM0/AS1A10_103T02_9000004416_30647cztM0_level2_quad_clean.evt |
| Size (bytes) | 843,883,200 | 101,989,440 |
| Size | 804.8 MB | 97.3 MB |
| Events in quadrant A | 4,282,539 | 672,992 |
| Events in quadrant B | 5,885,055 | 664,775 |
| Events in quadrant C | 4,269,106 | 639,959 |
| Events in quadrant D | 10,616,235 | 589,246 |
| Mode M9 | |||
|---|---|---|---|
| Quadrant | BADHDUFLAG | Total packets | Discarded packets |
| A | 0 | 13 | 0 |
| B | 0 | 14 | 0 |
| C | 0 | 14 | 0 |
| D | 0 | 14 | 0 |
| Mode M0 | |||
|---|---|---|---|
| Quadrant | BADHDUFLAG | Total packets | Discarded packets |
| A | 0 | 17487 | 2 |
| B | 0 | 22901 | 2 |
| C | 0 | 17376 | 2 |
| D | 0 | 36785 | 2 |
| Mode SS | |||
|---|---|---|---|
| Quadrant | BADHDUFLAG | Total packets | Discarded packets |
| A | 0 | 154 | 0 |
| B | 0 | 154 | 0 |
| C | 0 | 154 | 0 |
| D | 0 | 154 | 0 |
| Quadrant | Total seconds | Saturated seconds | Saturation percentage |
|---|---|---|---|
| A | 7486 | 279 | 3.726957% |
| B | 7486 | 205 | 2.738445% |
| C | 7486 | 173 | 2.310980% |
| D | 7486 | 1054 | 14.079615% |
Noise dominated data is calculated using 1-second bins in cleaned event files. If a bin has >2000 counts, and if more than 50% of those come from <1% of pixels, then it is considered to be noise-dominated and hence unusable.
| Quadrant | # 1 sec bins | Bins with >0 counts | Bins with >2000 counts | High rate bins dominated by noise | Noise dominated (total time) | Noise dominated (detector-on time) | Marked lightcurve |
|---|---|---|---|---|---|---|---|
| A | 8051 | 7487 | 112 | 112 | 1.39% | 1.50% | 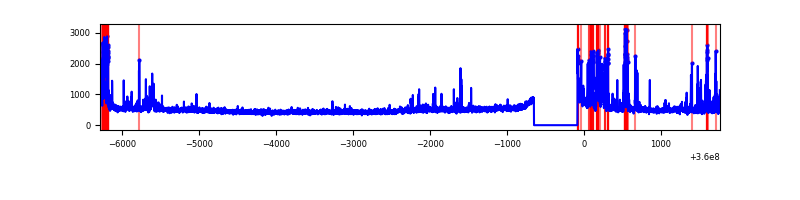 |
| B | 8051 | 7487 | 30 | 30 | 0.37% | 0.40% | 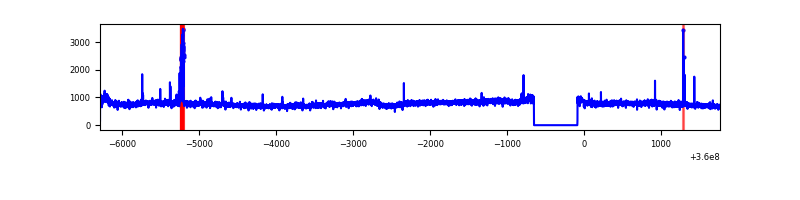 |
| C | 8051 | 7487 | 18 | 18 | 0.22% | 0.24% | 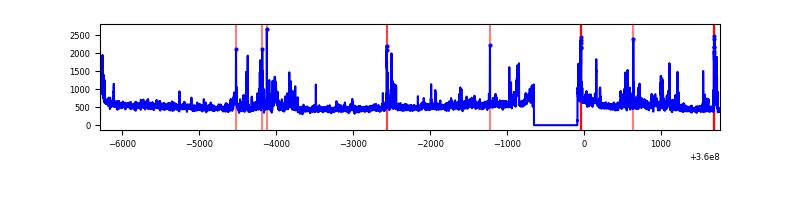 |
| D | 8051 | 7487 | 904 | 904 | 11.23% | 12.07% | 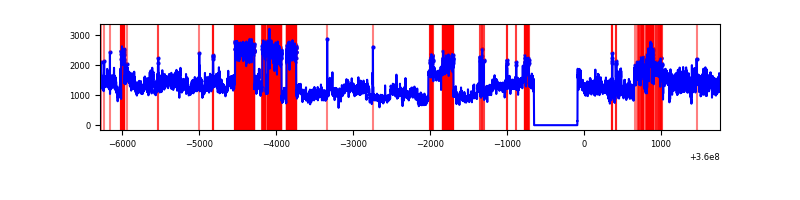 |
Top three noisy pixels from each quadrant. If the there are fewer than three noisy pixels in the level2.evt file, extra rows are filled as -1
| Pixel properties | Quadrant properties | ||||||
|---|---|---|---|---|---|---|---|
| Quadrant | DetID | PixID | Counts | Sigma | Mean | Median | Sigma |
| A | 0 | 13 | 700812 | 3810.17 | 922 | 906 | 183.7 |
| A | 8 | 192 | 17943 | 92.75 | 922 | 906 | 183.7 |
| A | 13 | 254 | 14547 | 74.26 | 922 | 906 | 183.7 |
| B | 6 | 159 | 2110842 | 12174.57 | 919 | 897 | 173.3 |
| B | 5 | 172 | 93239 | 532.82 | 919 | 897 | 173.3 |
| B | 12 | 111 | 21114 | 116.65 | 919 | 897 | 173.3 |
| C | 3 | 233 | 297289 | 1426.45 | 889 | 894 | 207.8 |
| C | 10 | 22 | 295703 | 1418.82 | 889 | 894 | 207.8 |
| C | 14 | 238 | 142427 | 681.15 | 889 | 894 | 207.8 |
| D | 8 | 195 | 6914167 | 33522.99 | 873 | 851 | 206.2 |
| D | 12 | 227 | 198553 | 958.67 | 873 | 851 | 206.2 |
| D | 13 | 249 | 80732 | 387.35 | 873 | 851 | 206.2 |
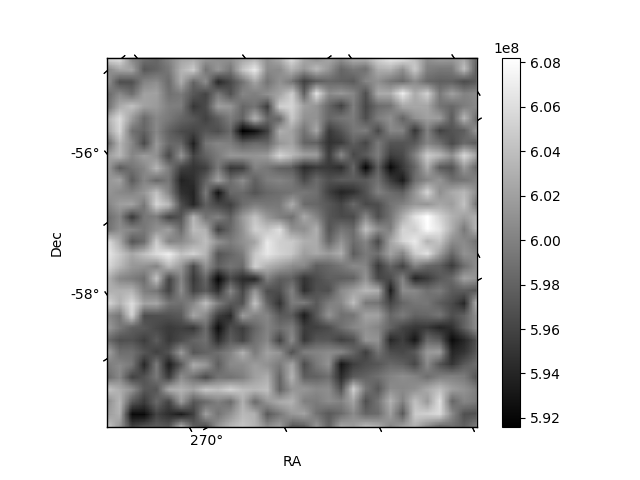
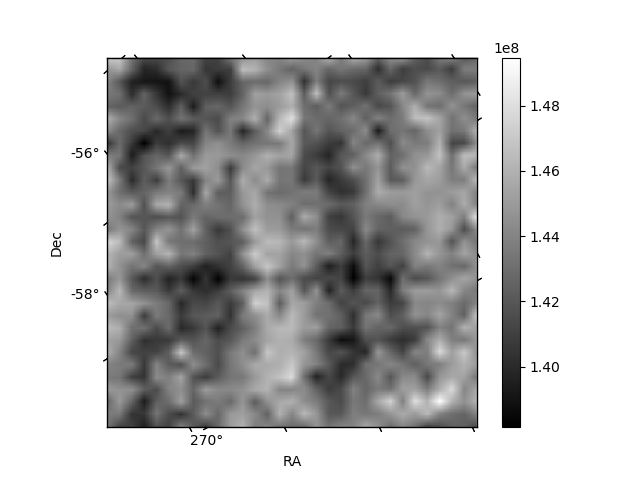
Histogram calculated using DETX and DETY for each event in the final _common_clean file
| Quadrant A | 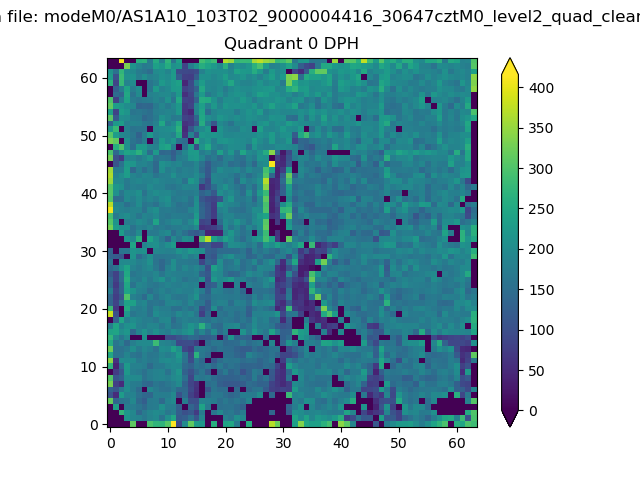 |
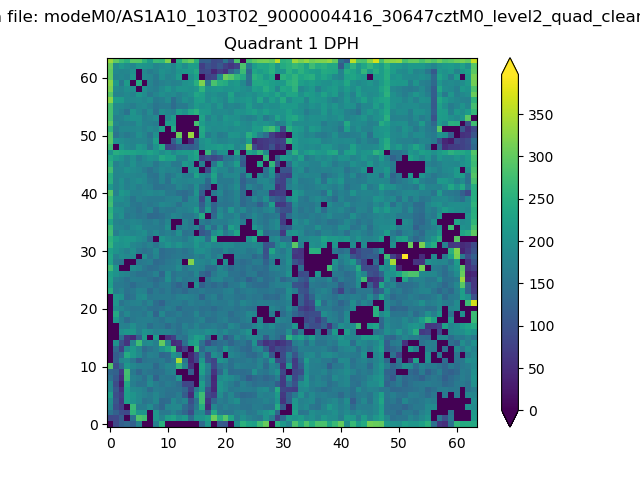 |
Quadrant B |
|---|---|---|---|
| Quadrant D | 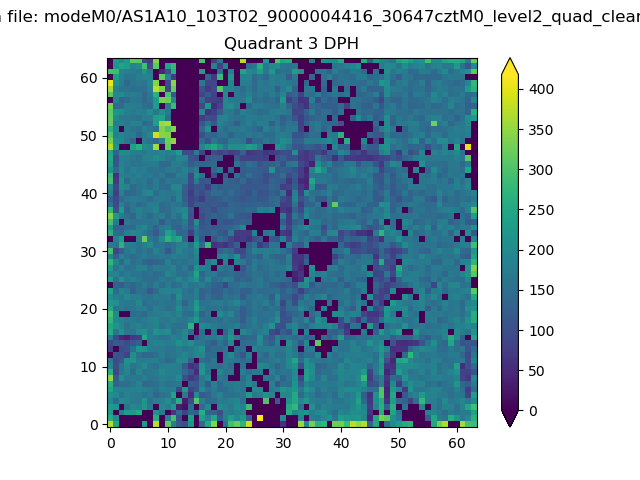 |
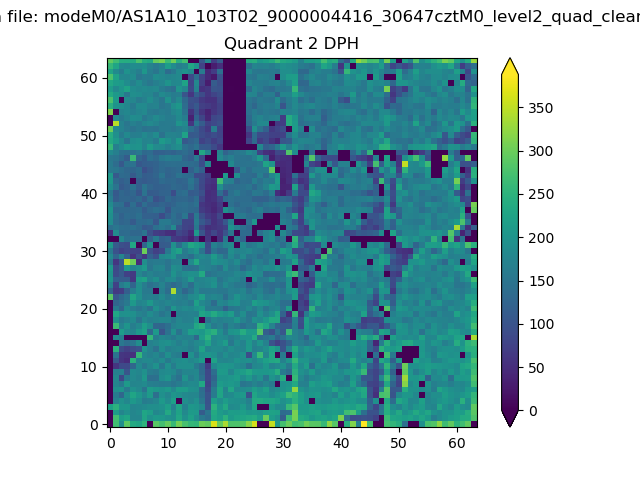 |
Quadrant C |
| Plot type | Count rate plots | Images |
|---|---|---|
| Comparison with Poisson distribution Blue bars denote a histogram of data divided into 1 sec bins. Red curve is a Poisson curve with rate = median count rate of data. |
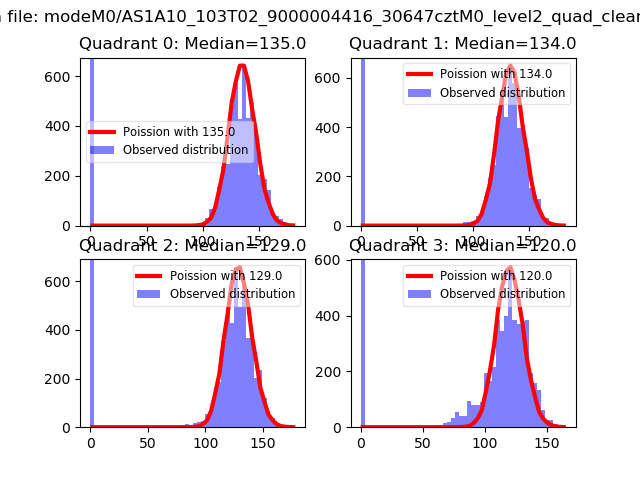 |
 |
| Quadrant-wise count rates Data is divided into 100 sec bins |
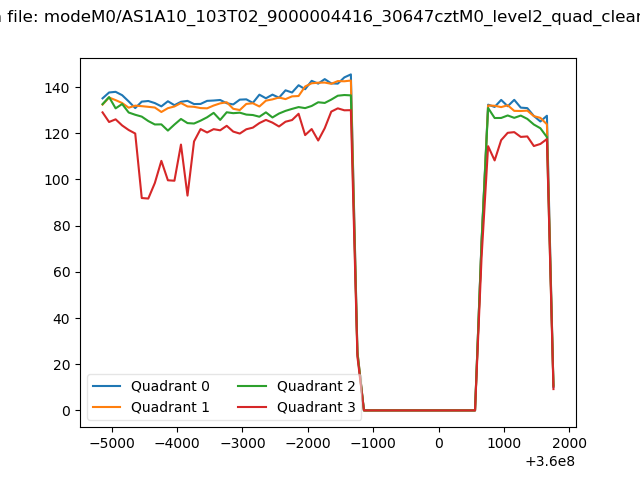 |
|
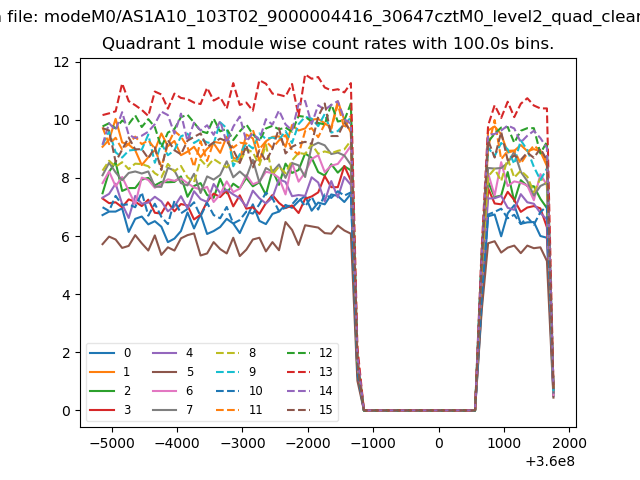
| Module-wise count rates for Quadrant A Data is divided into 100 sec bins |
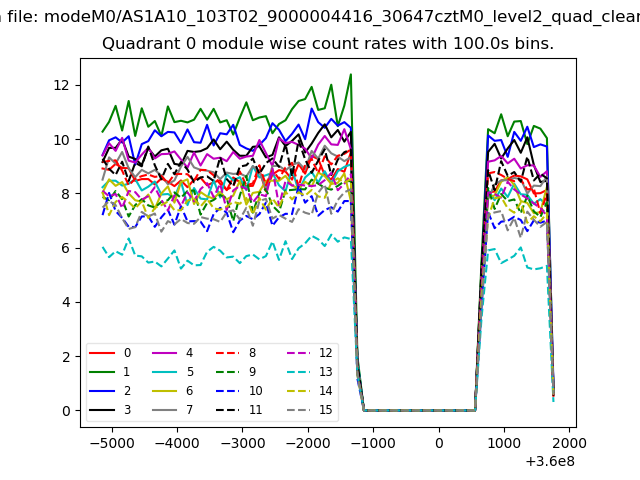 |
 |
| Module-wise count rates for Quadrant B Data is divided into 100 sec bins |
 |
 |
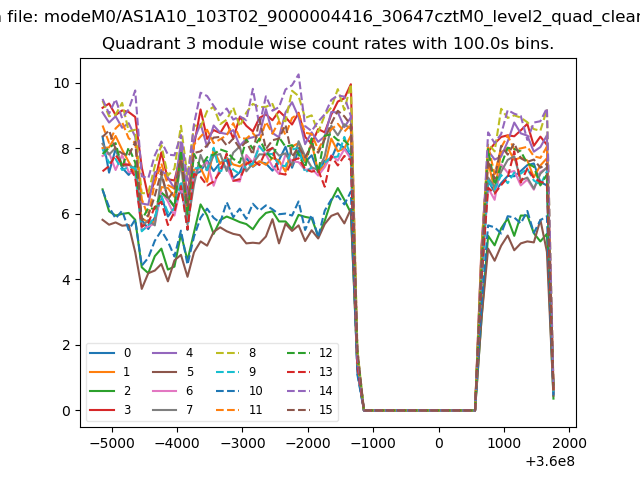
| Module-wise count rates for Quadrant C Data is divided into 100 sec bins |
 |
 |
| Module-wise count rates for Quadrant D Data is divided into 100 sec bins |
 |
 |
| Parameter | Plot |
|---|---|
| CZT HV Monitor | 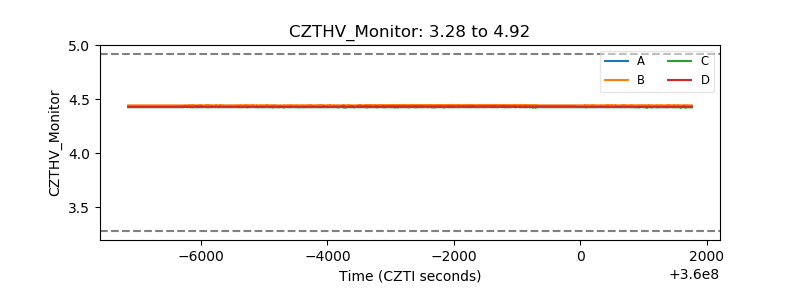 |
| D_VDD | 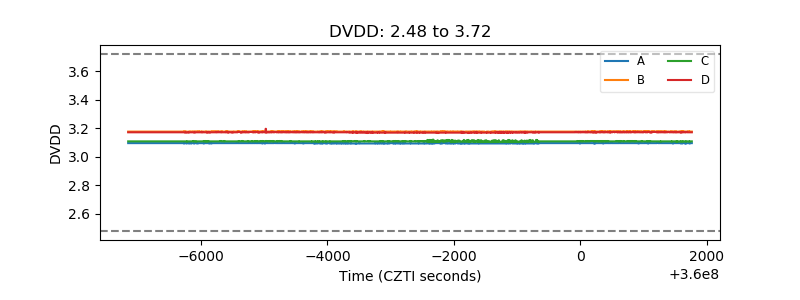 |
| Temperature 1 |  |
| Veto HV Monitor | 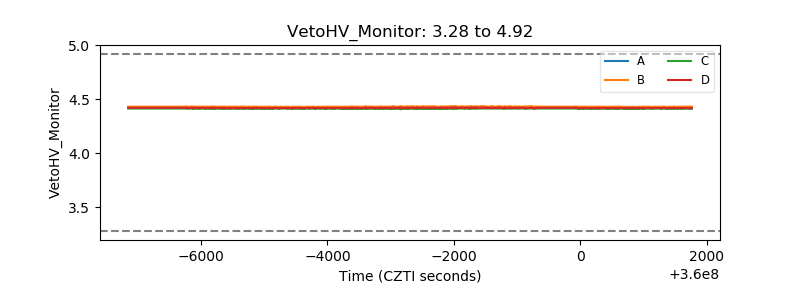 |
| Veto LLD | 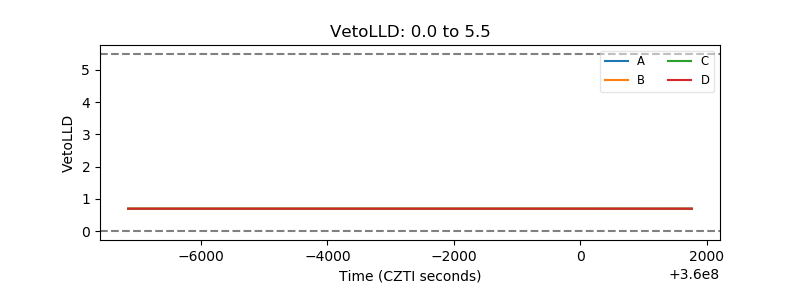 |
| Alpha Counter | 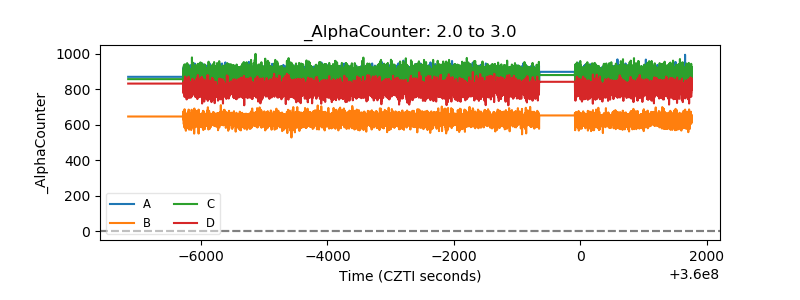 |
| _CPM_Rate | 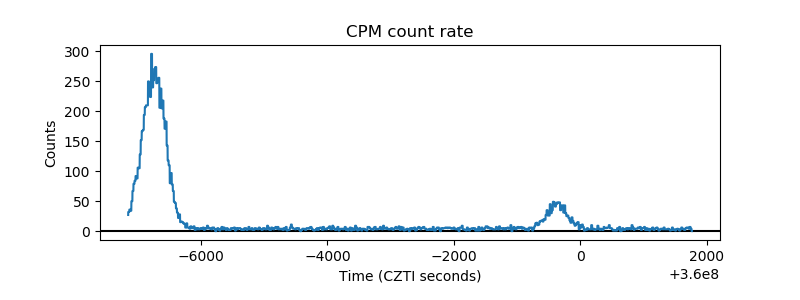 |
| CZT Counter | 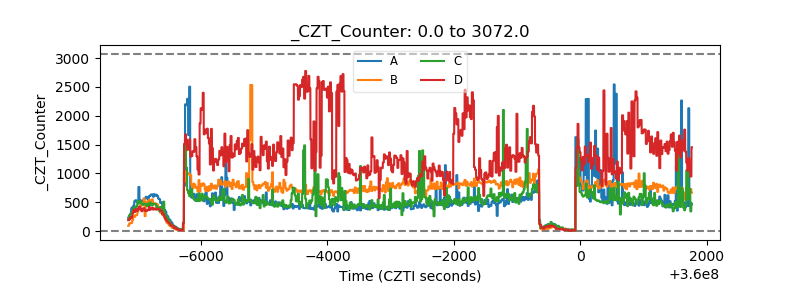 |
| +2.5 Volts monitor |  |
| +5 Volts monitor | 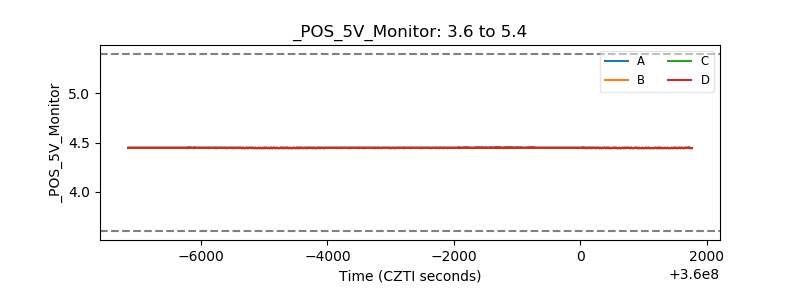 |
| _ROLL_ROT | 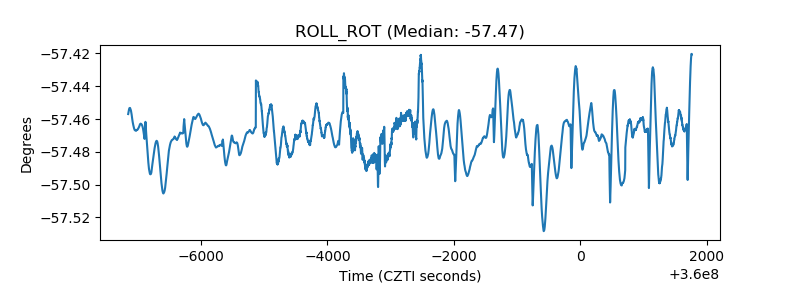 |
| _Roll_DEC | 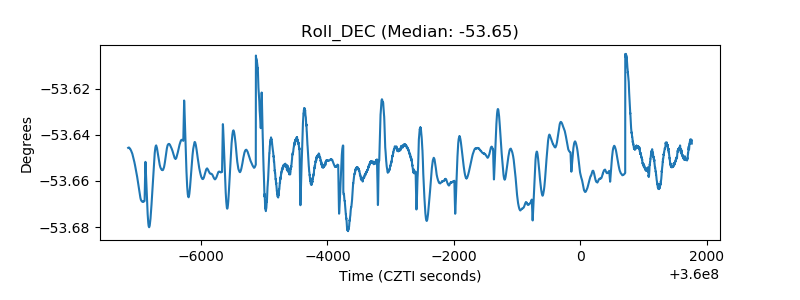 |
| _Roll_RA | 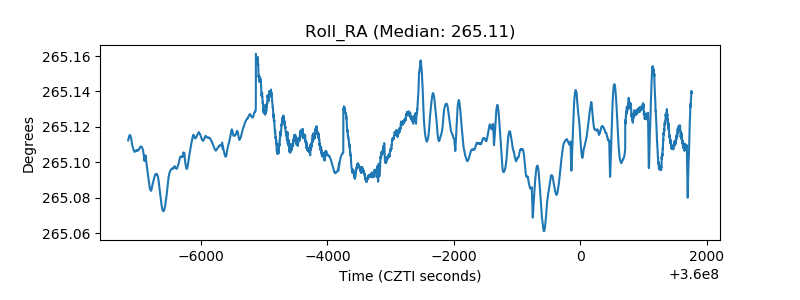 |
| Veto Counter |  |