| Param | Original file | Final file |
|---|---|---|
| Filename | modeM0/AS1A10_103T02_9000004416_30648cztM0_level2.evt | modeM0/AS1A10_103T02_9000004416_30648cztM0_level2_quad_clean.evt |
| Size (bytes) | 400,942,080 | 73,656,000 |
| Size | 382.4 MB | 70.2 MB |
| Events in quadrant A | 2,260,467 | 501,076 |
| Events in quadrant B | 3,111,882 | 498,053 |
| Events in quadrant C | 2,133,656 | 478,383 |
| Events in quadrant D | 4,353,417 | 458,879 |
| Mode M0 | |||
|---|---|---|---|
| Quadrant | BADHDUFLAG | Total packets | Discarded packets |
| A | 0 | 9466 | 0 |
| B | 0 | 12543 | 2 |
| C | 0 | 9079 | 0 |
| D | 0 | 15823 | 0 |
| Mode SS | |||
|---|---|---|---|
| Quadrant | BADHDUFLAG | Total packets | Discarded packets |
| A | 0 | 82 | 0 |
| B | 0 | 82 | 0 |
| C | 0 | 82 | 0 |
| D | 0 | 82 | 0 |
| Quadrant | Total seconds | Saturated seconds | Saturation percentage |
|---|---|---|---|
| A | 4181 | 59 | 1.411146% |
| B | 4180 | 17 | 0.406699% |
| C | 4181 | 48 | 1.148051% |
| D | 4181 | 120 | 2.870127% |
Noise dominated data is calculated using 1-second bins in cleaned event files. If a bin has >2000 counts, and if more than 50% of those come from <1% of pixels, then it is considered to be noise-dominated and hence unusable.
| Quadrant | # 1 sec bins | Bins with >0 counts | Bins with >2000 counts | High rate bins dominated by noise | Noise dominated (total time) | Noise dominated (detector-on time) | Marked lightcurve |
|---|---|---|---|---|---|---|---|
| A | 4181 | 4181 | 46 | 46 | 1.10% | 1.10% | 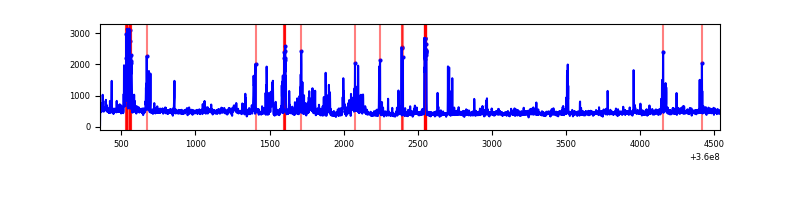 |
| B | 4180 | 4180 | 2 | 2 | 0.05% | 0.05% | 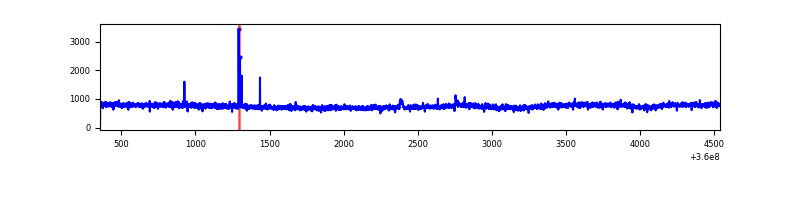 |
| C | 4181 | 4181 | 14 | 14 | 0.33% | 0.33% | 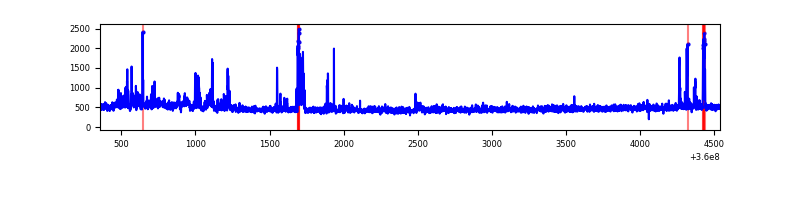 |
| D | 4181 | 4181 | 136 | 136 | 3.25% | 3.25% | 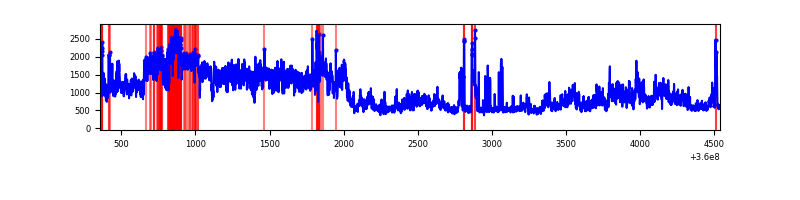 |
Top three noisy pixels from each quadrant. If the there are fewer than three noisy pixels in the level2.evt file, extra rows are filled as -1
| Pixel properties | Quadrant properties | ||||||
|---|---|---|---|---|---|---|---|
| Quadrant | DetID | PixID | Counts | Sigma | Mean | Median | Sigma |
| A | 0 | 13 | 415547 | 4240.89 | 477 | 467 | 97.9 |
| A | 13 | 254 | 8353 | 80.57 | 477 | 467 | 97.9 |
| A | 3 | 137 | 4655 | 42.79 | 477 | 467 | 97.9 |
| B | 6 | 159 | 1202956 | 13060.67 | 476 | 463 | 92.1 |
| B | 0 | 229 | 22687 | 241.38 | 476 | 463 | 92.1 |
| B | 12 | 111 | 11262 | 117.29 | 476 | 463 | 92.1 |
| C | 10 | 22 | 164513 | 1493.05 | 460 | 462 | 109.9 |
| C | 14 | 238 | 75968 | 687.19 | 460 | 462 | 109.9 |
| C | 3 | 233 | 70346 | 636.02 | 460 | 462 | 109.9 |
| D | 8 | 195 | 2231661 | 20296.81 | 458 | 445 | 109.9 |
| D | 12 | 227 | 252716 | 2294.85 | 458 | 445 | 109.9 |
| D | 13 | 249 | 56929 | 513.82 | 458 | 445 | 109.9 |
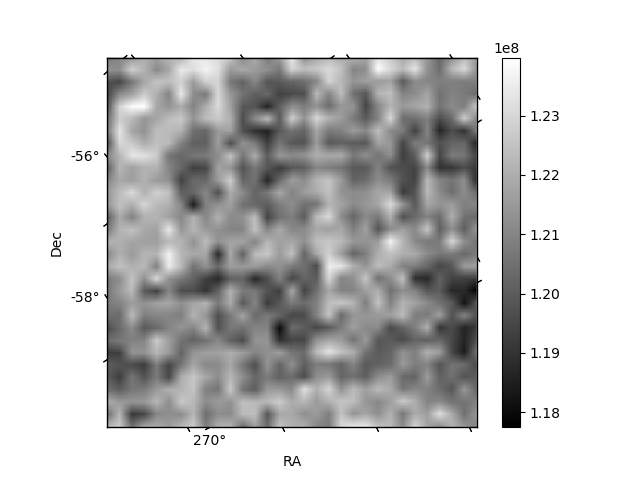
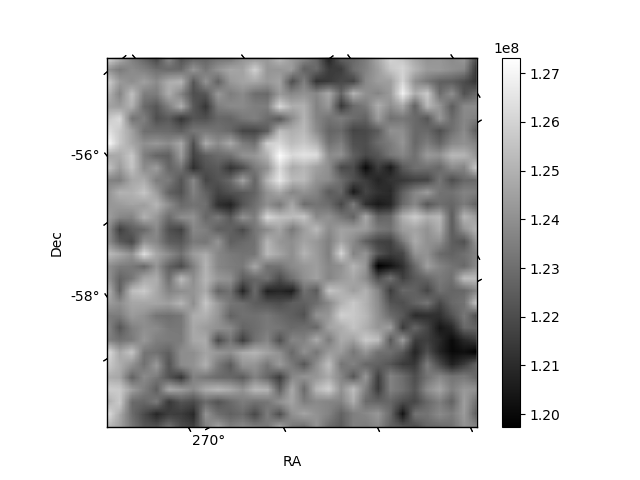
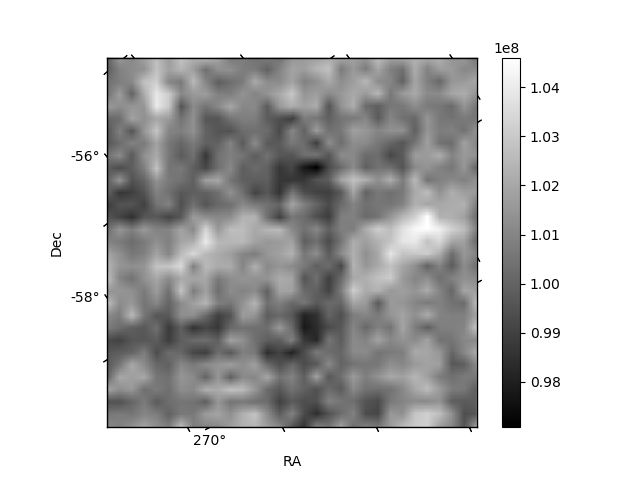
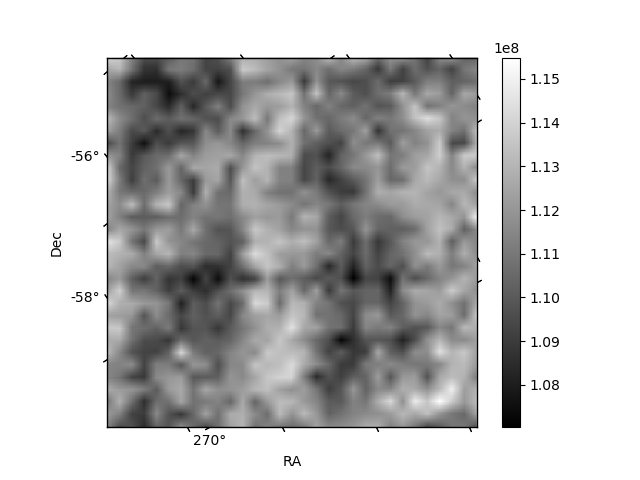
Histogram calculated using DETX and DETY for each event in the final _common_clean file
| Quadrant A | 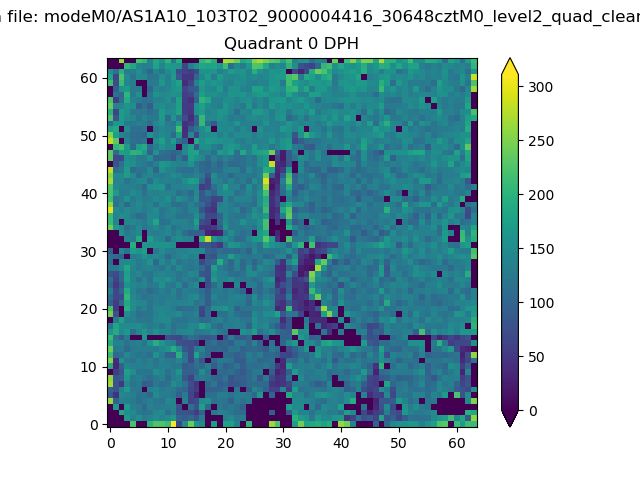 |
 |
Quadrant B |
|---|---|---|---|
| Quadrant D |  |
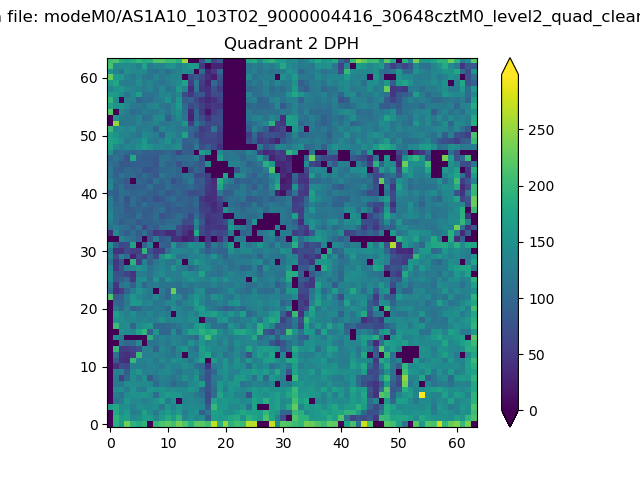 |
Quadrant C |
| Plot type | Count rate plots | Images |
|---|---|---|
| Comparison with Poisson distribution Blue bars denote a histogram of data divided into 1 sec bins. Red curve is a Poisson curve with rate = median count rate of data. |
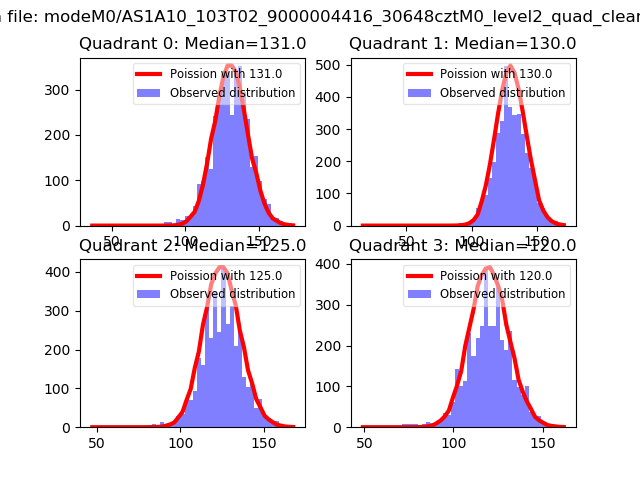 |
 |
| Quadrant-wise count rates Data is divided into 100 sec bins |
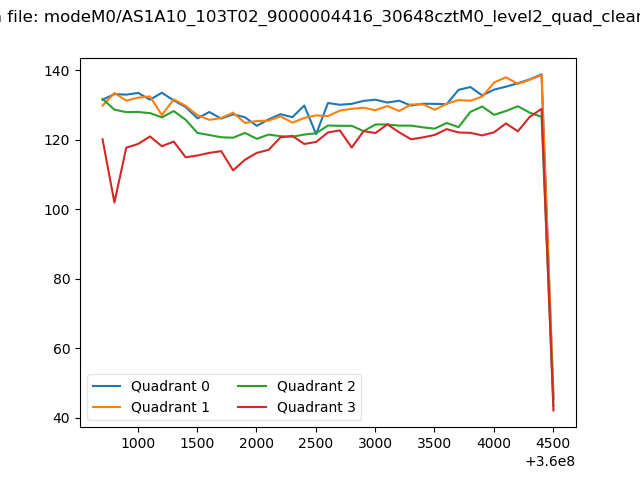 |
|
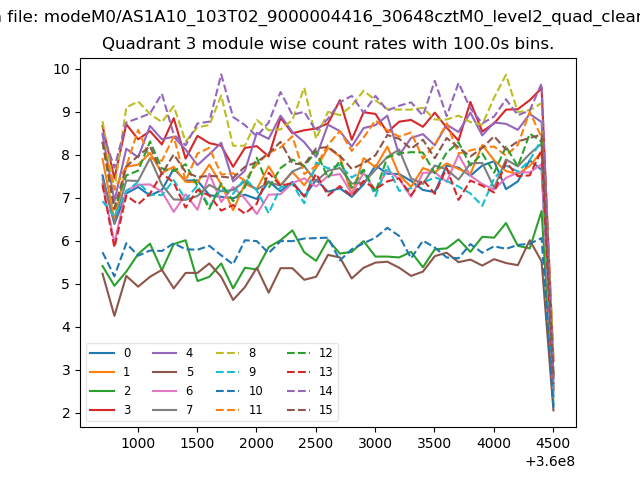
| Module-wise count rates for Quadrant A Data is divided into 100 sec bins |
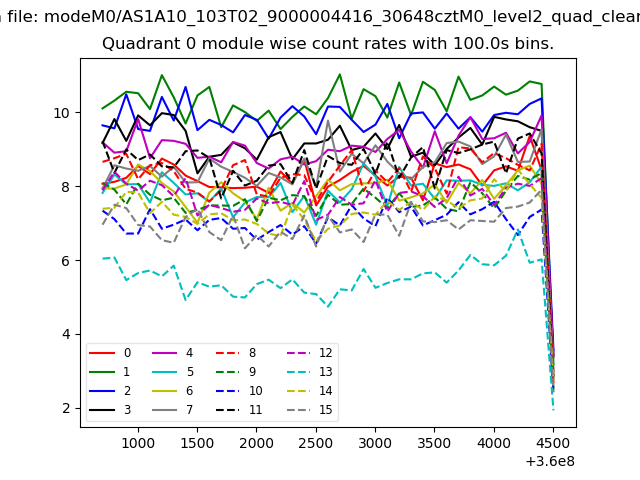 |
 |
| Module-wise count rates for Quadrant B Data is divided into 100 sec bins |
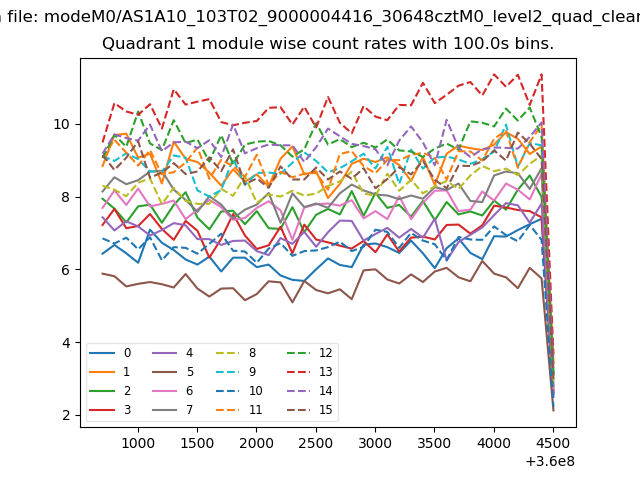 |
 |
| Module-wise count rates for Quadrant C Data is divided into 100 sec bins |
 |
 |
| Module-wise count rates for Quadrant D Data is divided into 100 sec bins |
 |
 |
| Parameter | Plot |
|---|---|
| CZT HV Monitor | 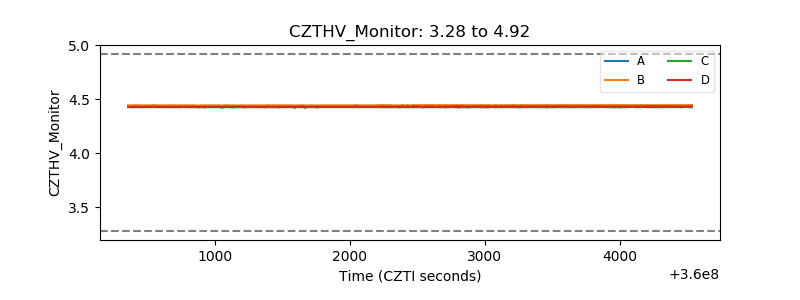 |
| D_VDD | 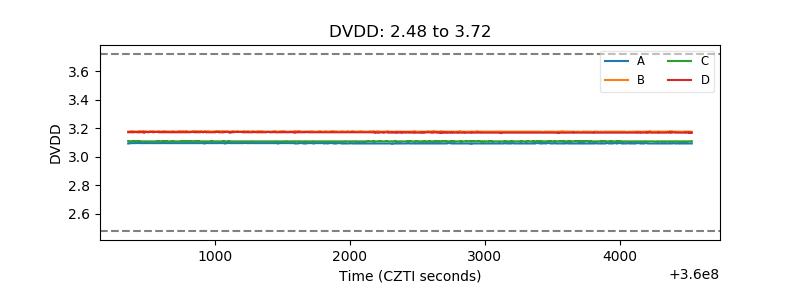 |
| Temperature 1 | 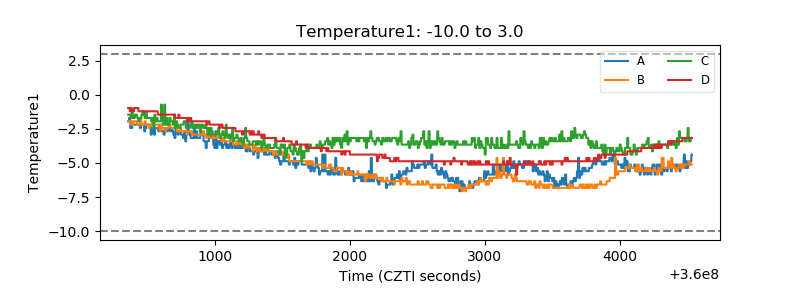 |
| Veto HV Monitor | 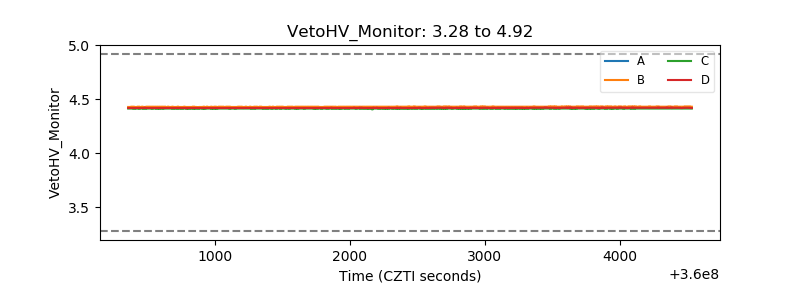 |
| Veto LLD | 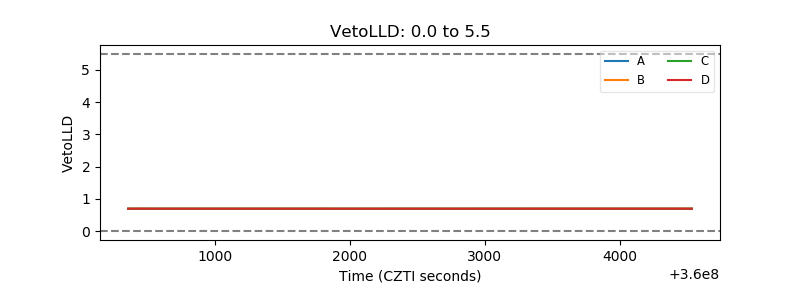 |
| Alpha Counter | 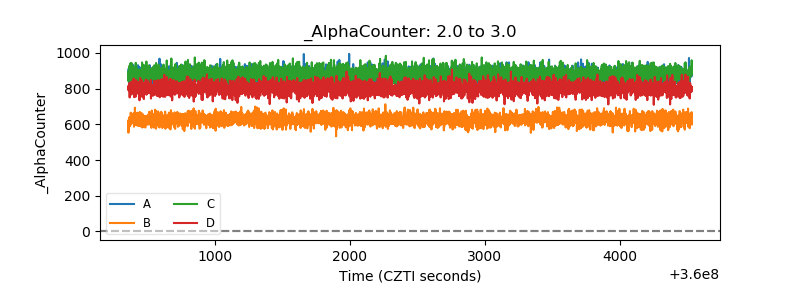 |
| _CPM_Rate | 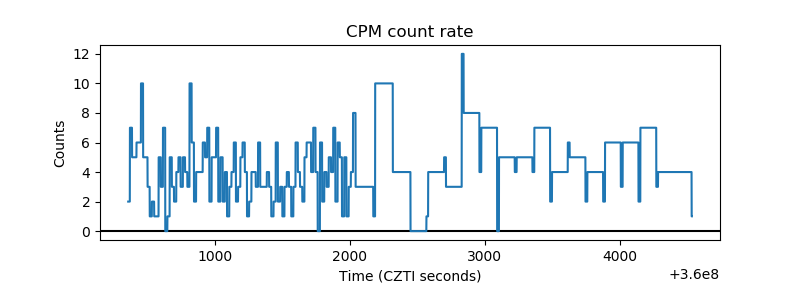 |
| CZT Counter | 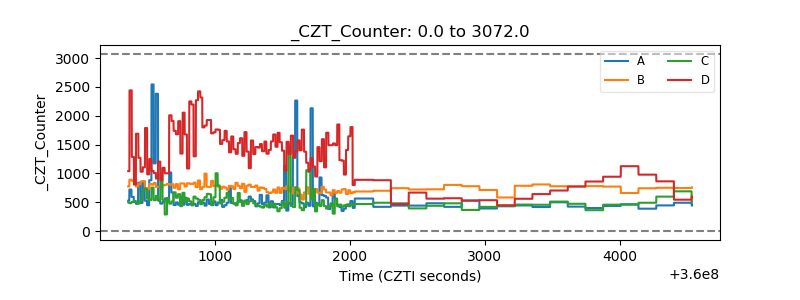 |
| +2.5 Volts monitor |  |
| +5 Volts monitor |  |
| _ROLL_ROT | 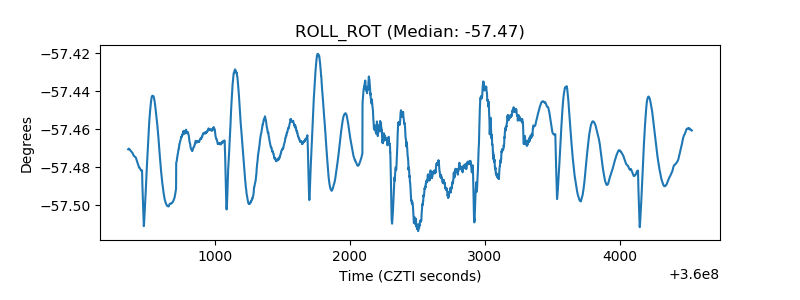 |
| _Roll_DEC | 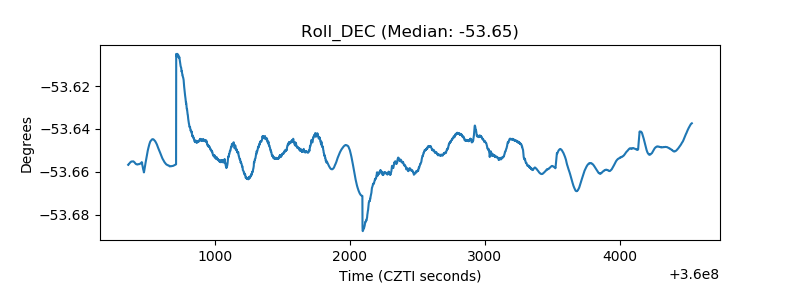 |
| _Roll_RA | 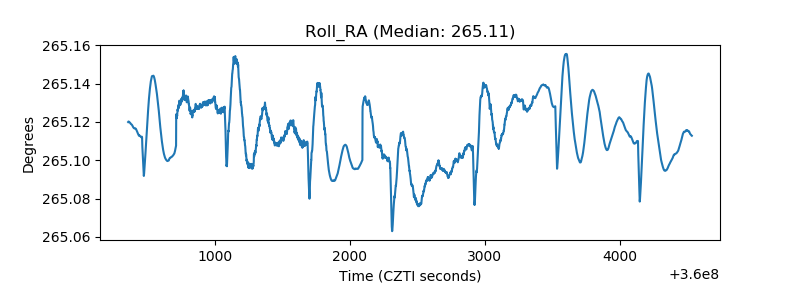 |
| Veto Counter |  |