| Param | Original file | Final file |
|---|---|---|
| Filename | modeM0/AS1A10_103T02_9000004416_30652cztM0_level2.evt | modeM0/AS1A10_103T02_9000004416_30652cztM0_level2_quad_clean.evt |
| Size (bytes) | 1,128,677,760 | 118,820,160 |
| Size | 1.1 GB | 113.3 MB |
| Events in quadrant A | 5,089,621 | 774,453 |
| Events in quadrant B | 7,368,315 | 777,216 |
| Events in quadrant C | 7,284,995 | 704,140 |
| Events in quadrant D | 13,799,646 | 681,753 |
| Mode M9 | |||
|---|---|---|---|
| Quadrant | BADHDUFLAG | Total packets | Discarded packets |
| A | 0 | 3 | 0 |
| B | 0 | 3 | 0 |
| C | 0 | 3 | 0 |
| D | 0 | 3 | 0 |
| Mode M0 | |||
|---|---|---|---|
| Quadrant | BADHDUFLAG | Total packets | Discarded packets |
| A | 0 | 21254 | 4 |
| B | 0 | 28951 | 4 |
| C | 0 | 27684 | 4 |
| D | 0 | 47646 | 4 |
| Mode SS | |||
|---|---|---|---|
| Quadrant | BADHDUFLAG | Total packets | Discarded packets |
| A | 0 | 196 | 0 |
| B | 0 | 196 | 0 |
| C | 0 | 196 | 0 |
| D | 0 | 196 | 0 |
| Quadrant | Total seconds | Saturated seconds | Saturation percentage |
|---|---|---|---|
| A | 9515 | 211 | 2.217551% |
| B | 9516 | 309 | 3.247163% |
| C | 9516 | 837 | 8.795712% |
| D | 9516 | 2020 | 21.227406% |
Noise dominated data is calculated using 1-second bins in cleaned event files. If a bin has >2000 counts, and if more than 50% of those come from <1% of pixels, then it is considered to be noise-dominated and hence unusable.
| Quadrant | # 1 sec bins | Bins with >0 counts | Bins with >2000 counts | High rate bins dominated by noise | Noise dominated (total time) | Noise dominated (detector-on time) | Marked lightcurve |
|---|---|---|---|---|---|---|---|
| A | 9900 | 9519 | 57 | 57 | 0.58% | 0.60% | 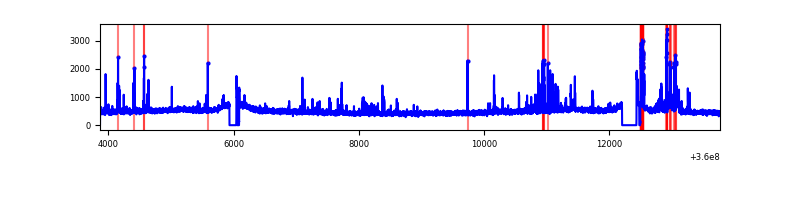 |
| B | 9901 | 9520 | 9 | 9 | 0.09% | 0.09% | 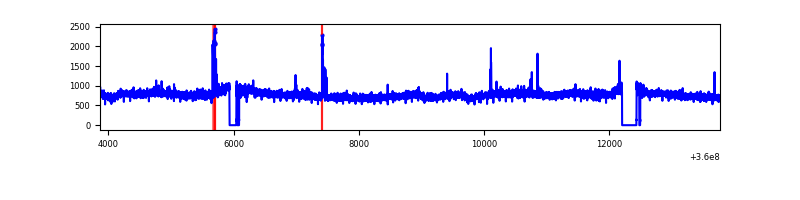 |
| C | 9901 | 9520 | 545 | 545 | 5.50% | 5.72% | 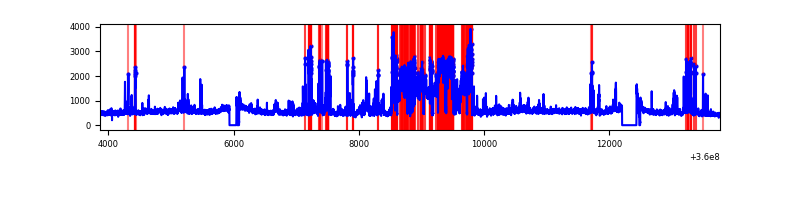 |
| D | 9901 | 9520 | 1683 | 1683 | 17.00% | 17.68% | 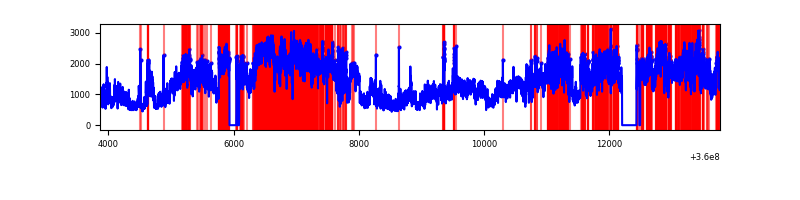 |
Top three noisy pixels from each quadrant. If the there are fewer than three noisy pixels in the level2.evt file, extra rows are filled as -1
| Pixel properties | Quadrant properties | ||||||
|---|---|---|---|---|---|---|---|
| Quadrant | DetID | PixID | Counts | Sigma | Mean | Median | Sigma |
| A | 0 | 13 | 441433 | 1846.07 | 1191 | 1167 | 238.5 |
| A | 8 | 192 | 25974 | 104.02 | 1191 | 1167 | 238.5 |
| A | 13 | 254 | 19150 | 75.4 | 1191 | 1167 | 238.5 |
| B | 6 | 159 | 2624562 | 11722.87 | 1178 | 1147 | 223.8 |
| B | 0 | 229 | 48110 | 209.86 | 1178 | 1147 | 223.8 |
| B | 15 | 36 | 34252 | 147.93 | 1178 | 1147 | 223.8 |
| C | 10 | 22 | 2234566 | 8528.9 | 1118 | 1122 | 261.9 |
| C | 3 | 233 | 434926 | 1656.58 | 1118 | 1122 | 261.9 |
| C | 14 | 238 | 180747 | 685.94 | 1118 | 1122 | 261.9 |
| D | 8 | 195 | 7654348 | 29496.7 | 1091 | 1061 | 259.5 |
| D | 12 | 227 | 1546811 | 5957.51 | 1091 | 1061 | 259.5 |
| D | 13 | 249 | 154002 | 589.45 | 1091 | 1061 | 259.5 |
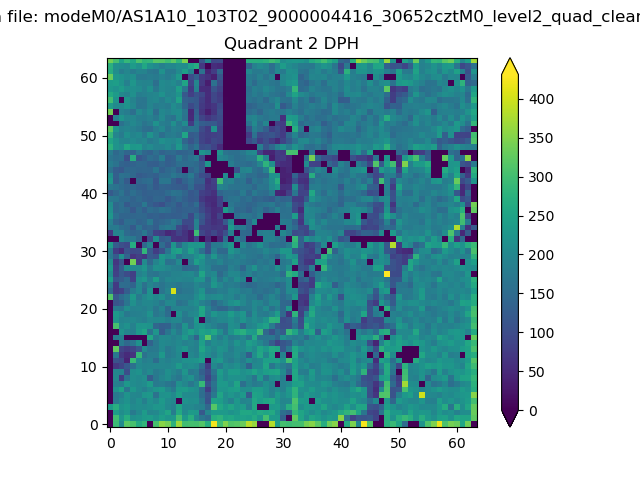
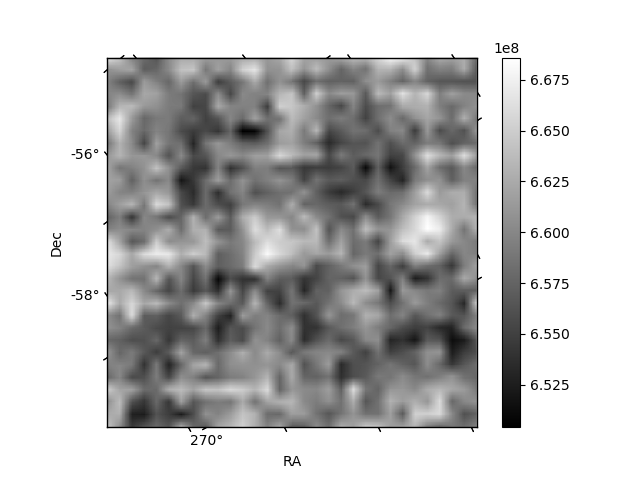
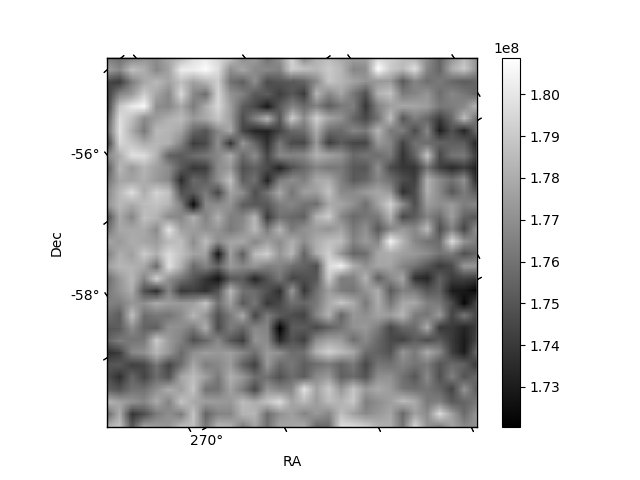
Histogram calculated using DETX and DETY for each event in the final _common_clean file
| Quadrant A | 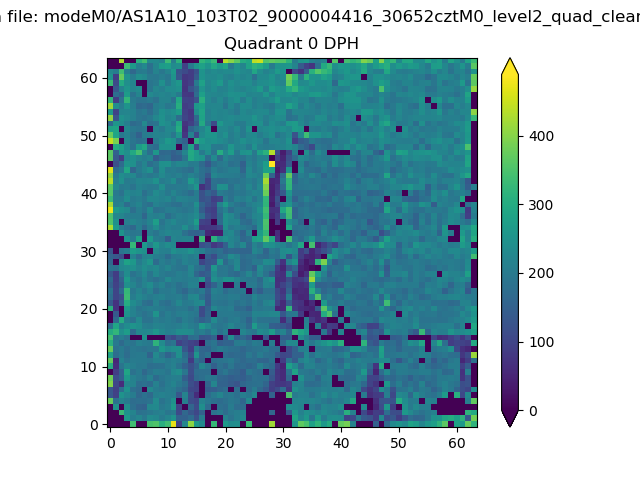 |
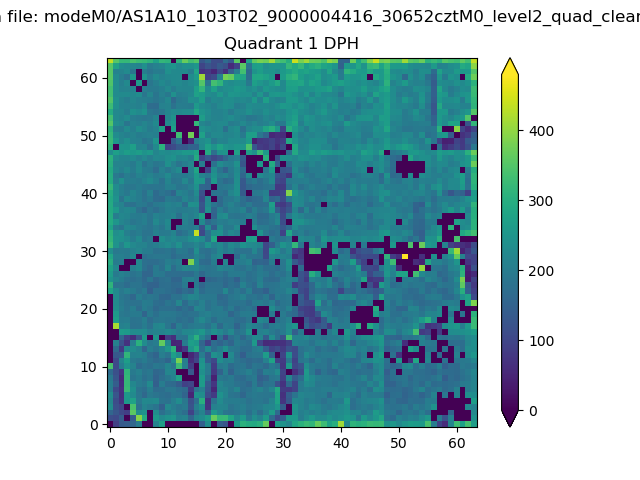 |
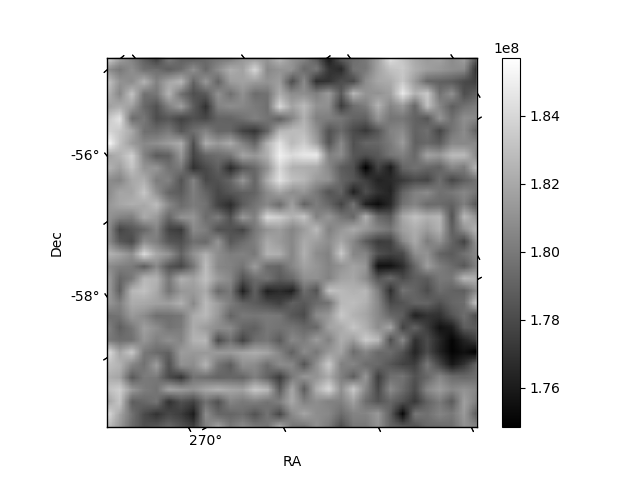
Quadrant B |
|---|---|---|---|
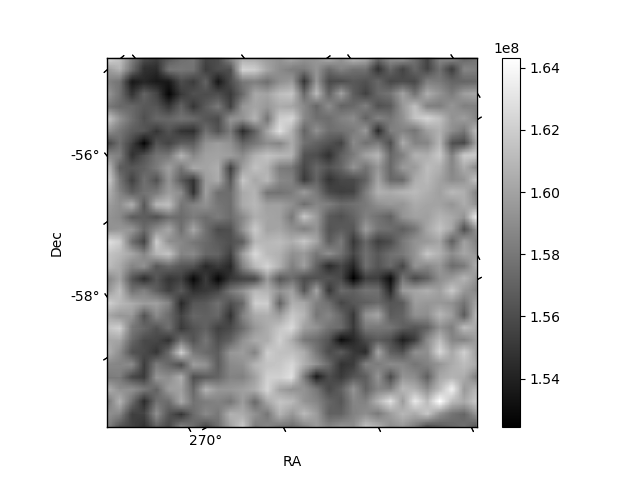
| Quadrant D | 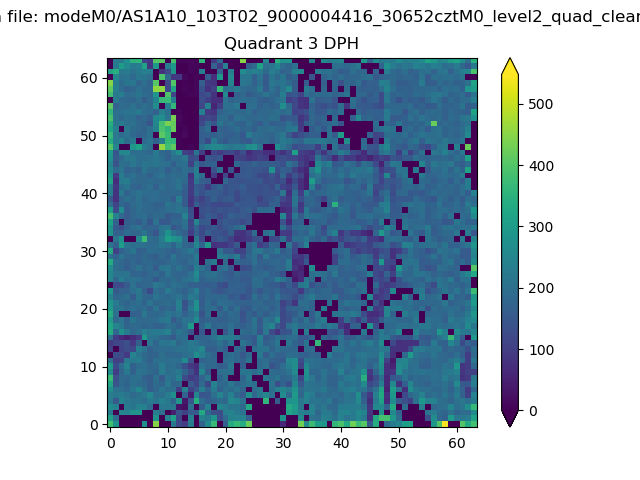 |
 |
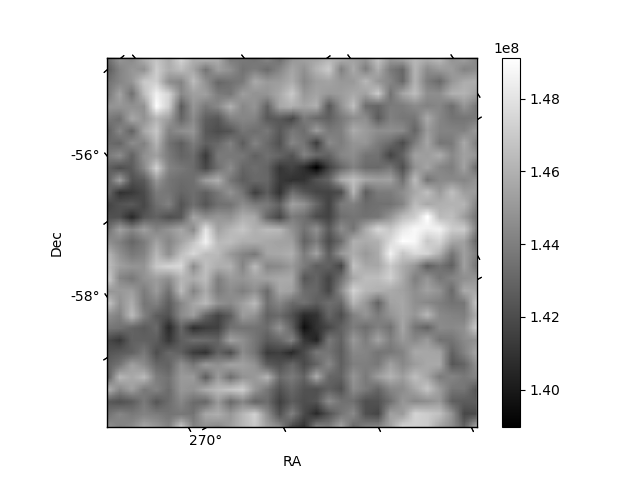
Quadrant C |
| Plot type | Count rate plots | Images |
|---|---|---|
| Comparison with Poisson distribution Blue bars denote a histogram of data divided into 1 sec bins. Red curve is a Poisson curve with rate = median count rate of data. |
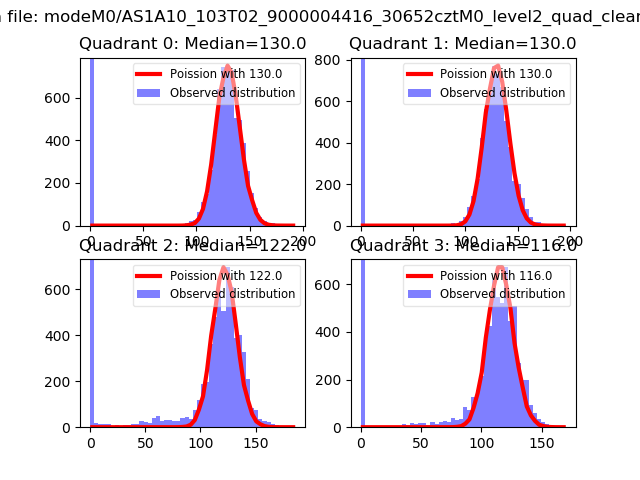 |
 |
| Quadrant-wise count rates Data is divided into 100 sec bins |
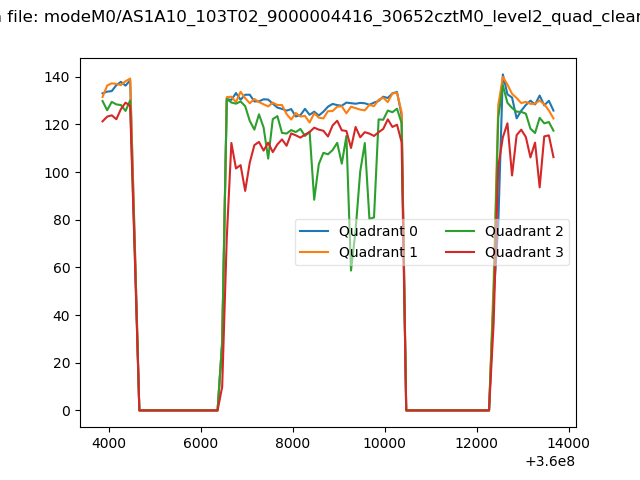 |
|
| Module-wise count rates for Quadrant A Data is divided into 100 sec bins |
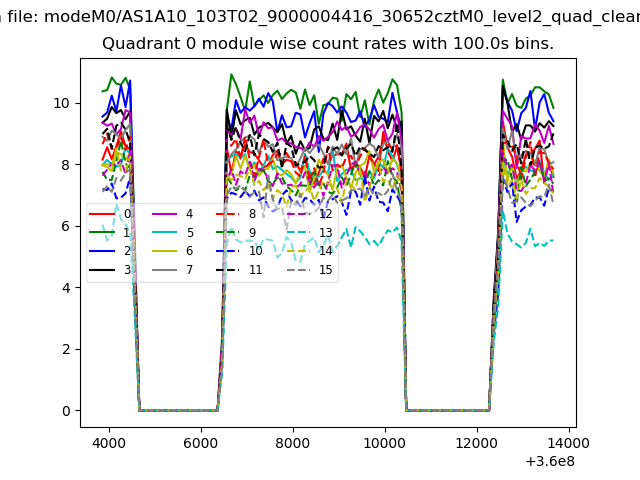 |
 |
| Module-wise count rates for Quadrant B Data is divided into 100 sec bins |
 |
 |
| Module-wise count rates for Quadrant C Data is divided into 100 sec bins |
 |
 |
| Module-wise count rates for Quadrant D Data is divided into 100 sec bins |
 |
 |
| Parameter | Plot |
|---|---|
| CZT HV Monitor | 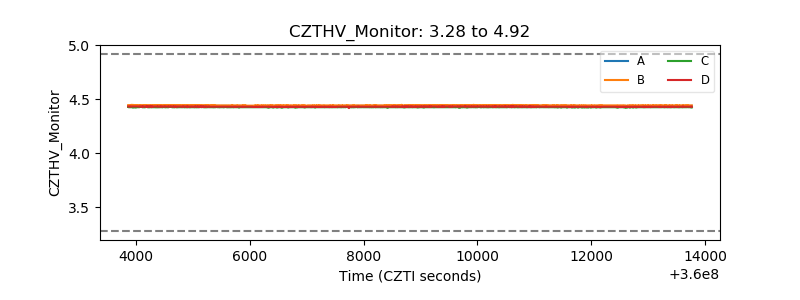 |
| D_VDD | 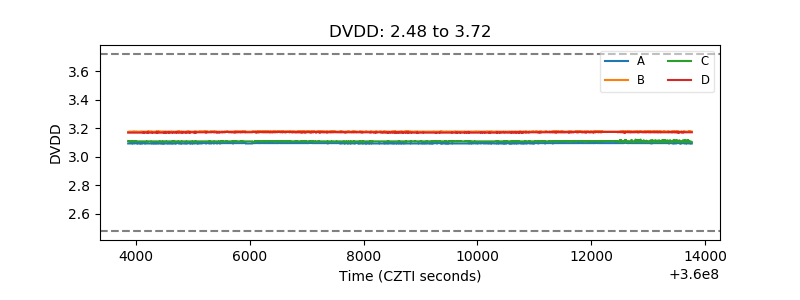 |
| Temperature 1 | 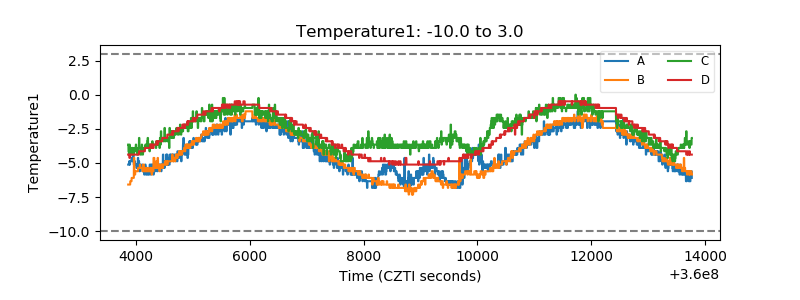 |
| Veto HV Monitor | 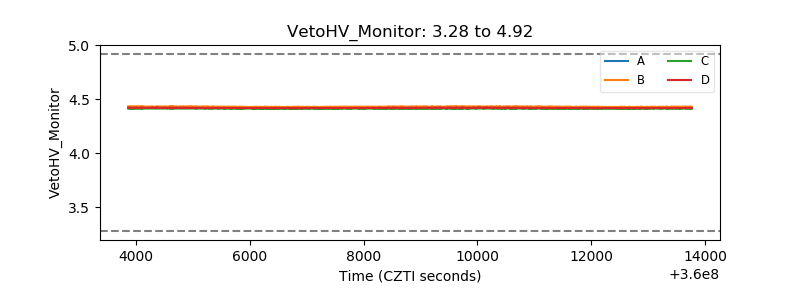 |
| Veto LLD |  |
| Alpha Counter | 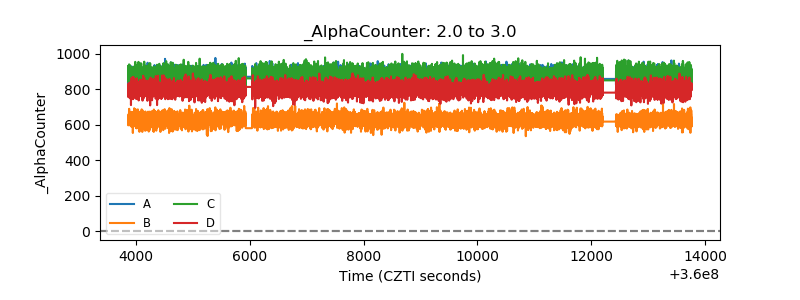 |
| _CPM_Rate | 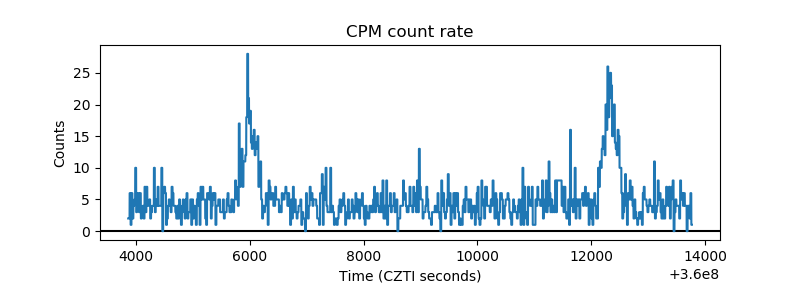 |
| CZT Counter | 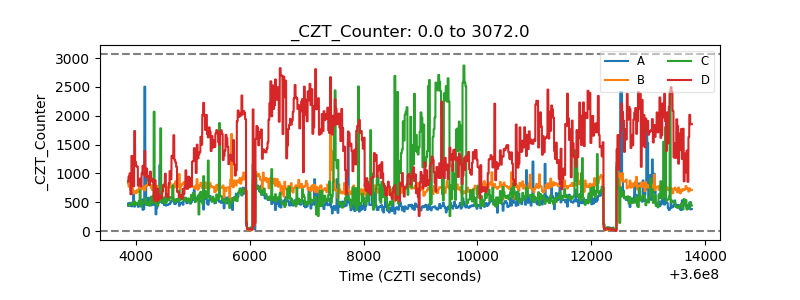 |
| +2.5 Volts monitor |  |
| +5 Volts monitor | 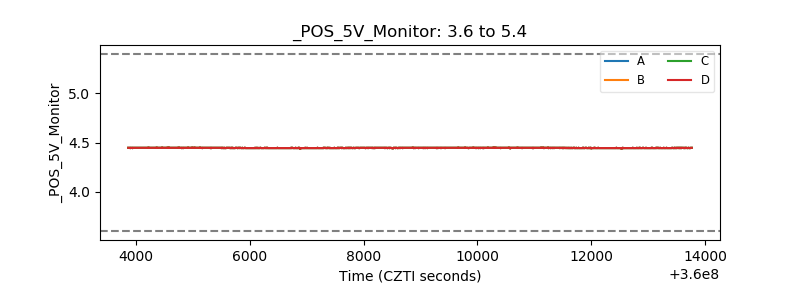 |
| _ROLL_ROT | 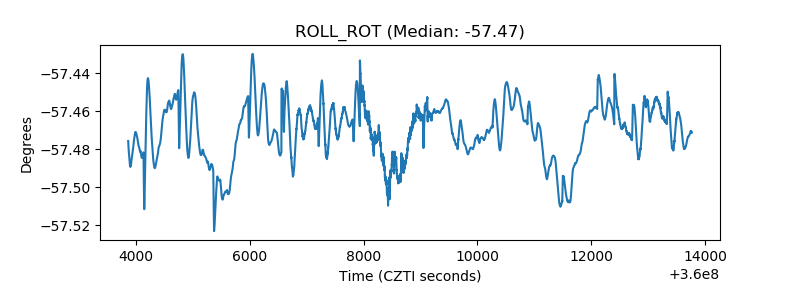 |
| _Roll_DEC | 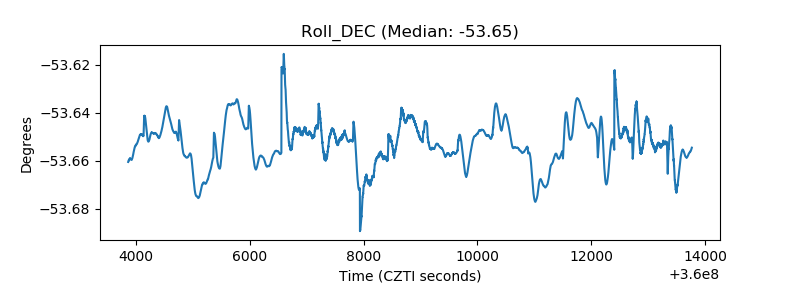 |
| _Roll_RA | 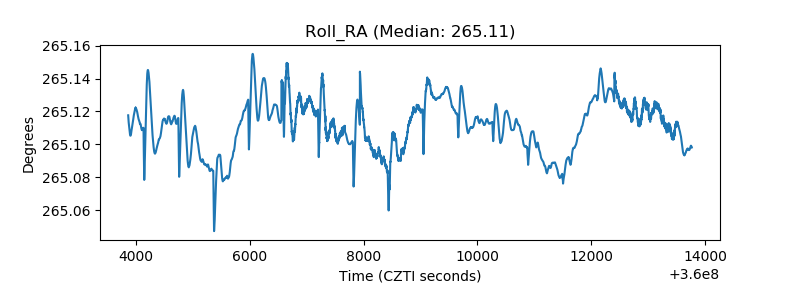 |
| Veto Counter | 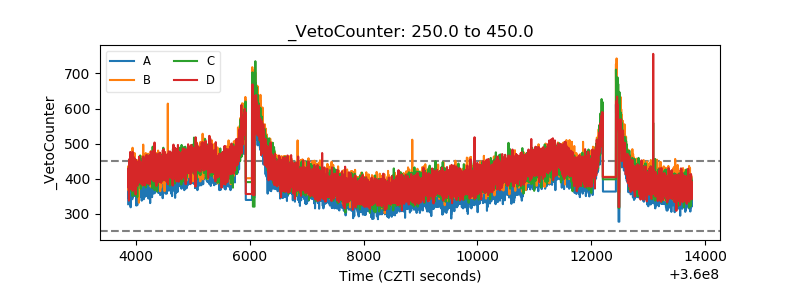 |