| Param | Original file | Final file |
|---|---|---|
| Filename | modeM0/AS1C05_007T01_9000004418cztM0_level2.fits | modeM0/AS1C05_007T01_9000004418cztM0_level2_quad_clean.evt |
| Size (bytes) | 503,784,000 | 290,194,560 |
| Size | 480.4 MB | 276.8 MB |
| Events in quadrant A | 3,271,318 | 1,521,857 |
| Events in quadrant B | 2,983,422 | 1,445,425 |
| Events in quadrant C | 3,088,132 | 1,410,914 |
| Events in quadrant D | 2,590,060 | 1,085,465 |
| Mode M0 | |||
|---|---|---|---|
| Quadrant | BADHDUFLAG | Total packets | Discarded packets |
| A | 0 | 106750 | 0 |
| B | 0 | 161999 | 0 |
| C | 0 | 112307 | 0 |
| D | 0 | 206569 | 0 |
| Mode SS | |||
|---|---|---|---|
| Quadrant | BADHDUFLAG | Total packets | Discarded packets |
| A | 0 | 984 | 0 |
| B | 0 | 984 | 0 |
| C | 0 | 984 | 0 |
| D | 0 | 984 | 0 |
| Mode M9 | |||
|---|---|---|---|
| Quadrant | BADHDUFLAG | Total packets | Discarded packets |
| A | 0 | 93 | 0 |
| B | 0 | 93 | 0 |
| C | 0 | 93 | 0 |
| D | 0 | 93 | 0 |
| Quadrant | Total seconds | Saturated seconds | Saturation percentage |
|---|---|---|---|
| A | 48400 | 595 | 1.229339% |
| B | 48400 | 3481 | 7.192149% |
| C | 48400 | 957 | 1.977273% |
| D | 48400 | 6017 | 12.431818% |
Noise dominated data is calculated using 1-second bins in cleaned event files. If a bin has >2000 counts, and if more than 50% of those come from <1% of pixels, then it is considered to be noise-dominated and hence unusable.
| Quadrant | # 1 sec bins | Bins with >0 counts | Bins with >2000 counts | High rate bins dominated by noise | Noise dominated (total time) | Noise dominated (detector-on time) | Marked lightcurve |
|---|---|---|---|---|---|---|---|
| A | 57675 | 48397 | 0 | 0 | 0.00% | 0.00% |  |
| B | 57675 | 48390 | 0 | 0 | 0.00% | 0.00% |  |
| C | 57675 | 48398 | 0 | 0 | 0.00% | 0.00% |  |
| D | 57675 | 48397 | 0 | 0 | 0.00% | 0.00% |  |
Top three noisy pixels from each quadrant. If the there are fewer than three noisy pixels in the level2.evt file, extra rows are filled as -1
| Pixel properties | Quadrant properties | ||||||
|---|---|---|---|---|---|---|---|
| Quadrant | DetID | PixID | Counts | Sigma | Mean | Median | Sigma |
| A | 0 | 29 | 2694 | 9.1 | 853 | 806 | 207.5 |
| A | 7 | 110 | 2527 | 8.29 | 853 | 806 | 207.5 |
| A | 9 | 19 | 2438 | 7.86 | 853 | 806 | 207.5 |
| B | 2 | 9 | 2336 | 10.17 | 788 | 756 | 155.3 |
| B | 5 | 128 | 2030 | 8.2 | 788 | 756 | 155.3 |
| B | 5 | 225 | 1954 | 7.71 | 788 | 756 | 155.3 |
| C | 1 | 81 | 2327 | 7.53 | 817 | 768 | 207.1 |
| C | 1 | 80 | 2284 | 7.32 | 817 | 768 | 207.1 |
| C | 3 | 187 | 2098 | 6.42 | 817 | 768 | 207.1 |
| D | 15 | 46 | 1984 | 6.71 | 740 | 678 | 194.7 |
| D | 10 | 189 | 1861 | 6.08 | 740 | 678 | 194.7 |
| D | 7 | 3 | 1807 | 5.8 | 740 | 678 | 194.7 |
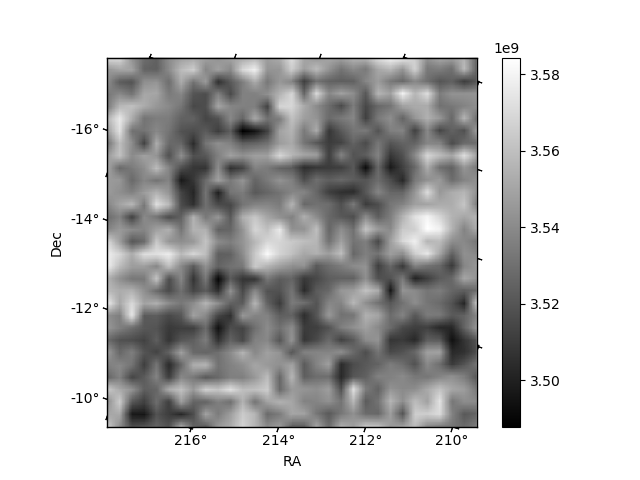
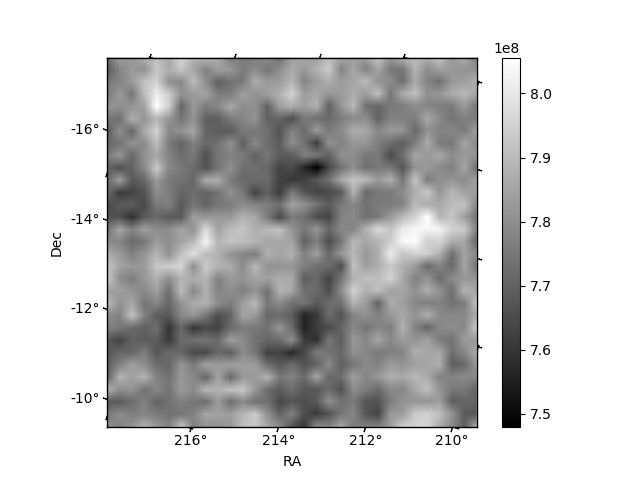
Histogram calculated using DETX and DETY for each event in the final _common_clean file
| Quadrant A |  |
 |
Quadrant B |
|---|---|---|---|
| Quadrant D |  |
 |
Quadrant C |
| Plot type | Count rate plots | Images |
|---|---|---|
| Comparison with Poisson distribution Blue bars denote a histogram of data divided into 1 sec bins. Red curve is a Poisson curve with rate = median count rate of data. |
 |
 |
| Quadrant-wise count rates Data is divided into 100 sec bins |
 |
|
| Module-wise count rates for Quadrant A Data is divided into 100 sec bins |
 |
 |
| Module-wise count rates for Quadrant B Data is divided into 100 sec bins |
 |
 |
| Module-wise count rates for Quadrant C Data is divided into 100 sec bins |
 |
 |
| Module-wise count rates for Quadrant D Data is divided into 100 sec bins |
 |
 |
| Parameter | Plot |
|---|---|
| CZT HV Monitor |  |
| D_VDD |  |
| Temperature 1 |  |
| Veto HV Monitor |  |
| Veto LLD |  |
| Alpha Counter |  |
| _CPM_Rate |  |
| CZT Counter |  |
| +2.5 Volts monitor |  |
| +5 Volts monitor | 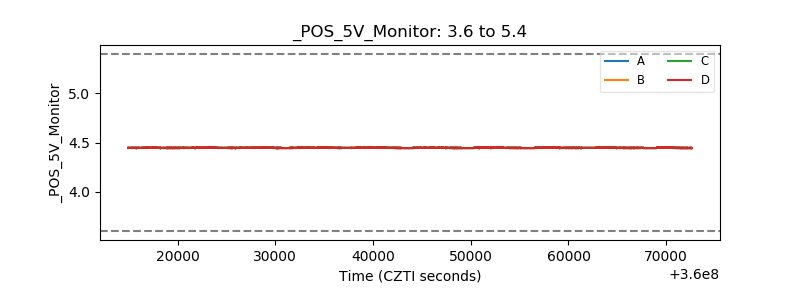 |
| _ROLL_ROT |  |
| _Roll_DEC |  |
| _Roll_RA |  |
| Veto Counter |  |