| Param | Original file | Final file |
|---|---|---|
| Filename | modeM0/AS1C05_007T01_9000004418_30652cztM0_level2.evt | modeM0/AS1C05_007T01_9000004418_30652cztM0_level2_quad_clean.evt |
| Size (bytes) | 1,678,962,240 | 190,411,200 |
| Size | 1.6 GB | 181.6 MB |
| Events in quadrant A | 8,313,798 | 1,234,495 |
| Events in quadrant B | 17,372,150 | 1,164,368 |
| Events in quadrant C | 8,174,137 | 1,173,813 |
| Events in quadrant D | 15,902,496 | 1,080,602 |
| Mode M0 | |||
|---|---|---|---|
| Quadrant | BADHDUFLAG | Total packets | Discarded packets |
| A | 0 | 35058 | 3 |
| B | 0 | 62960 | 4 |
| C | 0 | 34282 | 3 |
| D | 0 | 58197 | 3 |
| Mode SS | |||
|---|---|---|---|
| Quadrant | BADHDUFLAG | Total packets | Discarded packets |
| A | 0 | 328 | 0 |
| B | 0 | 328 | 0 |
| C | 0 | 328 | 0 |
| D | 0 | 328 | 0 |
| Mode M9 | |||
|---|---|---|---|
| Quadrant | BADHDUFLAG | Total packets | Discarded packets |
| A | 0 | 18 | 0 |
| B | 0 | 18 | 0 |
| C | 0 | 18 | 0 |
| D | 0 | 18 | 0 |
| Quadrant | Total seconds | Saturated seconds | Saturation percentage |
|---|---|---|---|
| A | 16127 | 211 | 1.308365% |
| B | 16126 | 2977 | 18.460871% |
| C | 16126 | 243 | 1.506883% |
| D | 16126 | 1911 | 11.850428% |
Noise dominated data is calculated using 1-second bins in cleaned event files. If a bin has >2000 counts, and if more than 50% of those come from <1% of pixels, then it is considered to be noise-dominated and hence unusable.
| Quadrant | # 1 sec bins | Bins with >0 counts | Bins with >2000 counts | High rate bins dominated by noise | Noise dominated (total time) | Noise dominated (detector-on time) | Marked lightcurve |
|---|---|---|---|---|---|---|---|
| A | 17977 | 16130 | 98 | 98 | 0.55% | 0.61% | 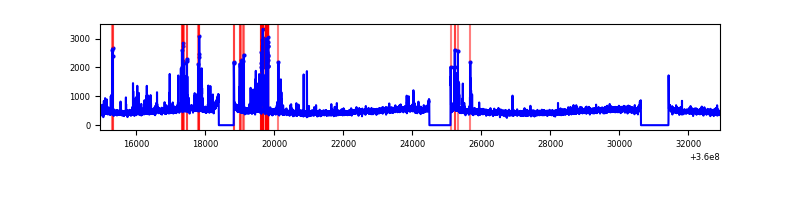 |
| B | 17976 | 16129 | 2195 | 2195 | 12.21% | 13.61% | 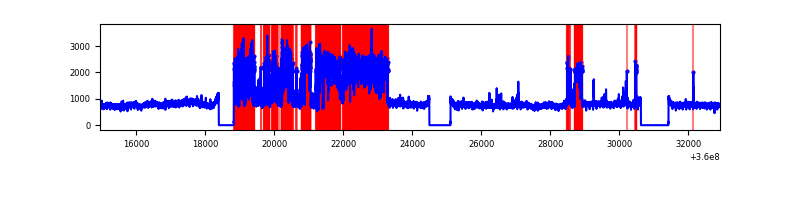 |
| C | 17976 | 16129 | 9 | 9 | 0.05% | 0.06% | 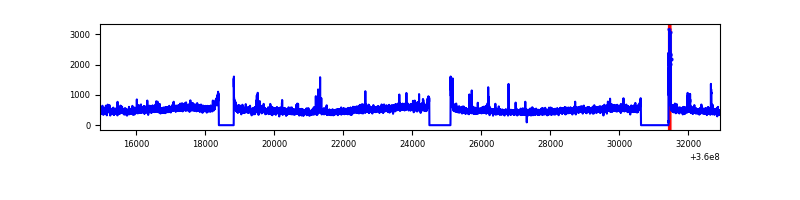 |
| D | 17976 | 16129 | 1958 | 1958 | 10.89% | 12.14% | 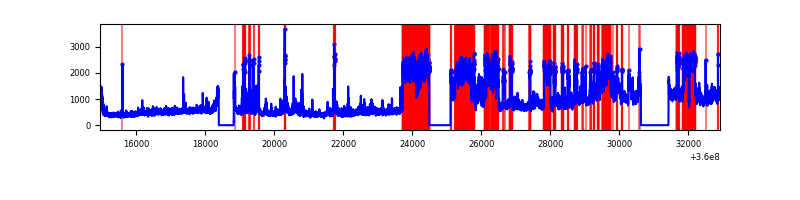 |
Top three noisy pixels from each quadrant. If the there are fewer than three noisy pixels in the level2.evt file, extra rows are filled as -1
| Pixel properties | Quadrant properties | ||||||
|---|---|---|---|---|---|---|---|
| Quadrant | DetID | PixID | Counts | Sigma | Mean | Median | Sigma |
| A | 0 | 13 | 382644 | 957.97 | 1986 | 1945 | 397.4 |
| A | 12 | 96 | 240198 | 599.52 | 1986 | 1945 | 397.4 |
| A | 8 | 192 | 33592 | 79.63 | 1986 | 1945 | 397.4 |
| B | 6 | 36 | 5799102 | 16420.71 | 1831 | 1782 | 353.0 |
| B | 6 | 159 | 4294580 | 12159.2 | 1831 | 1782 | 353.0 |
| B | 12 | 111 | 44387 | 120.68 | 1831 | 1782 | 353.0 |
| C | 3 | 233 | 311139 | 697.11 | 1889 | 1903 | 443.6 |
| C | 14 | 238 | 303520 | 679.93 | 1889 | 1903 | 443.6 |
| C | 0 | 10 | 105465 | 233.46 | 1889 | 1903 | 443.6 |
| D | 8 | 195 | 6037952 | 12838.26 | 1841 | 1803 | 470.2 |
| D | 10 | 253 | 1636403 | 3476.62 | 1841 | 1803 | 470.2 |
| D | 12 | 227 | 926977 | 1967.75 | 1841 | 1803 | 470.2 |
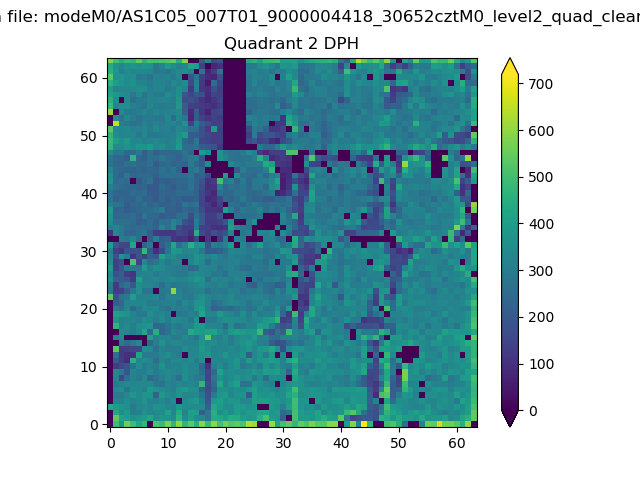
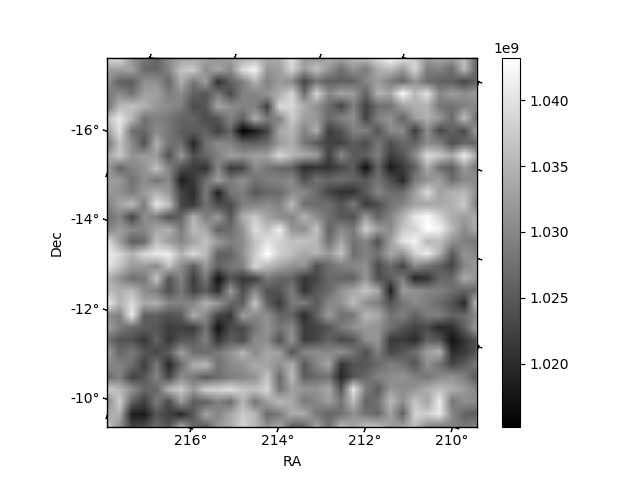
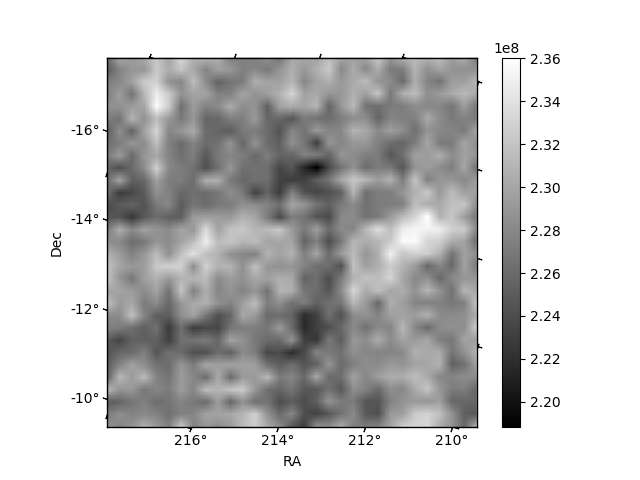
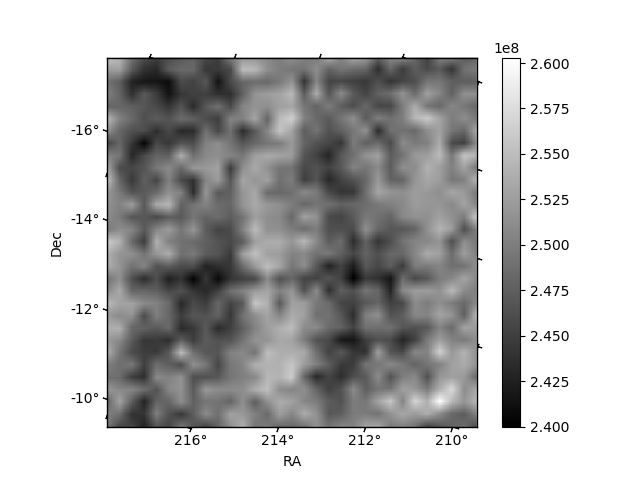
Histogram calculated using DETX and DETY for each event in the final _common_clean file
| Quadrant A | 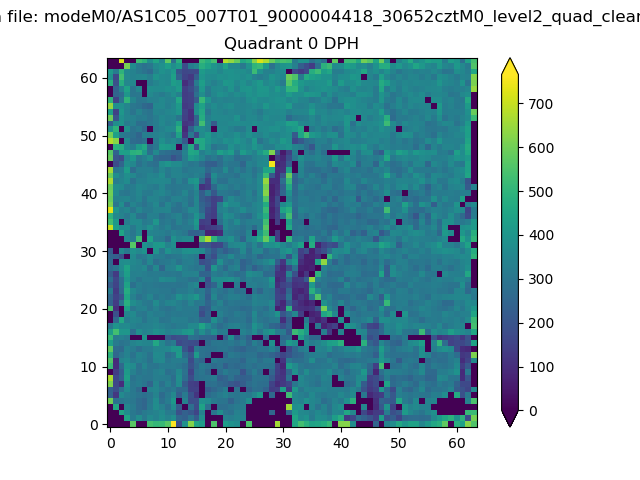 |
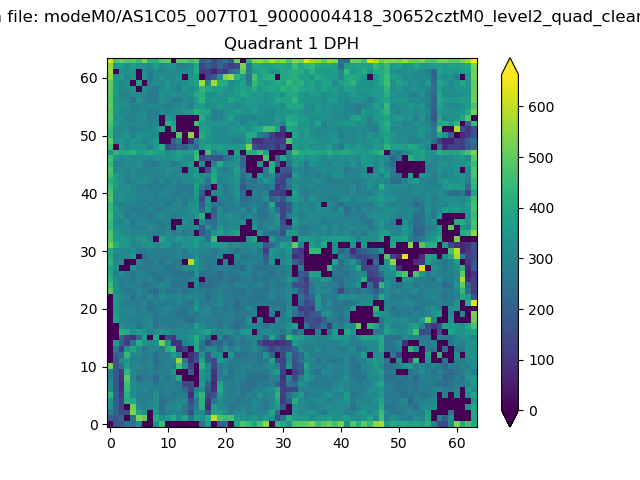 |
Quadrant B |
|---|---|---|---|
| Quadrant D | 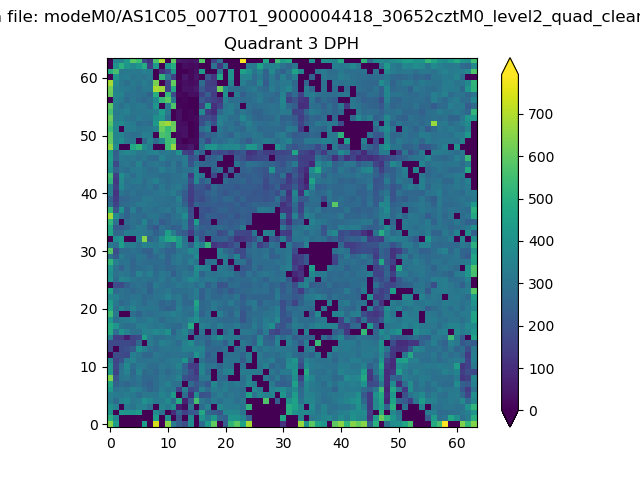 |
 |
Quadrant C |
| Plot type | Count rate plots | Images |
|---|---|---|
| Comparison with Poisson distribution Blue bars denote a histogram of data divided into 1 sec bins. Red curve is a Poisson curve with rate = median count rate of data. |
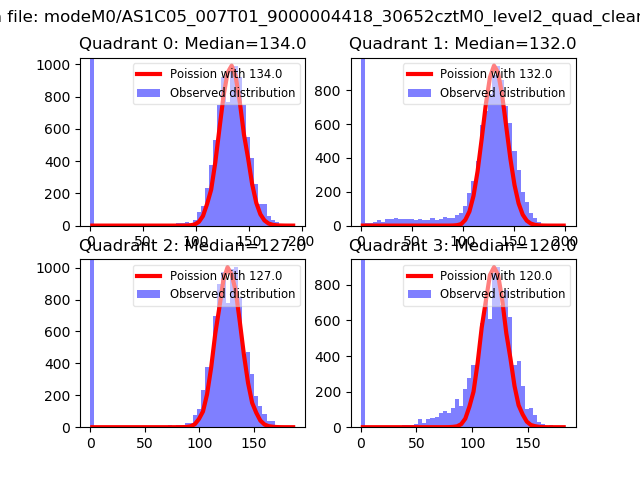 |
 |
| Quadrant-wise count rates Data is divided into 100 sec bins |
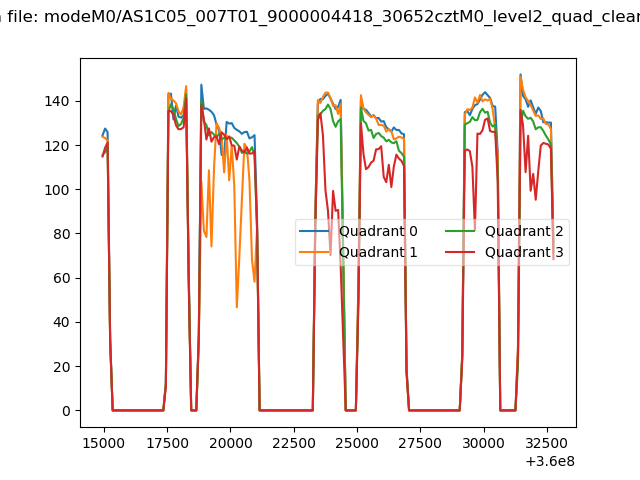 |
|
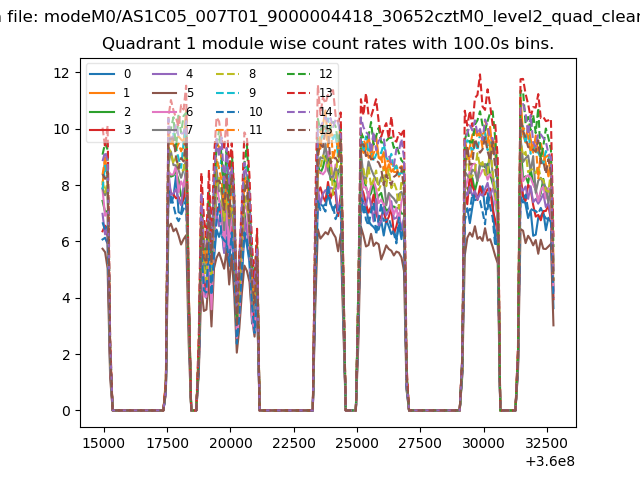
| Module-wise count rates for Quadrant A Data is divided into 100 sec bins |
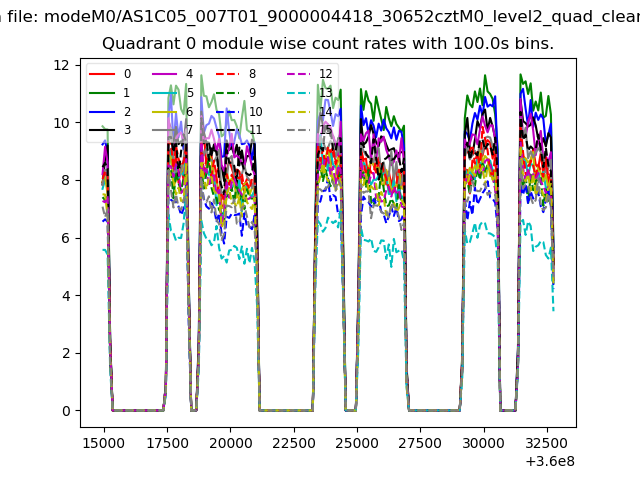 |
 |
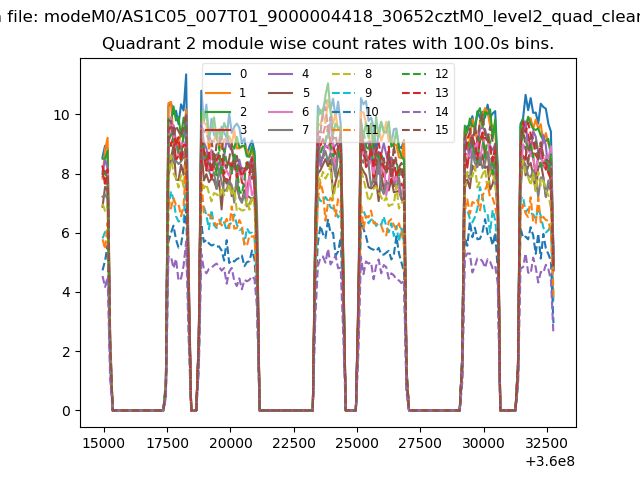
| Module-wise count rates for Quadrant B Data is divided into 100 sec bins |
 |
 |
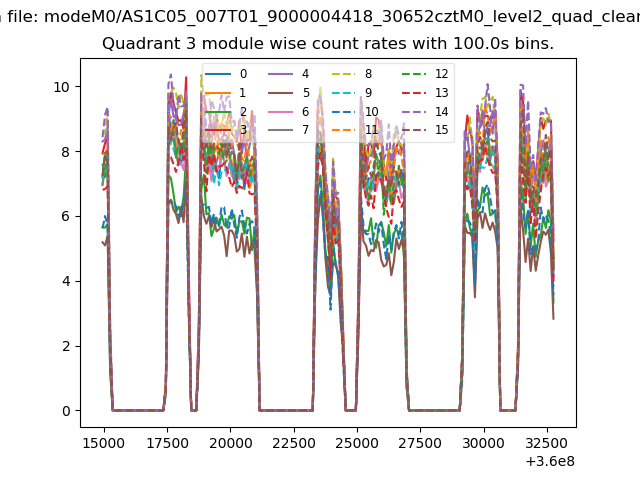
| Module-wise count rates for Quadrant C Data is divided into 100 sec bins |
 |
 |
| Module-wise count rates for Quadrant D Data is divided into 100 sec bins |
 |
 |
| Parameter | Plot |
|---|---|
| CZT HV Monitor | 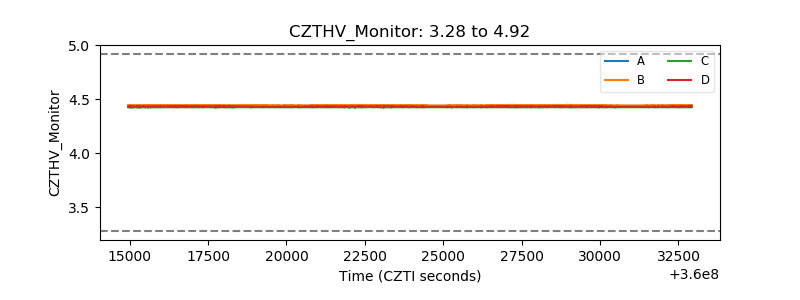 |
| D_VDD | 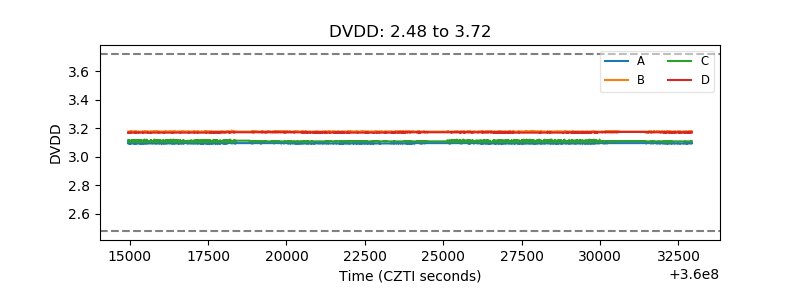 |
| Temperature 1 | 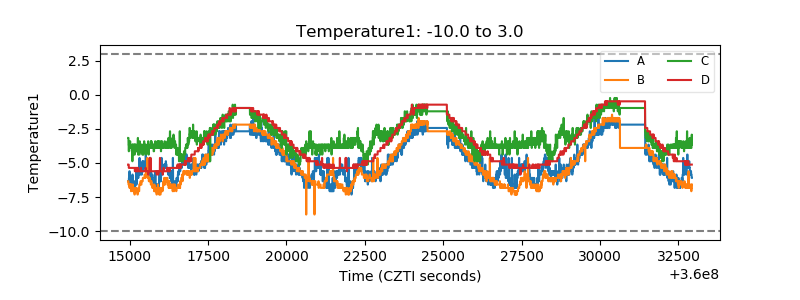 |
| Veto HV Monitor | 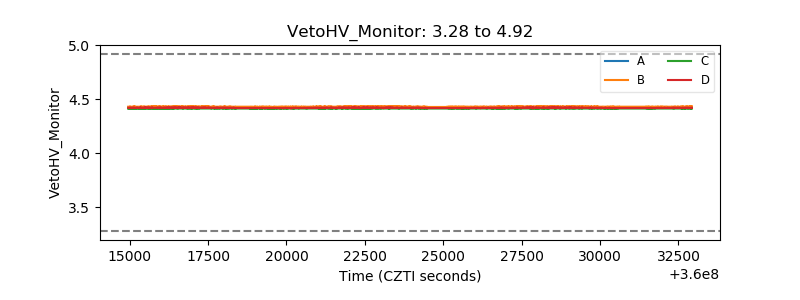 |
| Veto LLD | 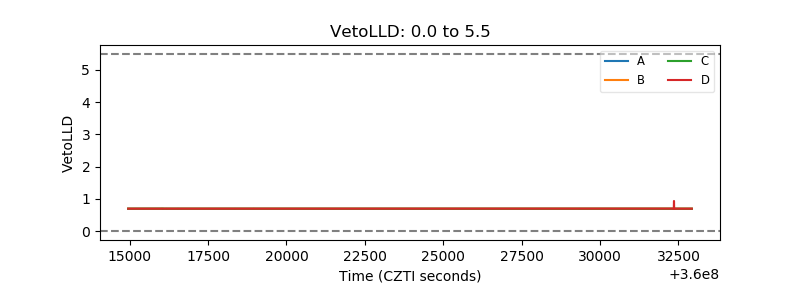 |
| Alpha Counter | 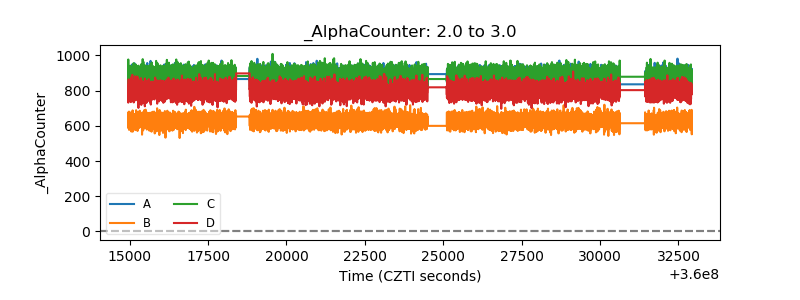 |
| _CPM_Rate | 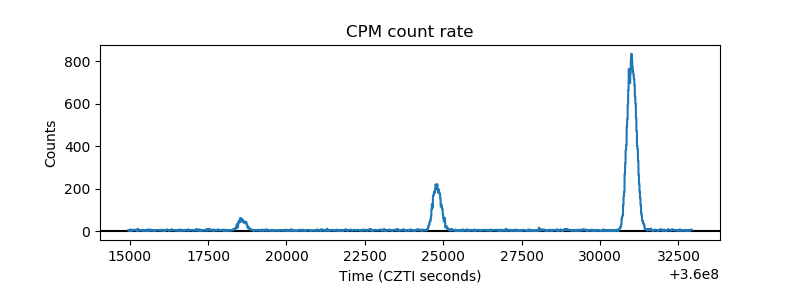 |
| CZT Counter | 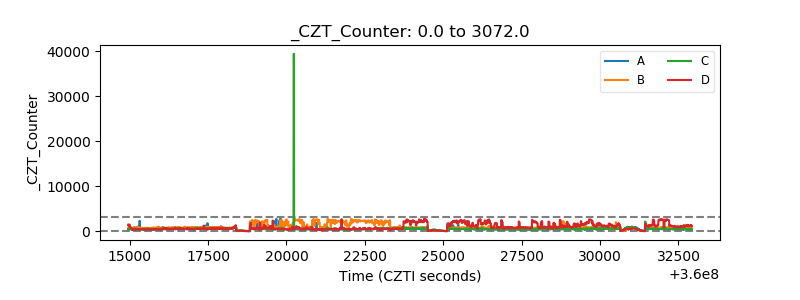 |
| +2.5 Volts monitor |  |
| +5 Volts monitor |  |
| _ROLL_ROT | 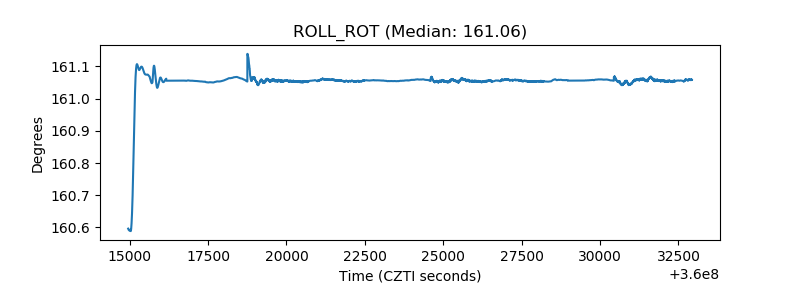 |
| _Roll_DEC | 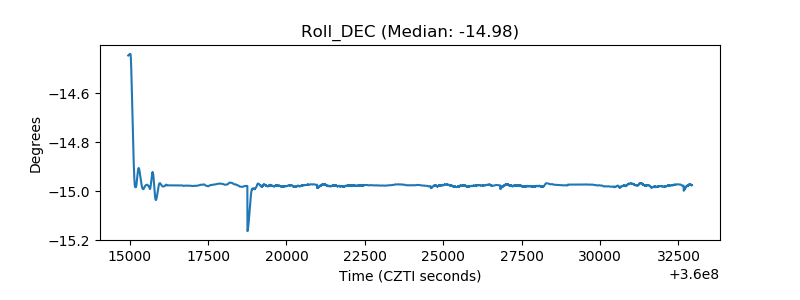 |
| _Roll_RA | 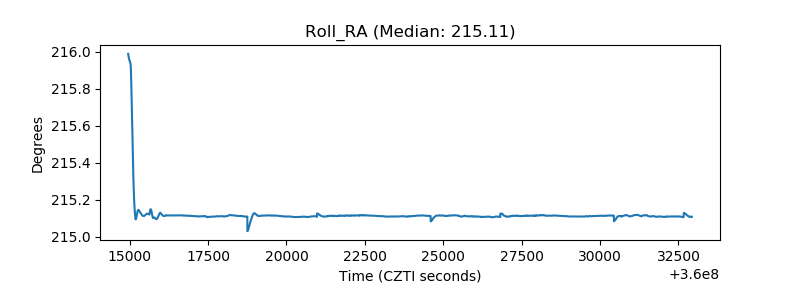 |
| Veto Counter | 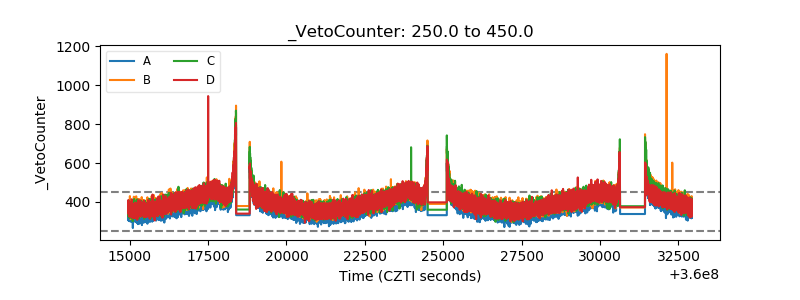 |