| Param | Original file | Final file |
|---|---|---|
| Filename | modeM0/AS1C05_007T01_9000004418_30653cztM0_level2.evt | modeM0/AS1C05_007T01_9000004418_30653cztM0_level2_quad_clean.evt |
| Size (bytes) | 659,424,960 | 79,499,520 |
| Size | 628.9 MB | 75.8 MB |
| Events in quadrant A | 3,074,188 | 515,570 |
| Events in quadrant B | 4,919,252 | 512,752 |
| Events in quadrant C | 3,240,716 | 486,029 |
| Events in quadrant D | 8,304,068 | 445,405 |
| Mode M0 | |||
|---|---|---|---|
| Quadrant | BADHDUFLAG | Total packets | Discarded packets |
| A | 0 | 13129 | 0 |
| B | 0 | 19282 | 0 |
| C | 0 | 13550 | 0 |
| D | 0 | 29225 | 0 |
| Mode SS | |||
|---|---|---|---|
| Quadrant | BADHDUFLAG | Total packets | Discarded packets |
| A | 0 | 130 | 0 |
| B | 0 | 130 | 0 |
| C | 0 | 130 | 0 |
| D | 0 | 130 | 0 |
| Mode M9 | |||
|---|---|---|---|
| Quadrant | BADHDUFLAG | Total packets | Discarded packets |
| A | 0 | 10 | 0 |
| B | 0 | 10 | 0 |
| C | 0 | 10 | 0 |
| D | 0 | 10 | 0 |
| Quadrant | Total seconds | Saturated seconds | Saturation percentage |
|---|---|---|---|
| A | 6411 | 35 | 0.545937% |
| B | 6411 | 60 | 0.935891% |
| C | 6411 | 83 | 1.294650% |
| D | 6411 | 723 | 11.277492% |
Noise dominated data is calculated using 1-second bins in cleaned event files. If a bin has >2000 counts, and if more than 50% of those come from <1% of pixels, then it is considered to be noise-dominated and hence unusable.
| Quadrant | # 1 sec bins | Bins with >0 counts | Bins with >2000 counts | High rate bins dominated by noise | Noise dominated (total time) | Noise dominated (detector-on time) | Marked lightcurve |
|---|---|---|---|---|---|---|---|
| A | 7386 | 6412 | 1 | 1 | 0.01% | 0.02% | 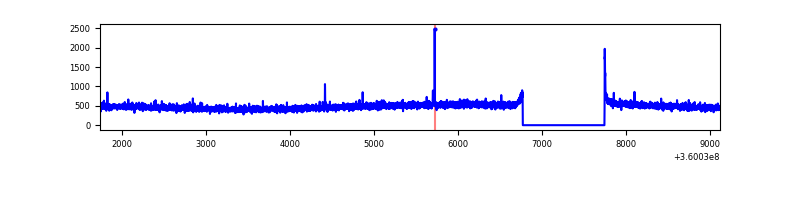 |
| B | 7386 | 6412 | 2 | 2 | 0.03% | 0.03% | 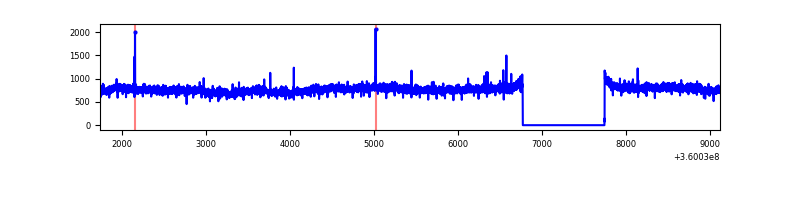 |
| C | 7386 | 6412 | 15 | 15 | 0.20% | 0.23% | 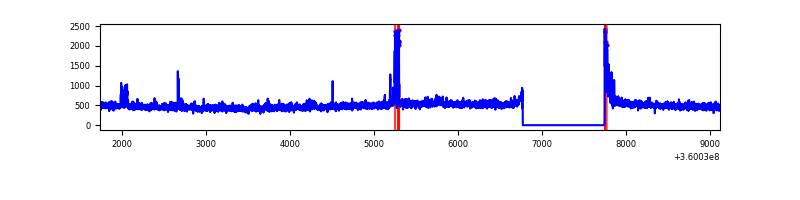 |
| D | 7386 | 6412 | 742 | 742 | 10.05% | 11.57% | 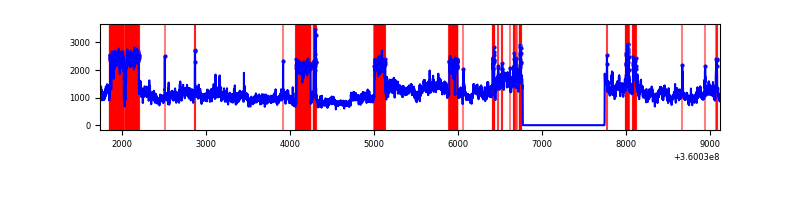 |
Top three noisy pixels from each quadrant. If the there are fewer than three noisy pixels in the level2.evt file, extra rows are filled as -1
| Pixel properties | Quadrant properties | ||||||
|---|---|---|---|---|---|---|---|
| Quadrant | DetID | PixID | Counts | Sigma | Mean | Median | Sigma |
| A | 13 | 254 | 12434 | 72.81 | 791 | 774 | 160.1 |
| A | 0 | 13 | 11218 | 65.22 | 791 | 774 | 160.1 |
| A | 8 | 192 | 8513 | 48.33 | 791 | 774 | 160.1 |
| B | 6 | 159 | 1813626 | 12055.45 | 782 | 763 | 150.4 |
| B | 12 | 111 | 18623 | 118.77 | 782 | 763 | 150.4 |
| B | 11 | 111 | 17114 | 108.73 | 782 | 763 | 150.4 |
| C | 14 | 238 | 121223 | 684.13 | 749 | 754 | 176.1 |
| C | 3 | 233 | 112778 | 636.17 | 749 | 754 | 176.1 |
| C | 0 | 10 | 57047 | 319.68 | 749 | 754 | 176.1 |
| D | 8 | 195 | 4941766 | 25753.05 | 728 | 715 | 191.9 |
| D | 12 | 227 | 389538 | 2026.57 | 728 | 715 | 191.9 |
| D | 13 | 249 | 70066 | 361.46 | 728 | 715 | 191.9 |
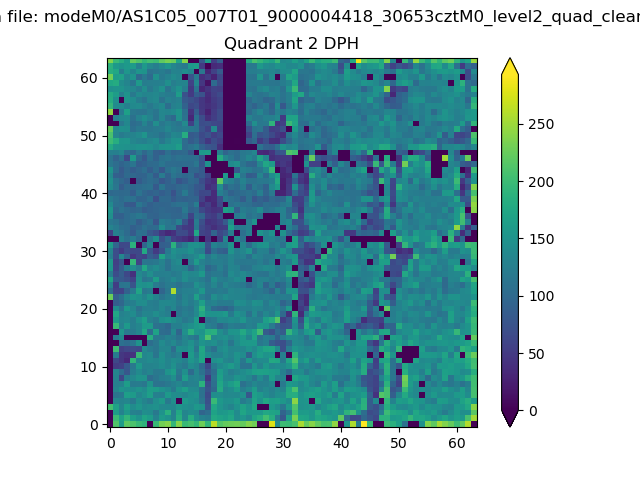
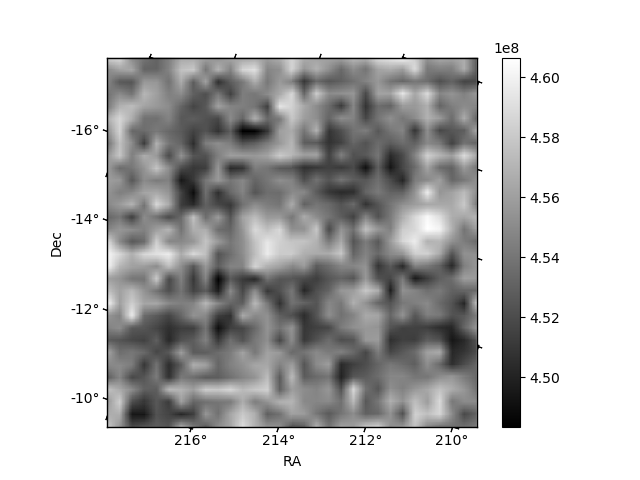
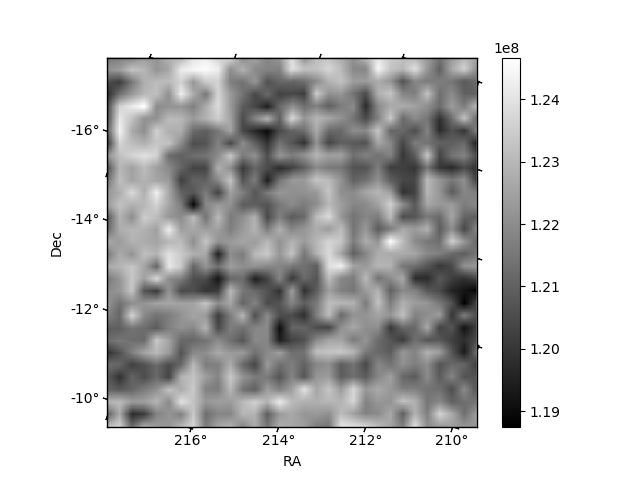
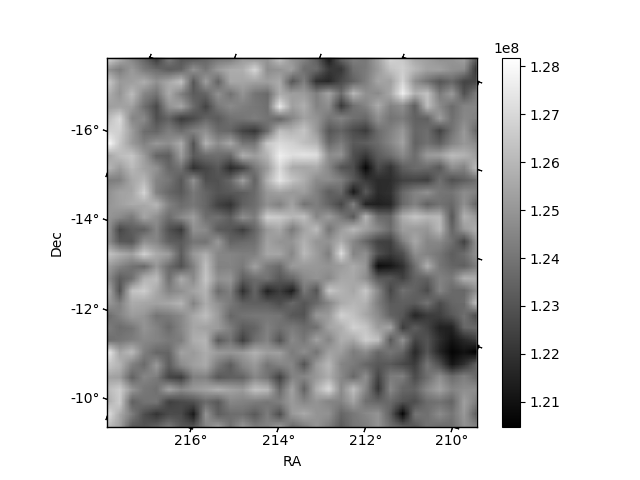
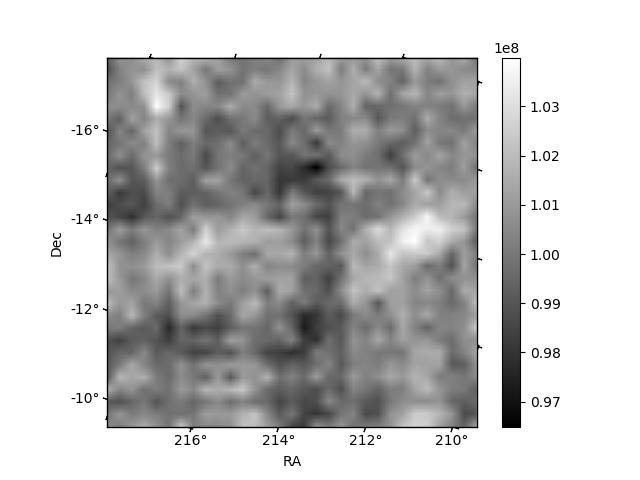
Histogram calculated using DETX and DETY for each event in the final _common_clean file
| Quadrant A | 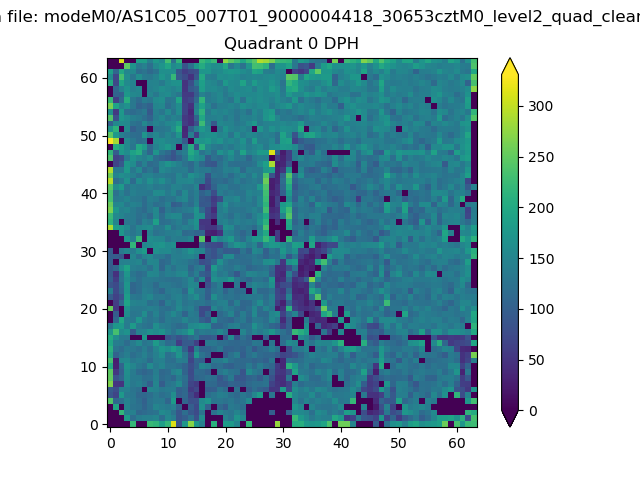 |
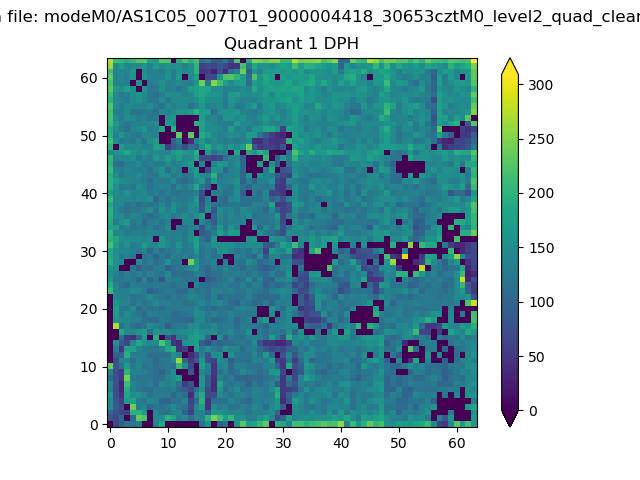 |
Quadrant B |
|---|---|---|---|
| Quadrant D | 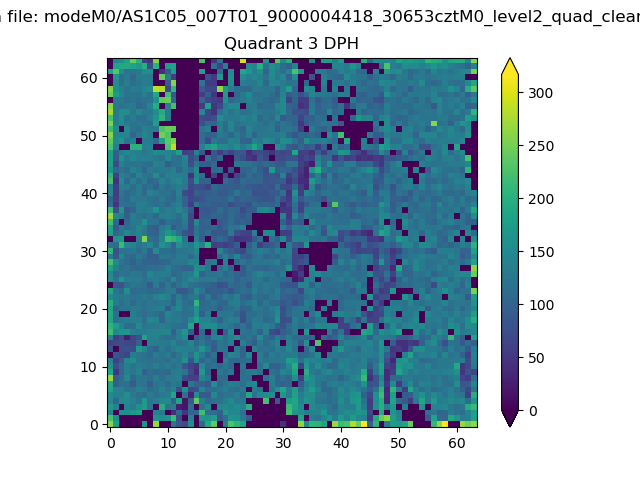 |
 |
Quadrant C |
| Plot type | Count rate plots | Images |
|---|---|---|
| Comparison with Poisson distribution Blue bars denote a histogram of data divided into 1 sec bins. Red curve is a Poisson curve with rate = median count rate of data. |
 |
 |
| Quadrant-wise count rates Data is divided into 100 sec bins |
 |
|
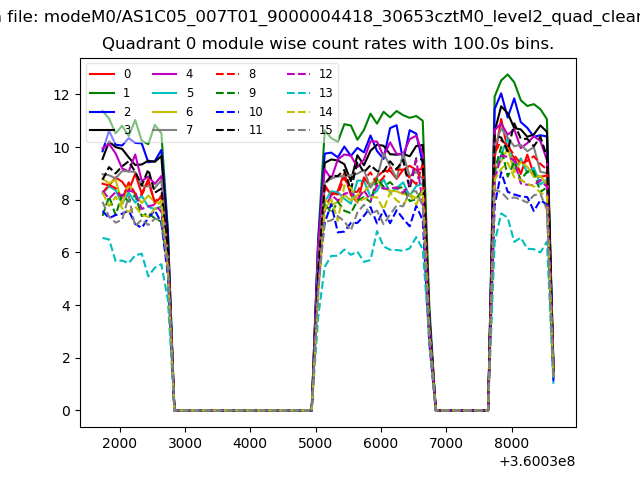
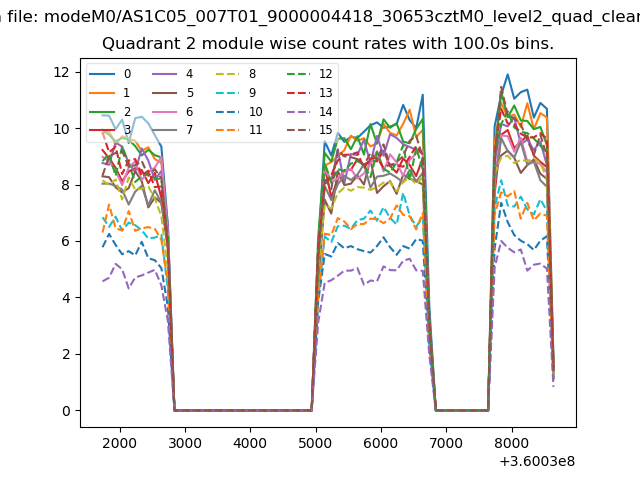
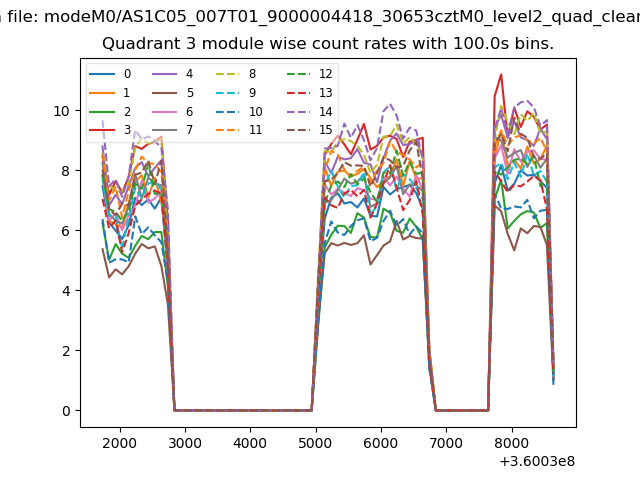
| Module-wise count rates for Quadrant A Data is divided into 100 sec bins |
 |
 |
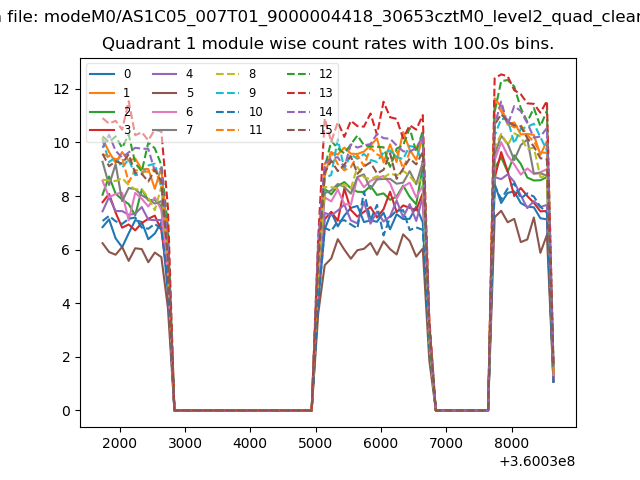
| Module-wise count rates for Quadrant B Data is divided into 100 sec bins |
 |
 |
| Module-wise count rates for Quadrant C Data is divided into 100 sec bins |
 |
 |
| Module-wise count rates for Quadrant D Data is divided into 100 sec bins |
 |
 |
| Parameter | Plot |
|---|---|
| CZT HV Monitor | 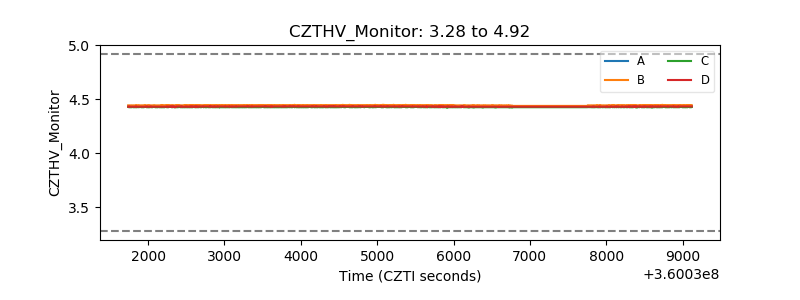 |
| D_VDD | 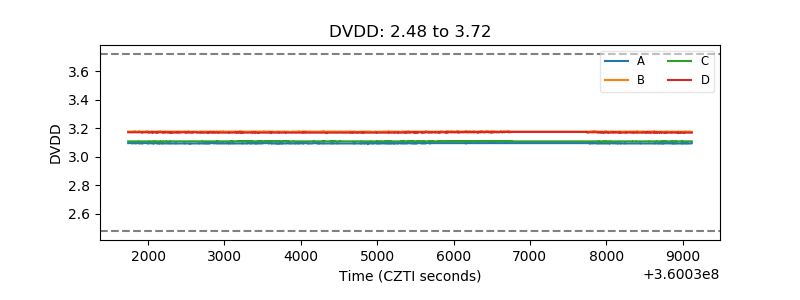 |
| Temperature 1 | 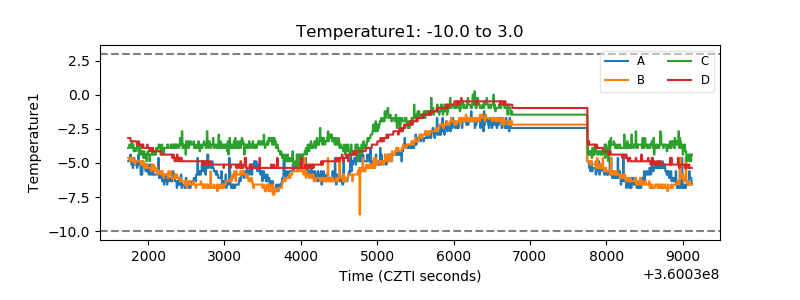 |
| Veto HV Monitor | 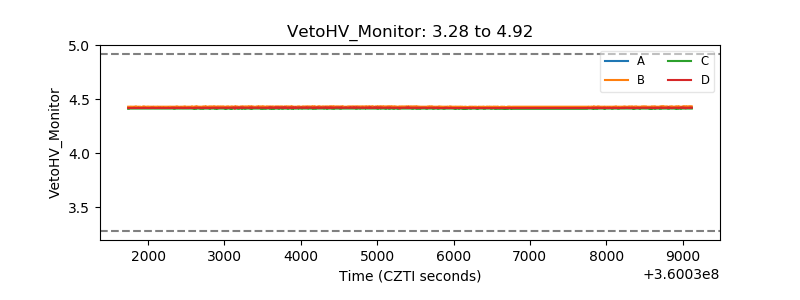 |
| Veto LLD | 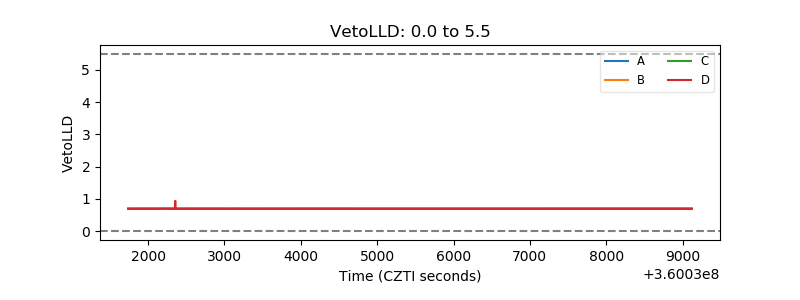 |
| Alpha Counter | 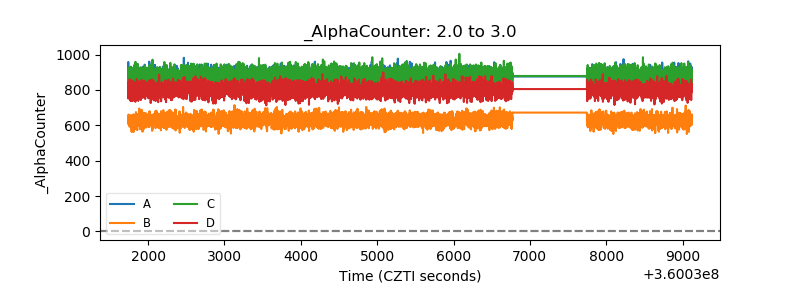 |
| _CPM_Rate |  |
| CZT Counter | 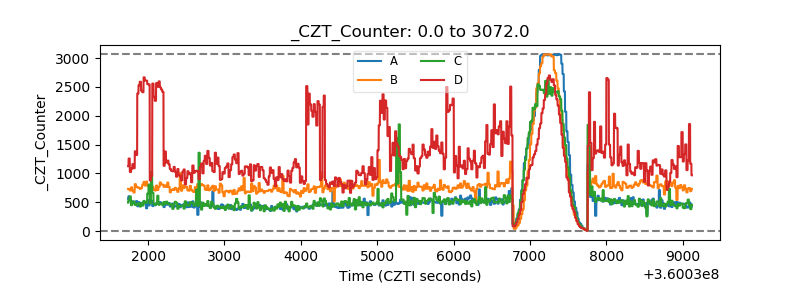 |
| +2.5 Volts monitor |  |
| +5 Volts monitor |  |
| _ROLL_ROT | 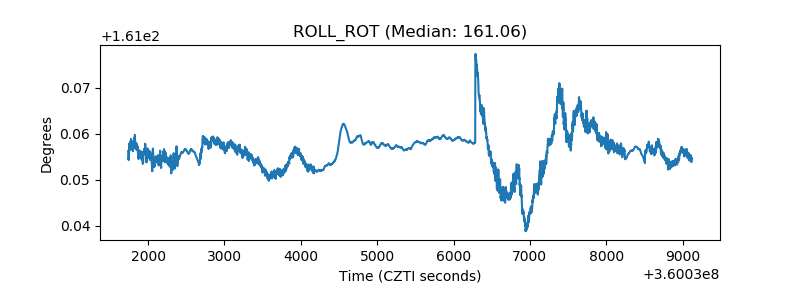 |
| _Roll_DEC | 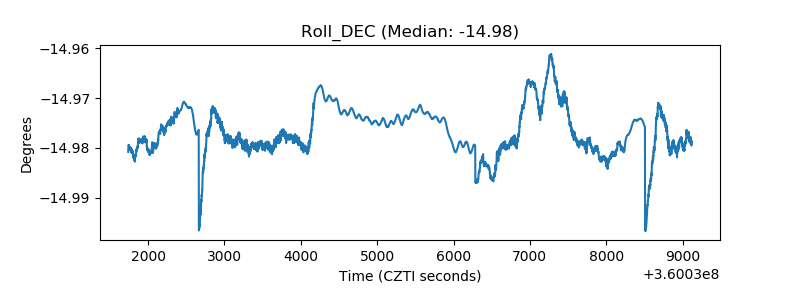 |
| _Roll_RA | 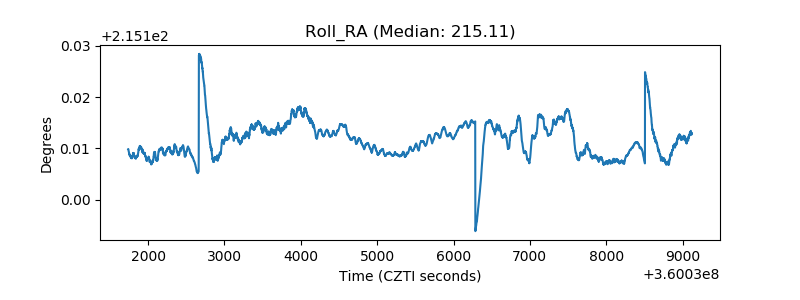 |
| Veto Counter | 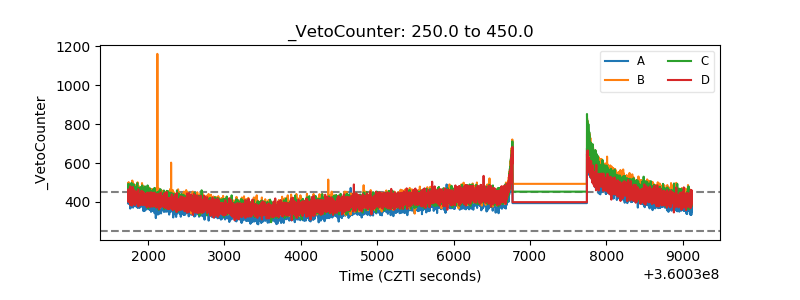 |