| Param | Original file | Final file |
|---|---|---|
| Filename | modeM0/AS1C05_007T01_9000004418_30655cztM0_level2.evt | modeM0/AS1C05_007T01_9000004418_30655cztM0_level2_quad_clean.evt |
| Size (bytes) | 690,575,040 | 77,722,560 |
| Size | 658.6 MB | 74.1 MB |
| Events in quadrant A | 3,235,139 | 501,329 |
| Events in quadrant B | 5,067,101 | 501,579 |
| Events in quadrant C | 3,377,445 | 469,971 |
| Events in quadrant D | 8,801,946 | 432,594 |
| Mode M0 | |||
|---|---|---|---|
| Quadrant | BADHDUFLAG | Total packets | Discarded packets |
| A | 0 | 13441 | 1 |
| B | 0 | 19470 | 2 |
| C | 0 | 13799 | 1 |
| D | 0 | 30700 | 1 |
| Mode SS | |||
|---|---|---|---|
| Quadrant | BADHDUFLAG | Total packets | Discarded packets |
| A | 0 | 130 | 0 |
| B | 0 | 130 | 0 |
| C | 0 | 130 | 0 |
| D | 0 | 130 | 0 |
| Mode M9 | |||
|---|---|---|---|
| Quadrant | BADHDUFLAG | Total packets | Discarded packets |
| A | 0 | 13 | 0 |
| B | 0 | 14 | 0 |
| C | 0 | 14 | 0 |
| D | 0 | 14 | 0 |
| Quadrant | Total seconds | Saturated seconds | Saturation percentage |
|---|---|---|---|
| A | 6419 | 28 | 0.436205% |
| B | 6418 | 54 | 0.841384% |
| C | 6418 | 98 | 1.526955% |
| D | 6418 | 925 | 14.412590% |
Noise dominated data is calculated using 1-second bins in cleaned event files. If a bin has >2000 counts, and if more than 50% of those come from <1% of pixels, then it is considered to be noise-dominated and hence unusable.
| Quadrant | # 1 sec bins | Bins with >0 counts | Bins with >2000 counts | High rate bins dominated by noise | Noise dominated (total time) | Noise dominated (detector-on time) | Marked lightcurve |
|---|---|---|---|---|---|---|---|
| A | 7549 | 6420 | 0 | 0 | 0.00% | 0.00% | 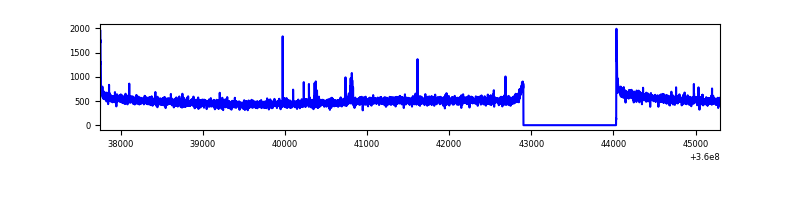 |
| B | 7548 | 6419 | 2 | 2 | 0.03% | 0.03% | 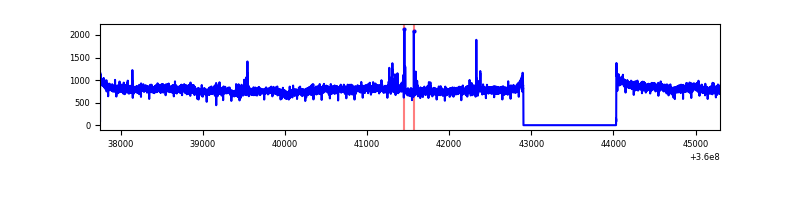 |
| C | 7548 | 6419 | 13 | 13 | 0.17% | 0.20% | 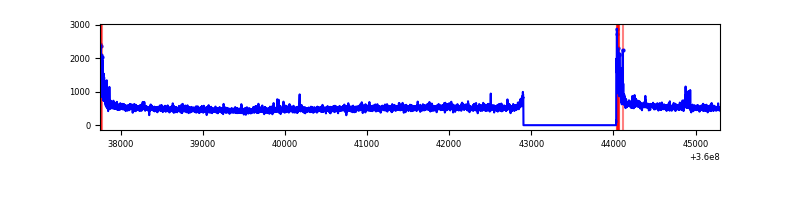 |
| D | 7548 | 6419 | 1196 | 1196 | 15.85% | 18.63% | 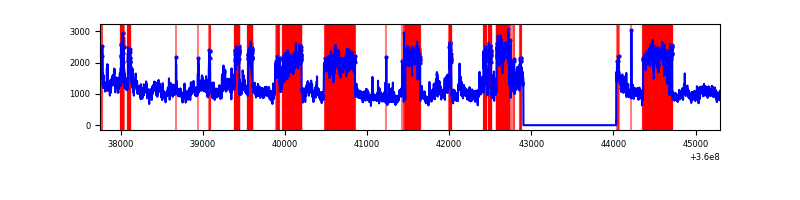 |
Top three noisy pixels from each quadrant. If the there are fewer than three noisy pixels in the level2.evt file, extra rows are filled as -1
| Pixel properties | Quadrant properties | ||||||
|---|---|---|---|---|---|---|---|
| Quadrant | DetID | PixID | Counts | Sigma | Mean | Median | Sigma |
| A | 0 | 13 | 19127 | 110.28 | 829 | 814 | 166.1 |
| A | 8 | 192 | 16282 | 93.15 | 829 | 814 | 166.1 |
| A | 13 | 254 | 12345 | 69.44 | 829 | 814 | 166.1 |
| B | 6 | 159 | 1798021 | 11548.45 | 820 | 800 | 155.6 |
| B | 12 | 111 | 19300 | 118.88 | 820 | 800 | 155.6 |
| B | 11 | 111 | 17649 | 108.27 | 820 | 800 | 155.6 |
| C | 14 | 238 | 128045 | 701.46 | 781 | 787 | 181.4 |
| C | 0 | 10 | 100507 | 549.67 | 781 | 787 | 181.4 |
| C | 3 | 233 | 91485 | 499.94 | 781 | 787 | 181.4 |
| D | 8 | 195 | 4889067 | 24759.9 | 754 | 741 | 197.4 |
| D | 12 | 227 | 772924 | 3911.19 | 754 | 741 | 197.4 |
| D | 13 | 249 | 115242 | 579.96 | 754 | 741 | 197.4 |
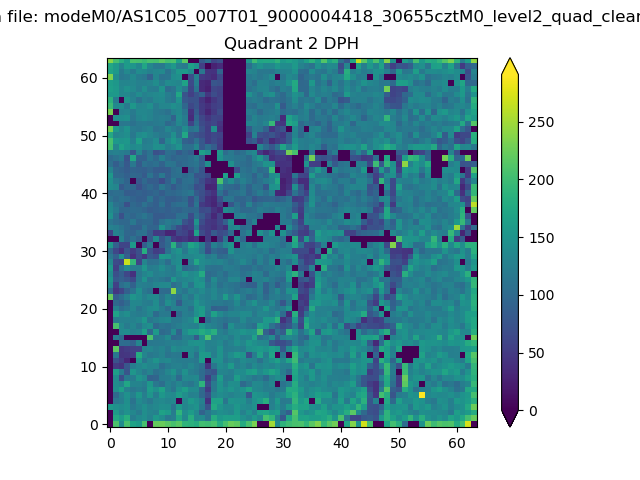
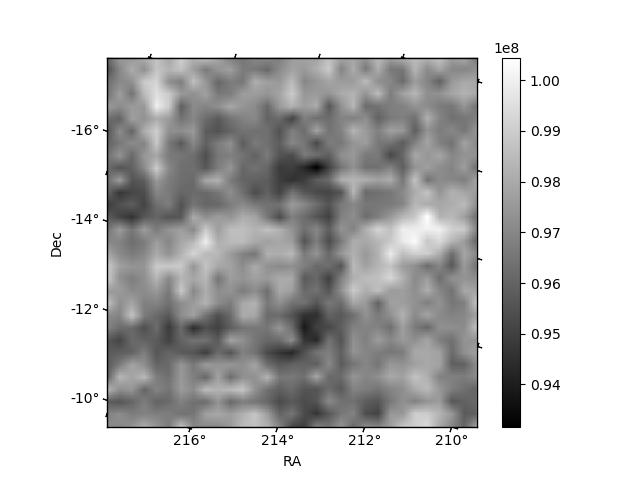
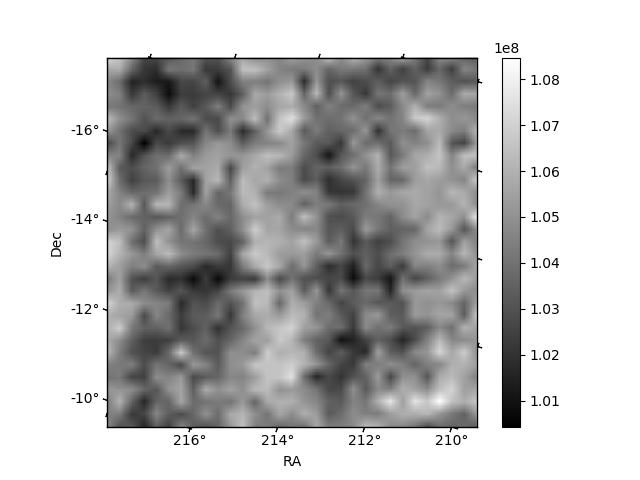
Histogram calculated using DETX and DETY for each event in the final _common_clean file
| Quadrant A | 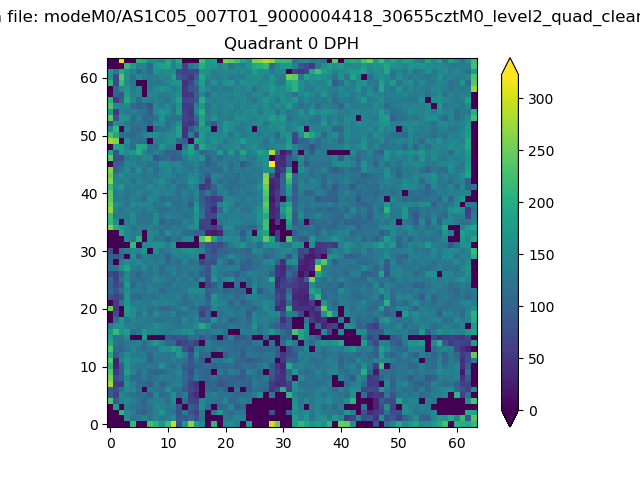 |
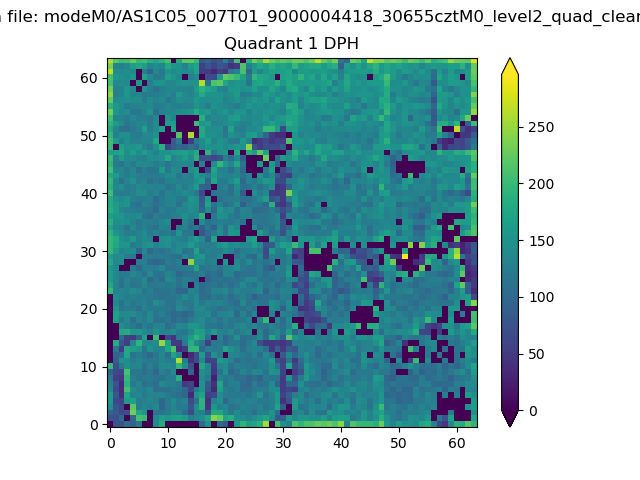 |
Quadrant B |
|---|---|---|---|
| Quadrant D | 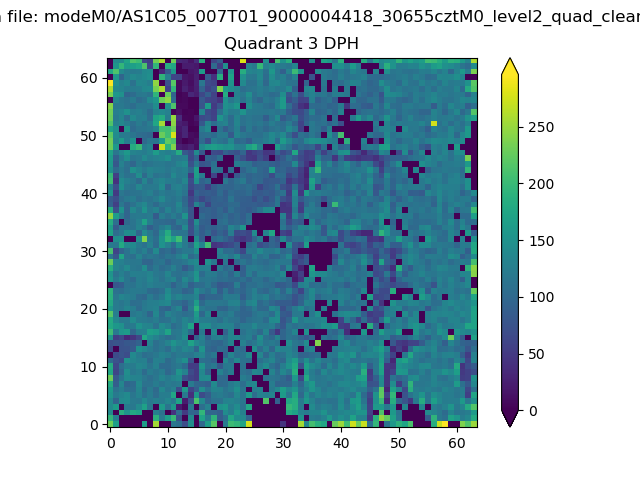 |
 |
Quadrant C |
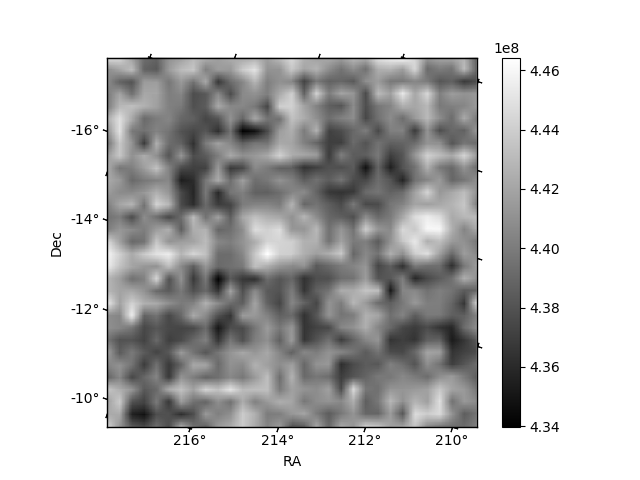
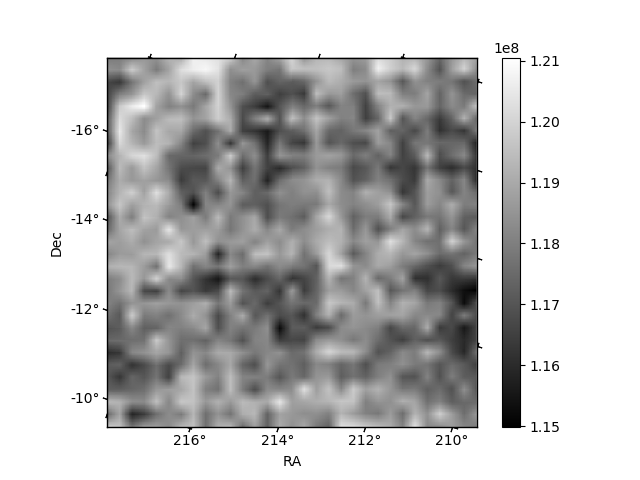
| Plot type | Count rate plots | Images |
|---|---|---|
| Comparison with Poisson distribution Blue bars denote a histogram of data divided into 1 sec bins. Red curve is a Poisson curve with rate = median count rate of data. |
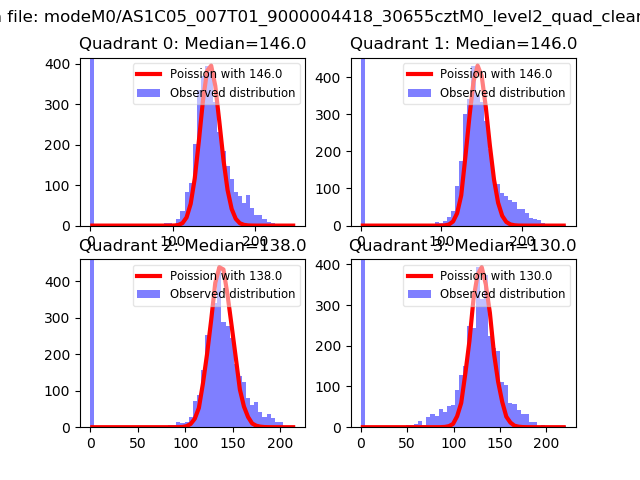 |
 |
| Quadrant-wise count rates Data is divided into 100 sec bins |
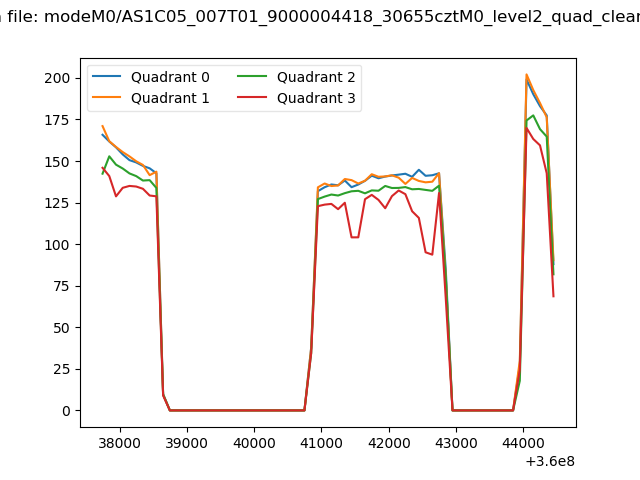 |
|
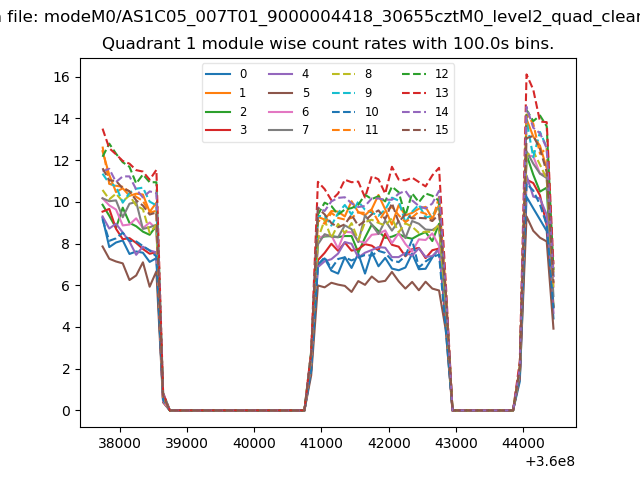
| Module-wise count rates for Quadrant A Data is divided into 100 sec bins |
 |
 |
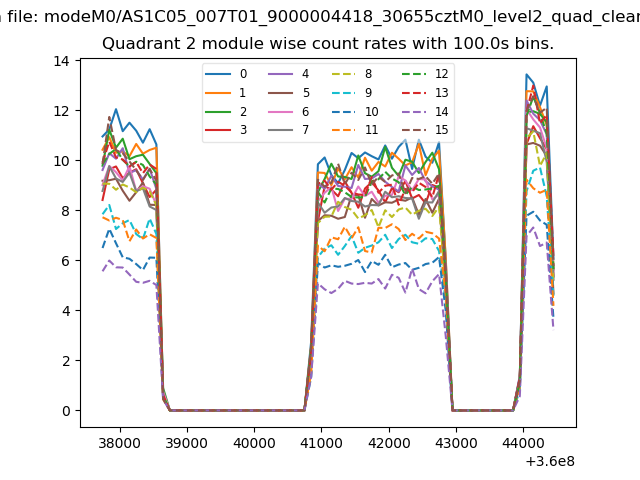
| Module-wise count rates for Quadrant B Data is divided into 100 sec bins |
 |
 |
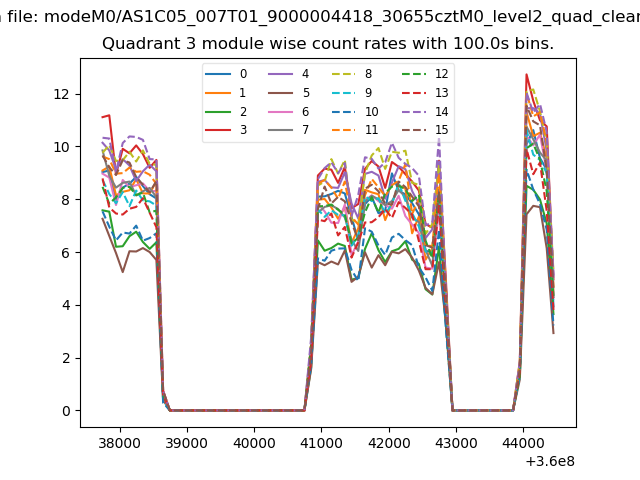
| Module-wise count rates for Quadrant C Data is divided into 100 sec bins |
 |
 |
| Module-wise count rates for Quadrant D Data is divided into 100 sec bins |
 |
 |
| Parameter | Plot |
|---|---|
| CZT HV Monitor |  |
| D_VDD |  |
| Temperature 1 | 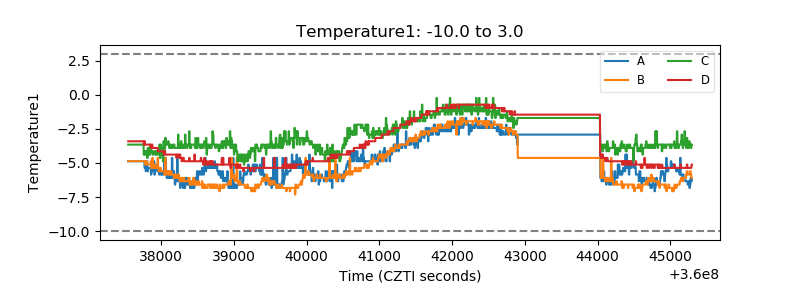 |
| Veto HV Monitor | 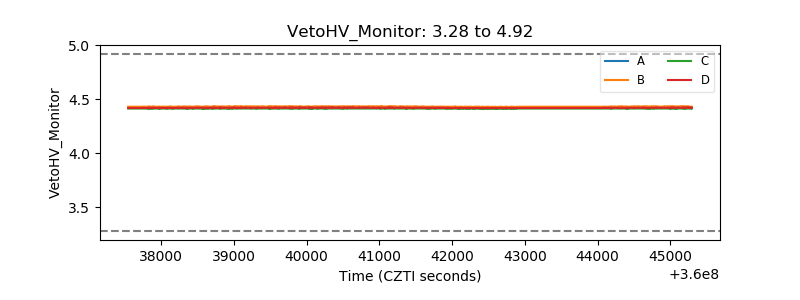 |
| Veto LLD | 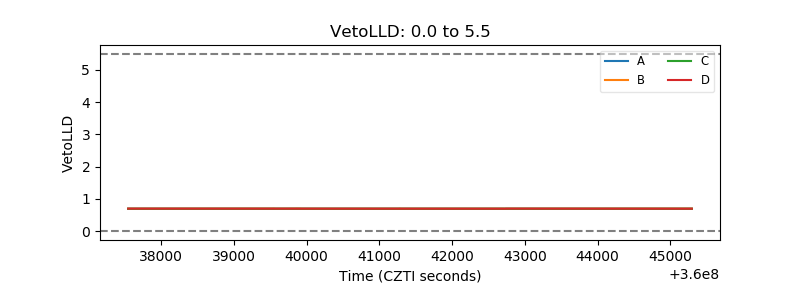 |
| Alpha Counter | 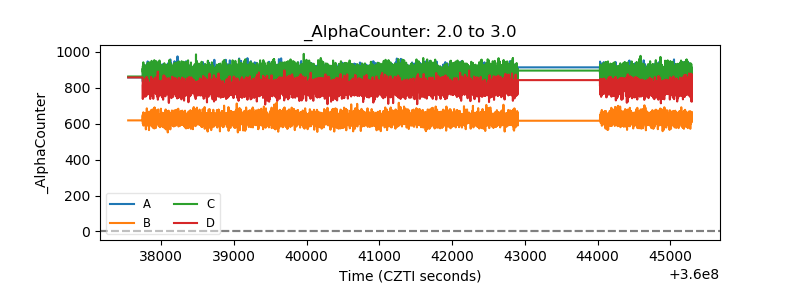 |
| _CPM_Rate | 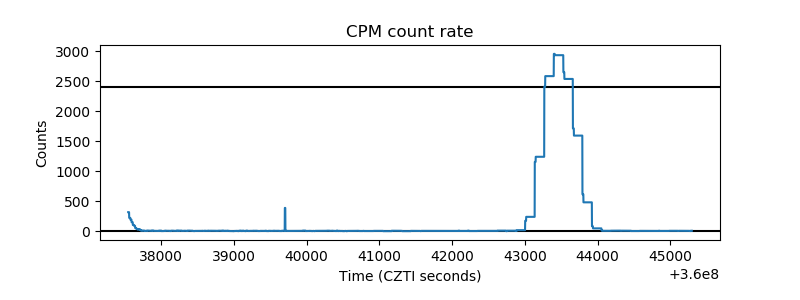 |
| CZT Counter | 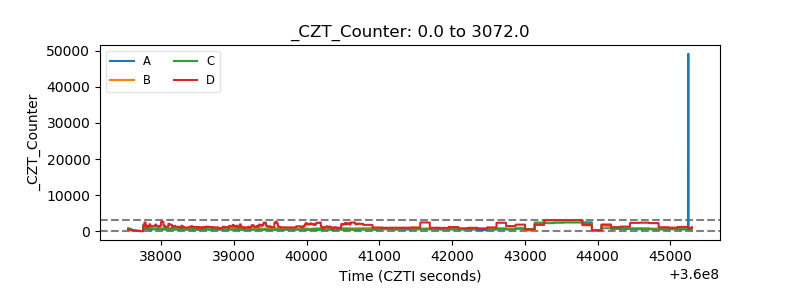 |
| +2.5 Volts monitor |  |
| +5 Volts monitor |  |
| _ROLL_ROT |  |
| _Roll_DEC | 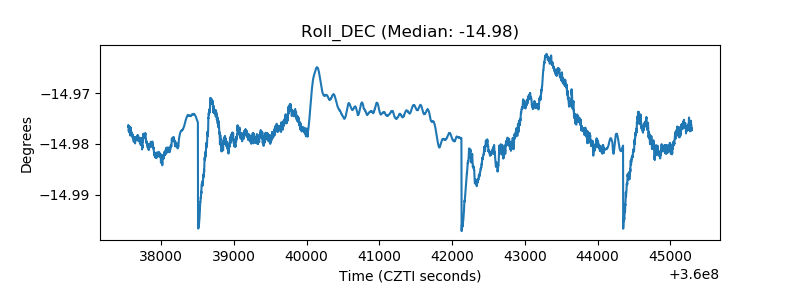 |
| _Roll_RA | 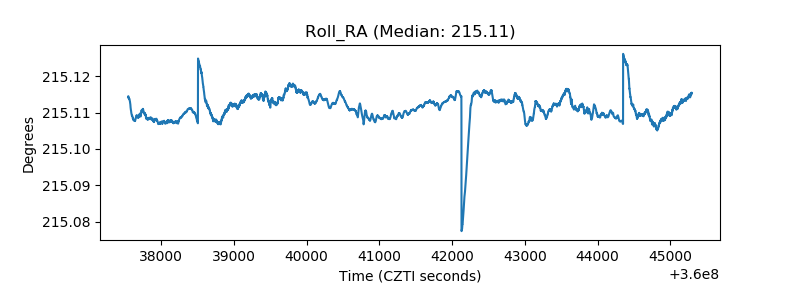 |
| Veto Counter |  |