| Param | Original file | Final file |
|---|---|---|
| Filename | modeM0/AS1C05_007T01_9000004418_30658cztM0_level2.evt | modeM0/AS1C05_007T01_9000004418_30658cztM0_level2_quad_clean.evt |
| Size (bytes) | 702,365,760 | 72,924,480 |
| Size | 669.8 MB | 69.5 MB |
| Events in quadrant A | 3,939,167 | 465,429 |
| Events in quadrant B | 5,216,553 | 465,078 |
| Events in quadrant C | 4,056,702 | 437,720 |
| Events in quadrant D | 7,644,398 | 410,085 |
| Mode M0 | |||
|---|---|---|---|
| Quadrant | BADHDUFLAG | Total packets | Discarded packets |
| A | 0 | 15558 | 2 |
| B | 0 | 19546 | 2 |
| C | 0 | 16482 | 2 |
| D | 0 | 27085 | 4 |
| Mode SS | |||
|---|---|---|---|
| Quadrant | BADHDUFLAG | Total packets | Discarded packets |
| A | 0 | 124 | 0 |
| B | 0 | 124 | 0 |
| C | 0 | 124 | 0 |
| D | 0 | 124 | 0 |
| Mode M9 | |||
|---|---|---|---|
| Quadrant | BADHDUFLAG | Total packets | Discarded packets |
| A | 0 | 20 | 0 |
| B | 0 | 21 | 0 |
| C | 0 | 21 | 0 |
| D | 0 | 21 | 0 |
| Quadrant | Total seconds | Saturated seconds | Saturation percentage |
|---|---|---|---|
| A | 6157 | 184 | 2.988468% |
| B | 6157 | 166 | 2.696118% |
| C | 6157 | 218 | 3.540685% |
| D | 6156 | 597 | 9.697856% |
Noise dominated data is calculated using 1-second bins in cleaned event files. If a bin has >2000 counts, and if more than 50% of those come from <1% of pixels, then it is considered to be noise-dominated and hence unusable.
| Quadrant | # 1 sec bins | Bins with >0 counts | Bins with >2000 counts | High rate bins dominated by noise | Noise dominated (total time) | Noise dominated (detector-on time) | Marked lightcurve |
|---|---|---|---|---|---|---|---|
| A | 7502 | 6158 | 63 | 63 | 0.84% | 1.02% | 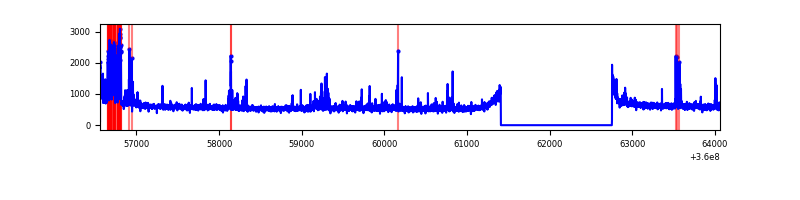 |
| B | 7502 | 6158 | 0 | 0 | 0.00% | 0.00% | 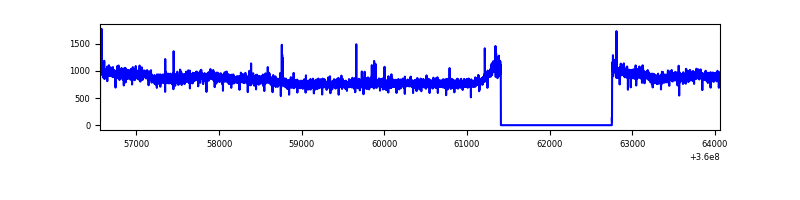 |
| C | 7502 | 6158 | 31 | 31 | 0.41% | 0.50% | 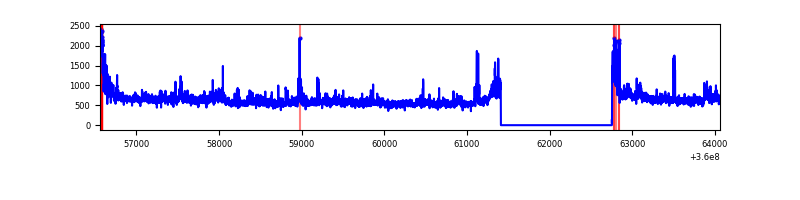 |
| D | 7501 | 6157 | 531 | 531 | 7.08% | 8.62% | 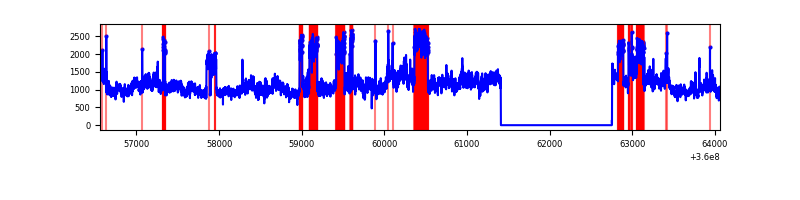 |
Top three noisy pixels from each quadrant. If the there are fewer than three noisy pixels in the level2.evt file, extra rows are filled as -1
| Pixel properties | Quadrant properties | ||||||
|---|---|---|---|---|---|---|---|
| Quadrant | DetID | PixID | Counts | Sigma | Mean | Median | Sigma |
| A | 0 | 13 | 391761 | 2168.32 | 916 | 903 | 180.3 |
| A | 13 | 254 | 11102 | 56.58 | 916 | 903 | 180.3 |
| A | 8 | 192 | 11011 | 56.07 | 916 | 903 | 180.3 |
| B | 6 | 159 | 1656301 | 9854.78 | 903 | 885 | 168.0 |
| B | 12 | 111 | 19640 | 111.65 | 903 | 885 | 168.0 |
| B | 11 | 111 | 17898 | 101.28 | 903 | 885 | 168.0 |
| C | 3 | 233 | 371754 | 1888.22 | 860 | 871 | 196.4 |
| C | 14 | 238 | 143122 | 724.22 | 860 | 871 | 196.4 |
| C | 0 | 10 | 121334 | 613.29 | 860 | 871 | 196.4 |
| D | 8 | 195 | 4204573 | 19632.13 | 858 | 841 | 214.1 |
| D | 12 | 227 | 82591 | 381.79 | 858 | 841 | 214.1 |
| D | 2 | 250 | 64782 | 298.62 | 858 | 841 | 214.1 |
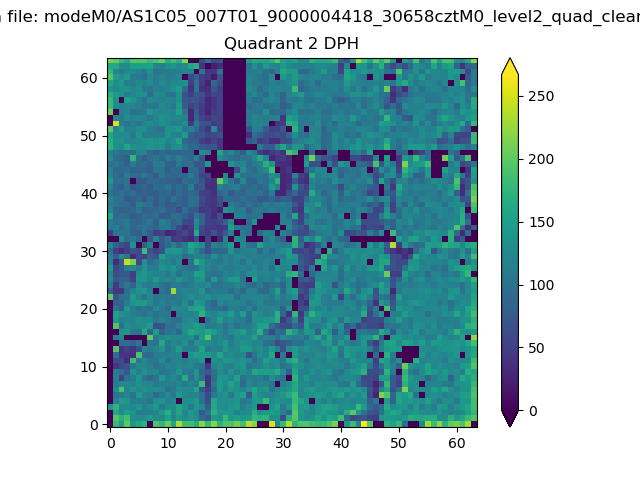
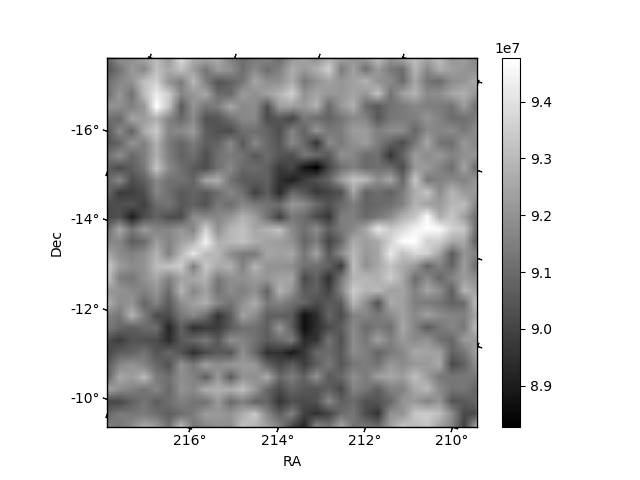
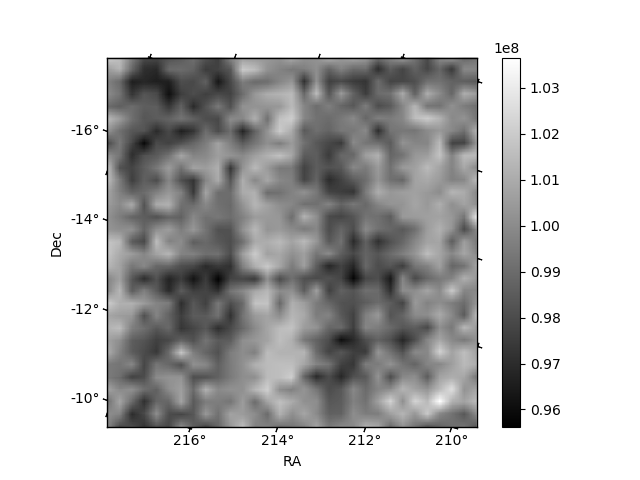
Histogram calculated using DETX and DETY for each event in the final _common_clean file
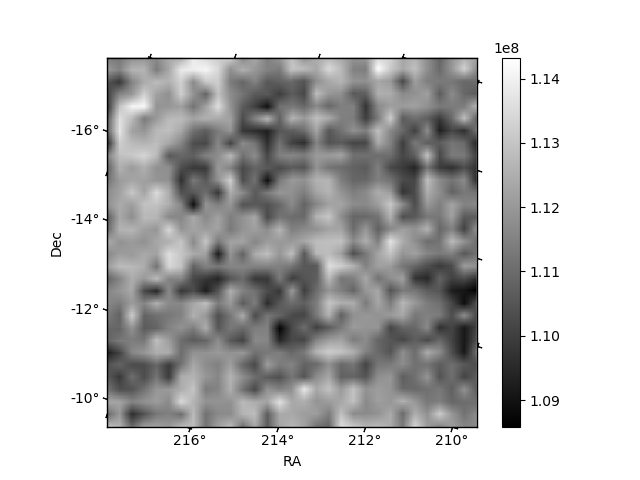
| Quadrant A |  |
 |
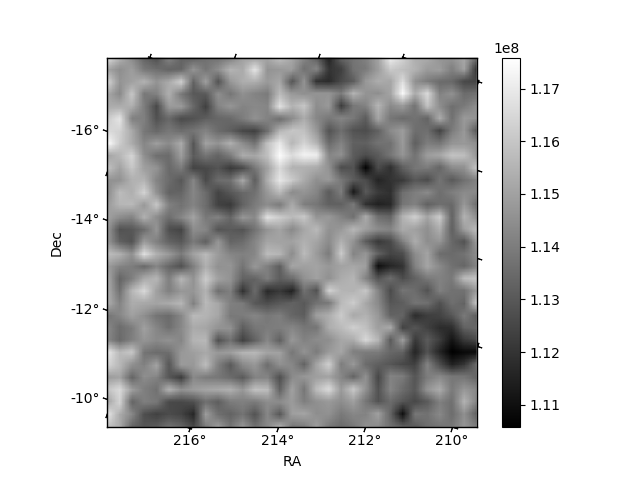
Quadrant B |
|---|---|---|---|
| Quadrant D | 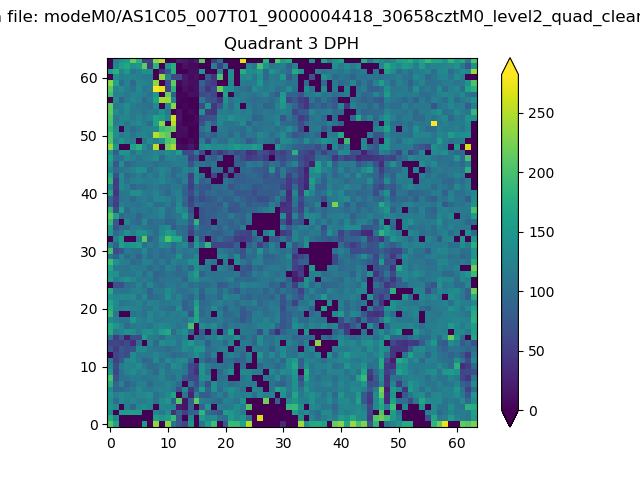 |
 |
Quadrant C |
| Plot type | Count rate plots | Images |
|---|---|---|
| Comparison with Poisson distribution Blue bars denote a histogram of data divided into 1 sec bins. Red curve is a Poisson curve with rate = median count rate of data. |
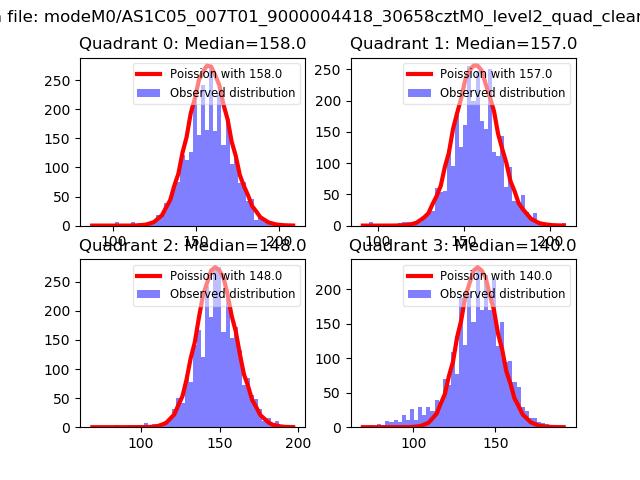 |
 |
| Quadrant-wise count rates Data is divided into 100 sec bins |
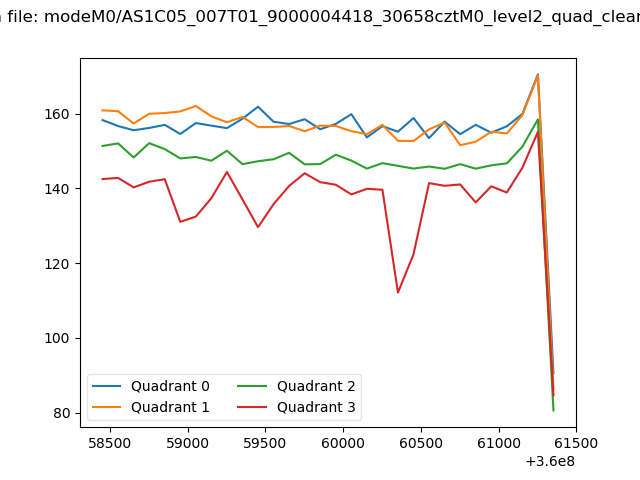 |
|
| Module-wise count rates for Quadrant A Data is divided into 100 sec bins |
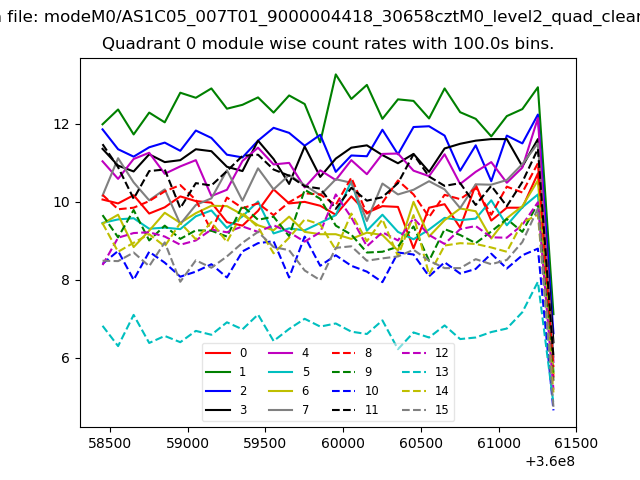 |
 |
| Module-wise count rates for Quadrant B Data is divided into 100 sec bins |
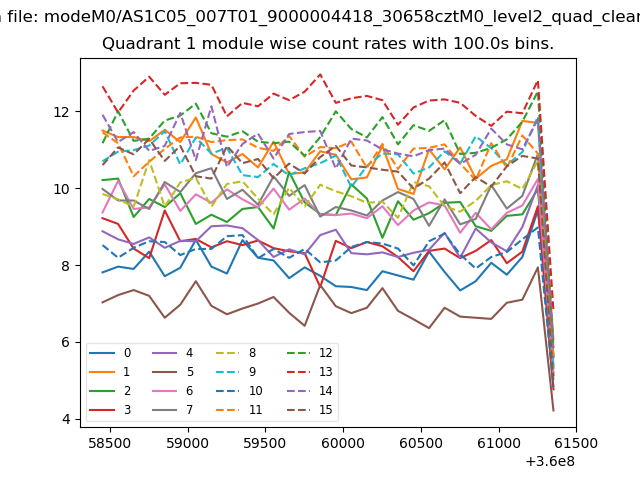 |
 |
| Module-wise count rates for Quadrant C Data is divided into 100 sec bins |
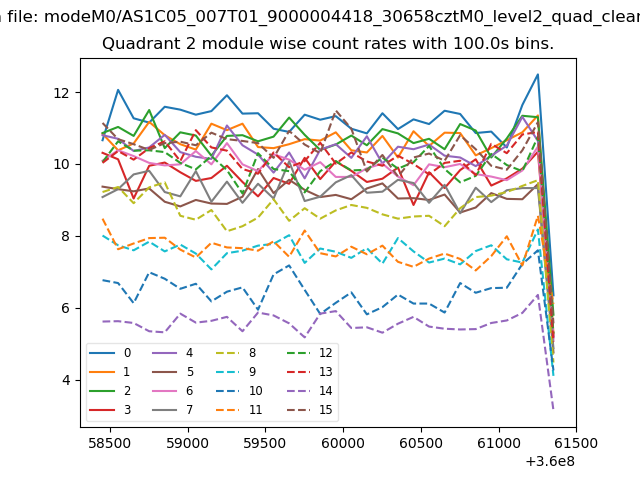 |
 |
| Module-wise count rates for Quadrant D Data is divided into 100 sec bins |
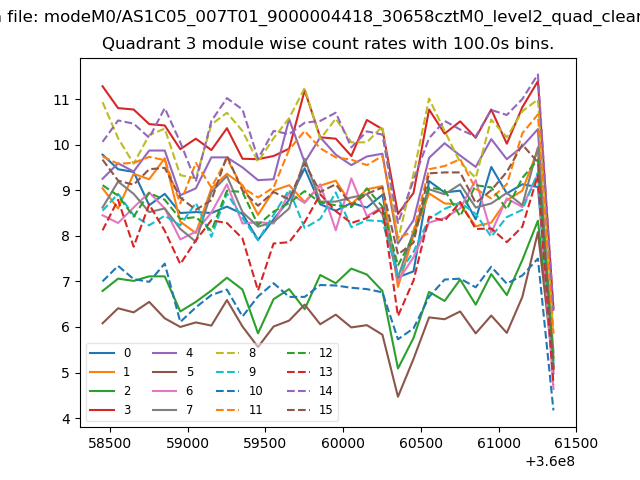 |
 |
| Parameter | Plot |
|---|---|
| CZT HV Monitor | 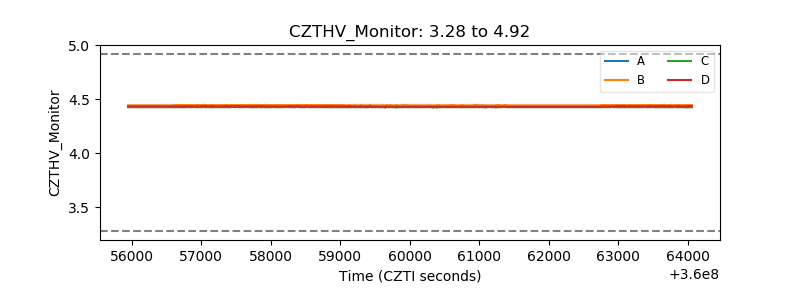 |
| D_VDD | 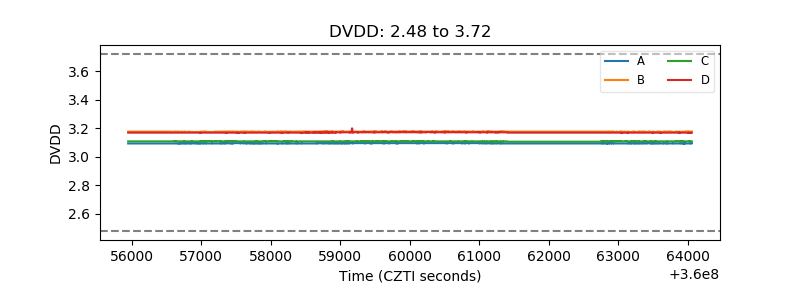 |
| Temperature 1 |  |
| Veto HV Monitor | 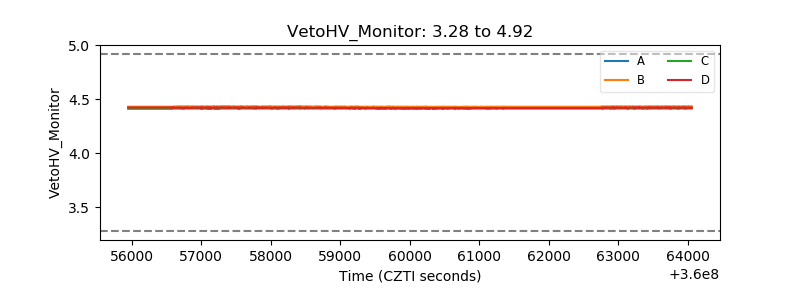 |
| Veto LLD |  |
| Alpha Counter | 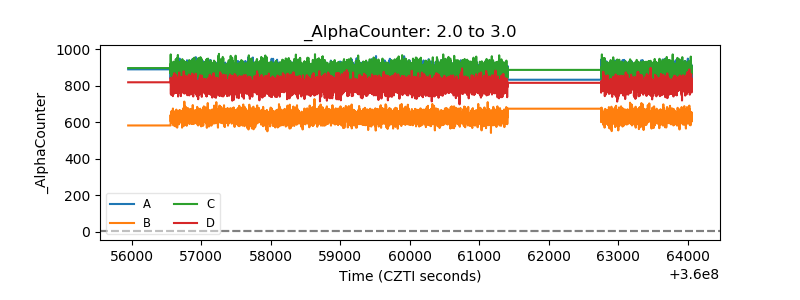 |
| _CPM_Rate | 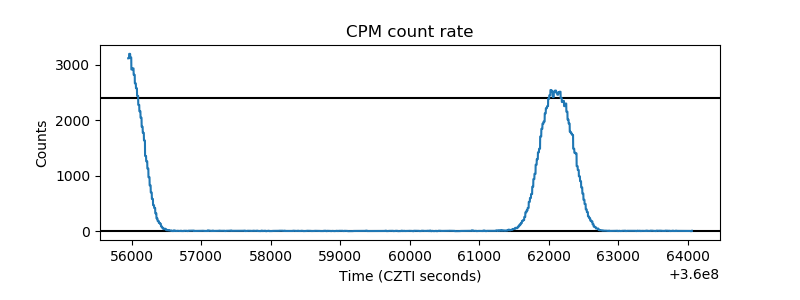 |
| CZT Counter | 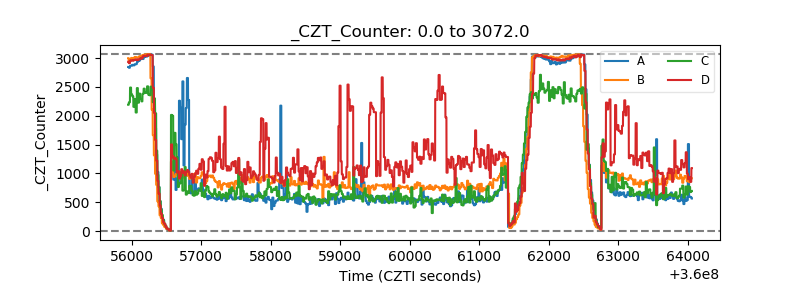 |
| +2.5 Volts monitor |  |
| +5 Volts monitor | 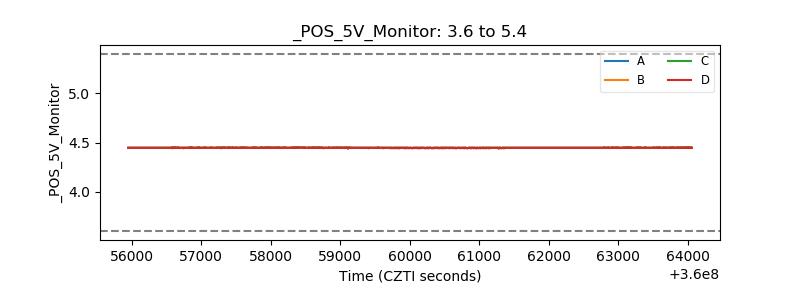 |
| _ROLL_ROT | 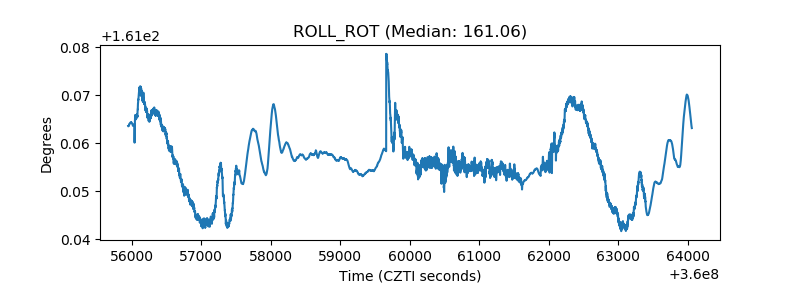 |
| _Roll_DEC | 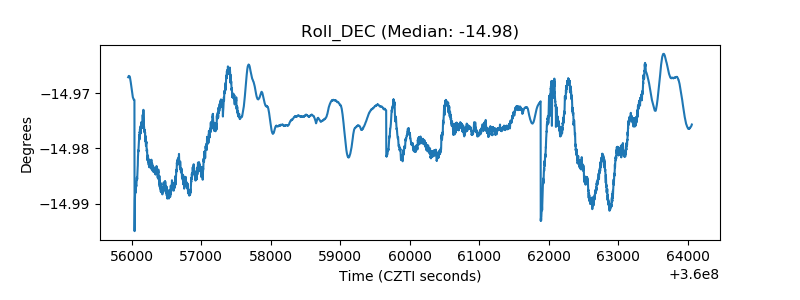 |
| _Roll_RA |  |
| Veto Counter | 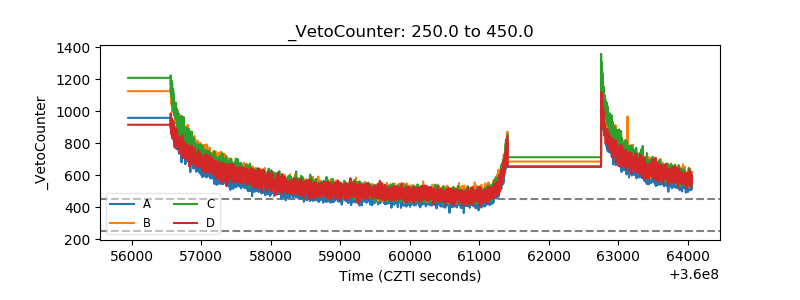 |