| Param | Original file | Final file |
|---|---|---|
| Filename | modeM0/AS1C05_007T01_9000004418_30660cztM0_level2.evt | modeM0/AS1C05_007T01_9000004418_30660cztM0_level2_quad_clean.evt |
| Size (bytes) | 1,010,675,520 | 133,053,120 |
| Size | 963.9 MB | 126.9 MB |
| Events in quadrant A | 5,009,902 | 913,395 |
| Events in quadrant B | 7,042,264 | 901,781 |
| Events in quadrant C | 6,136,160 | 849,007 |
| Events in quadrant D | 11,847,430 | 772,818 |
| Mode M0 | |||
|---|---|---|---|
| Quadrant | BADHDUFLAG | Total packets | Discarded packets |
| A | 0 | 20004 | 2 |
| B | 0 | 26528 | 2 |
| C | 0 | 24559 | 2 |
| D | 0 | 41216 | 2 |
| Mode SS | |||
|---|---|---|---|
| Quadrant | BADHDUFLAG | Total packets | Discarded packets |
| A | 0 | 172 | 0 |
| B | 0 | 172 | 0 |
| C | 0 | 172 | 0 |
| D | 0 | 172 | 0 |
| Mode M9 | |||
|---|---|---|---|
| Quadrant | BADHDUFLAG | Total packets | Discarded packets |
| A | 0 | 24 | 0 |
| B | 0 | 25 | 0 |
| C | 0 | 25 | 0 |
| D | 0 | 25 | 0 |
| Quadrant | Total seconds | Saturated seconds | Saturation percentage |
|---|---|---|---|
| A | 8531 | 146 | 1.711405% |
| B | 8531 | 237 | 2.778103% |
| C | 8531 | 280 | 3.282147% |
| D | 8531 | 1539 | 18.040089% |
Noise dominated data is calculated using 1-second bins in cleaned event files. If a bin has >2000 counts, and if more than 50% of those come from <1% of pixels, then it is considered to be noise-dominated and hence unusable.
| Quadrant | # 1 sec bins | Bins with >0 counts | Bins with >2000 counts | High rate bins dominated by noise | Noise dominated (total time) | Noise dominated (detector-on time) | Marked lightcurve |
|---|---|---|---|---|---|---|---|
| A | 9871 | 8532 | 31 | 31 | 0.31% | 0.36% | 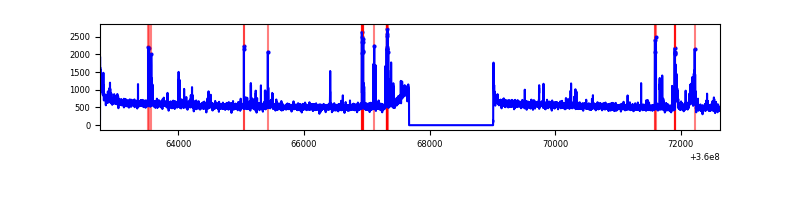 |
| B | 9871 | 8532 | 10 | 10 | 0.10% | 0.12% | 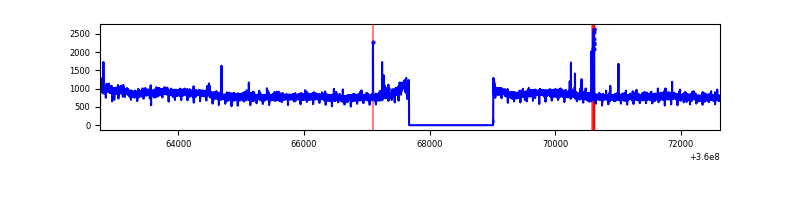 |
| C | 9871 | 8532 | 15 | 15 | 0.15% | 0.18% | 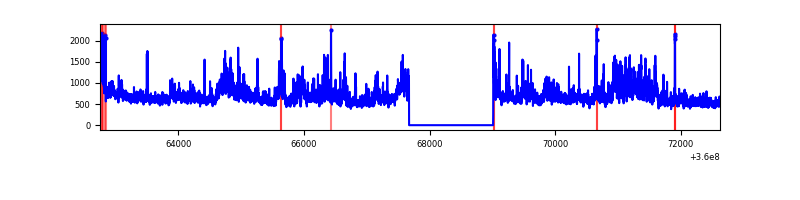 |
| D | 9871 | 8532 | 1447 | 1447 | 14.66% | 16.96% | 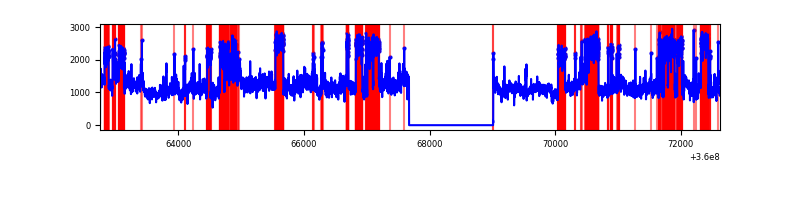 |
Top three noisy pixels from each quadrant. If the there are fewer than three noisy pixels in the level2.evt file, extra rows are filled as -1
| Pixel properties | Quadrant properties | ||||||
|---|---|---|---|---|---|---|---|
| Quadrant | DetID | PixID | Counts | Sigma | Mean | Median | Sigma |
| A | 0 | 13 | 302536 | 1260.81 | 1214 | 1196 | 239.0 |
| A | 12 | 96 | 21028 | 82.98 | 1214 | 1196 | 239.0 |
| A | 13 | 254 | 15507 | 59.88 | 1214 | 1196 | 239.0 |
| B | 6 | 159 | 2315015 | 10555.15 | 1182 | 1161 | 219.2 |
| B | 0 | 190 | 64363 | 288.31 | 1182 | 1161 | 219.2 |
| B | 12 | 111 | 25935 | 113.01 | 1182 | 1161 | 219.2 |
| C | 3 | 233 | 1387259 | 5313.21 | 1134 | 1148 | 260.9 |
| C | 14 | 238 | 186062 | 708.81 | 1134 | 1148 | 260.9 |
| C | 0 | 10 | 86488 | 327.12 | 1134 | 1148 | 260.9 |
| D | 8 | 195 | 6873368 | 24009.14 | 1110 | 1092 | 286.2 |
| D | 10 | 253 | 324402 | 1129.52 | 1110 | 1092 | 286.2 |
| D | 12 | 227 | 131388 | 455.21 | 1110 | 1092 | 286.2 |
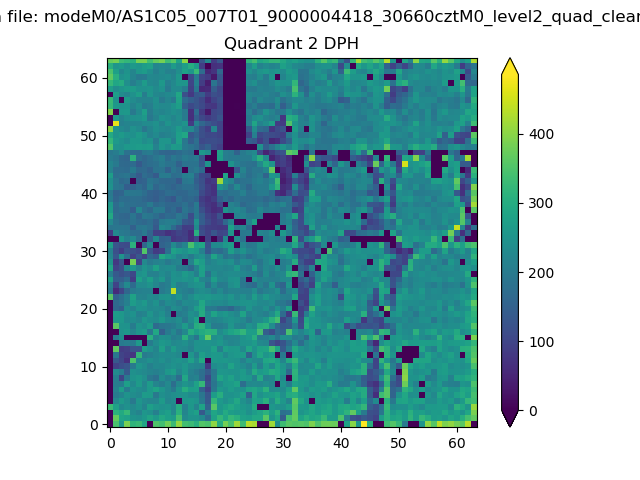
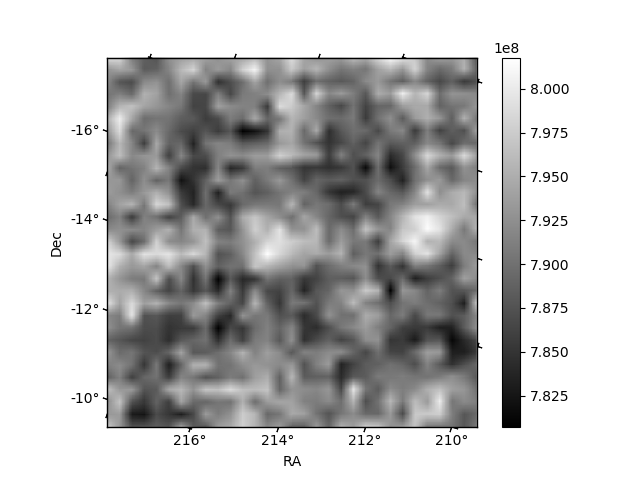
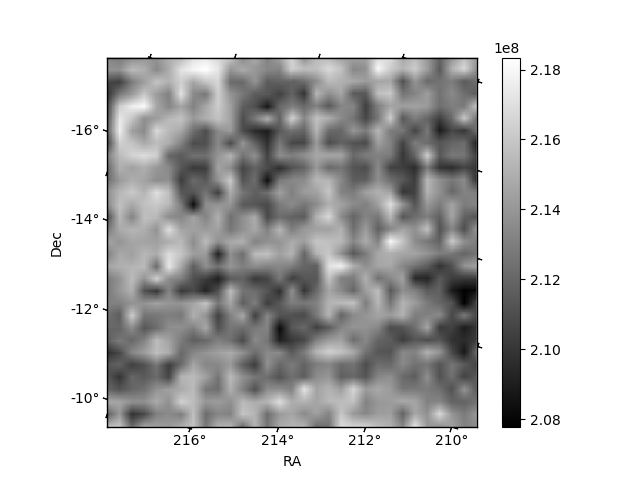
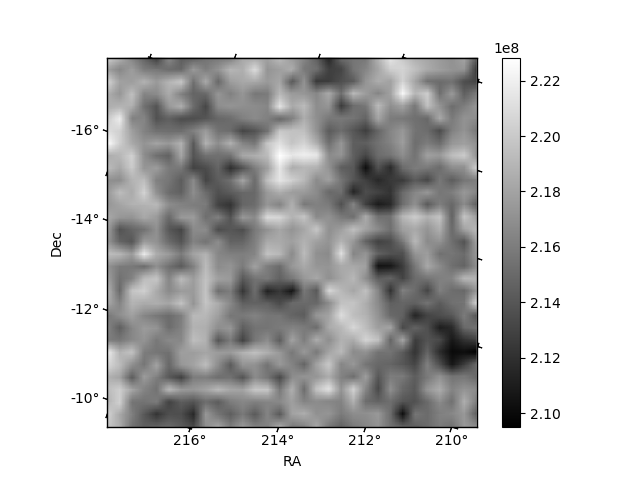
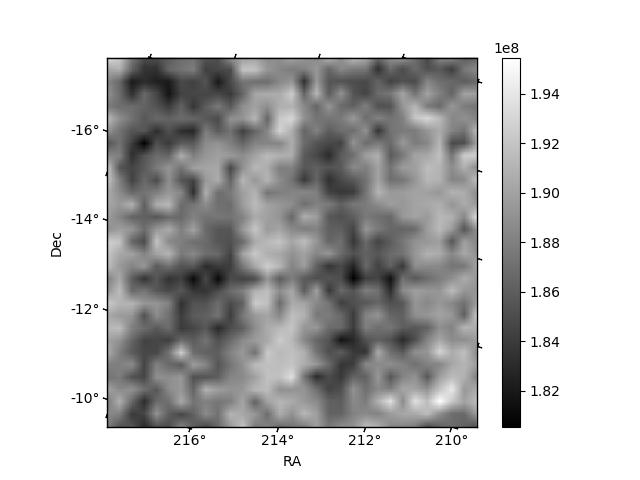
Histogram calculated using DETX and DETY for each event in the final _common_clean file
| Quadrant A | 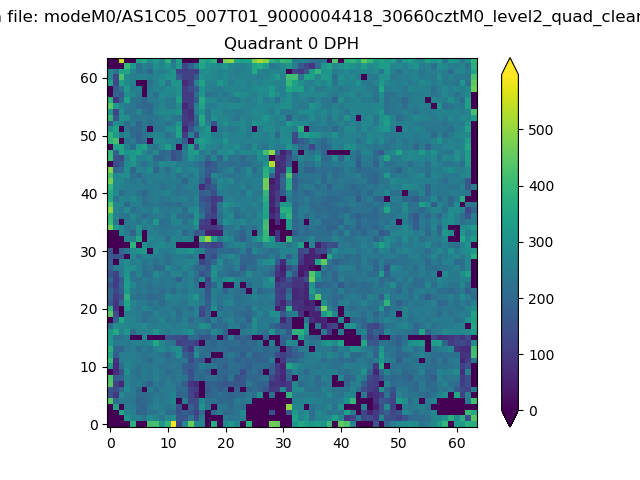 |
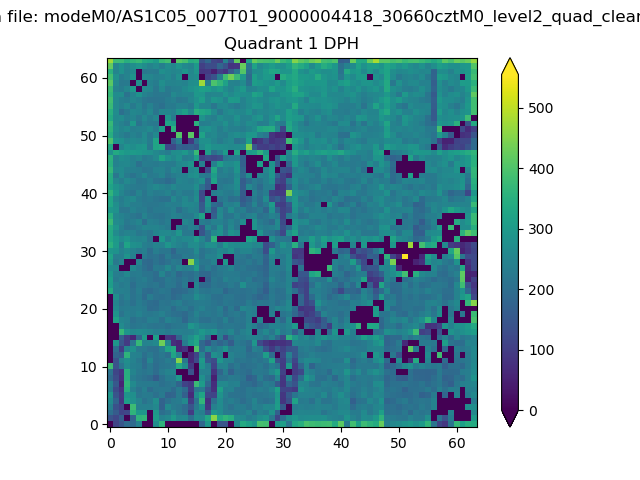 |
Quadrant B |
|---|---|---|---|
| Quadrant D | 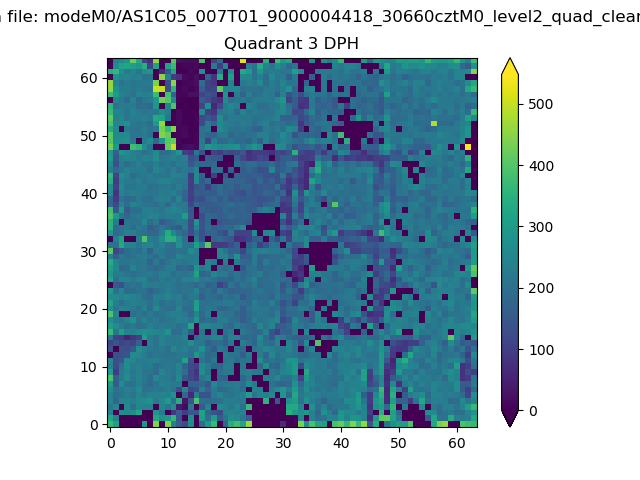 |
 |
Quadrant C |
| Plot type | Count rate plots | Images |
|---|---|---|
| Comparison with Poisson distribution Blue bars denote a histogram of data divided into 1 sec bins. Red curve is a Poisson curve with rate = median count rate of data. |
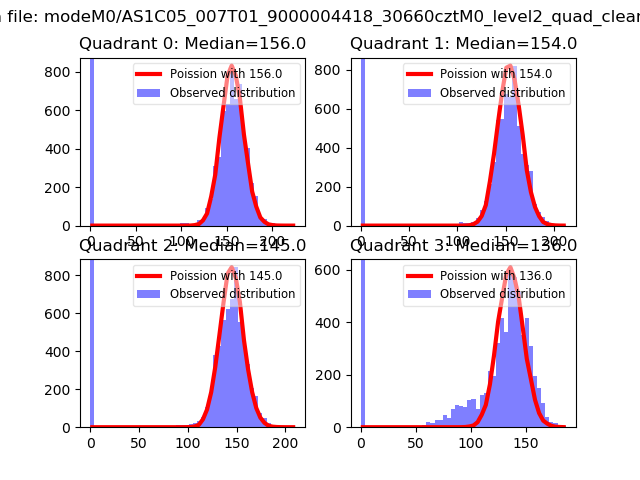 |
 |
| Quadrant-wise count rates Data is divided into 100 sec bins |
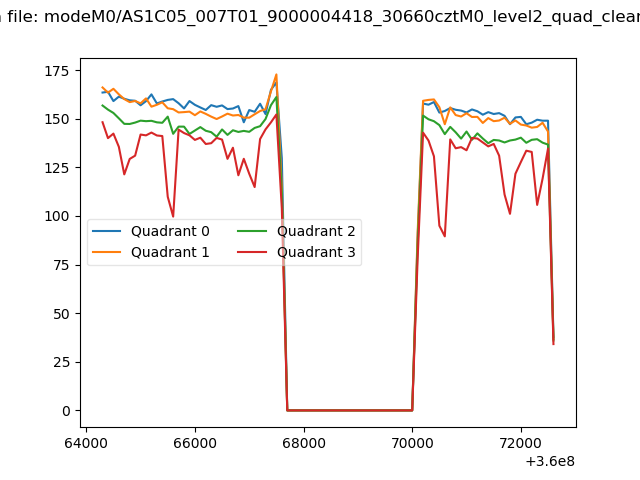 |
|
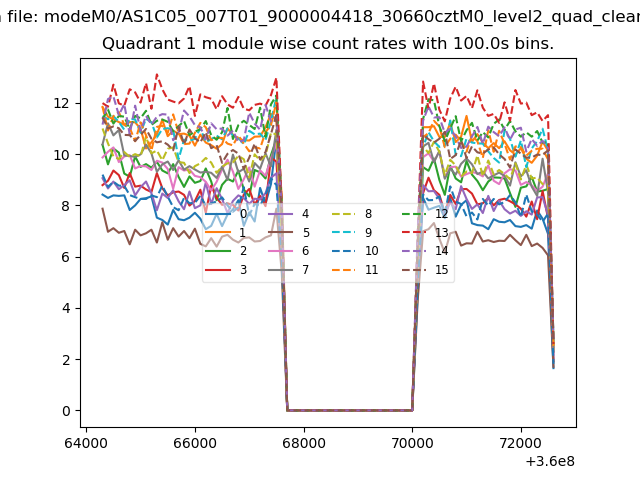
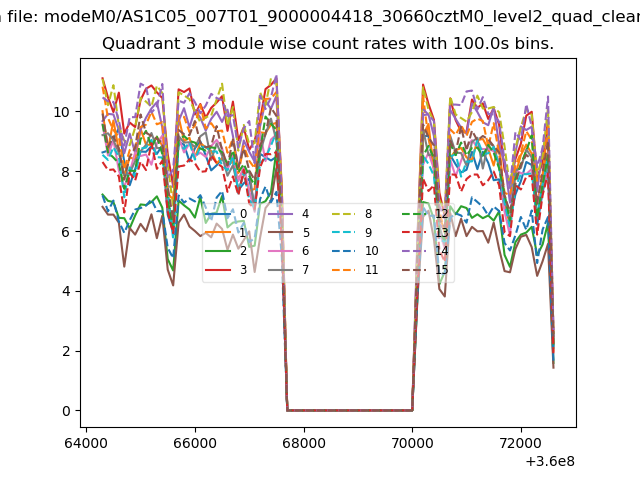
| Module-wise count rates for Quadrant A Data is divided into 100 sec bins |
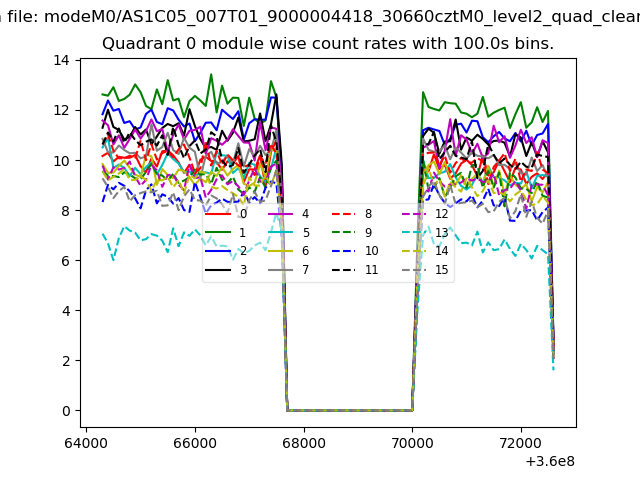 |
 |
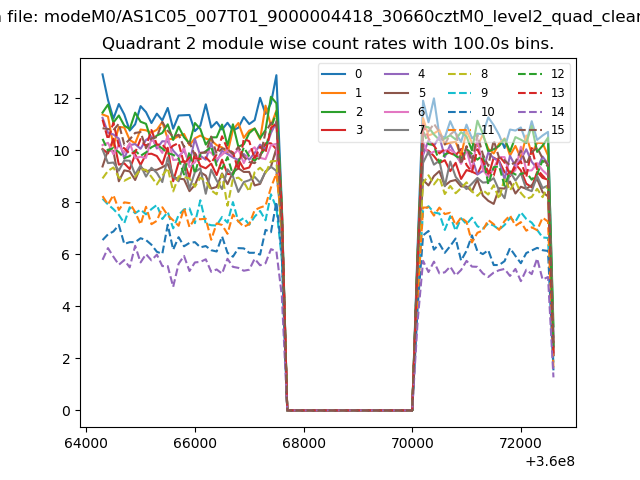
| Module-wise count rates for Quadrant B Data is divided into 100 sec bins |
 |
 |
| Module-wise count rates for Quadrant C Data is divided into 100 sec bins |
 |
 |
| Module-wise count rates for Quadrant D Data is divided into 100 sec bins |
 |
 |
| Parameter | Plot |
|---|---|
| CZT HV Monitor | 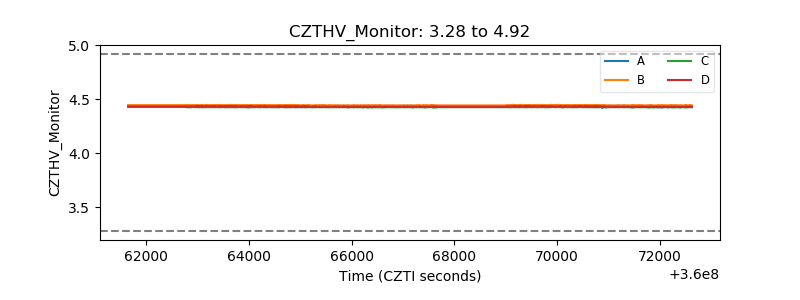 |
| D_VDD | 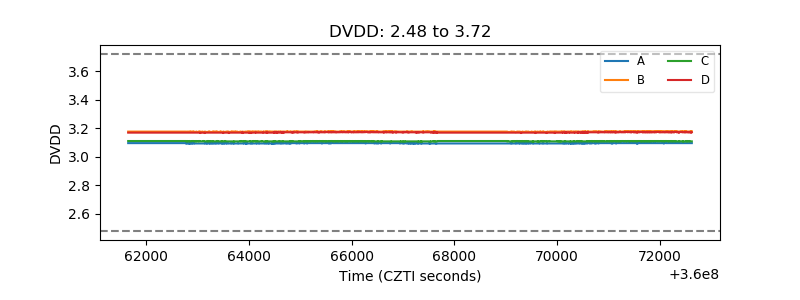 |
| Temperature 1 | 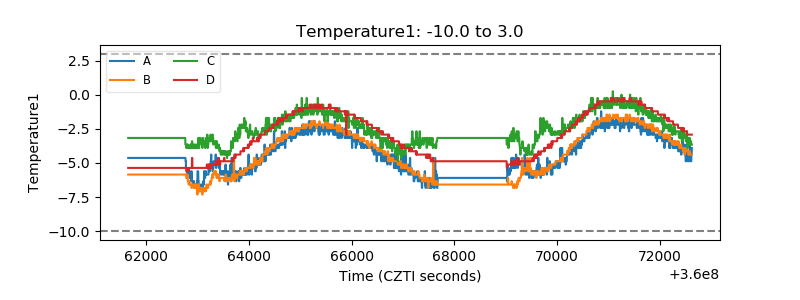 |
| Veto HV Monitor | 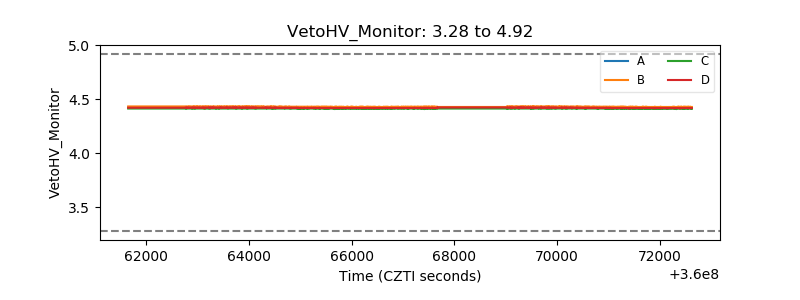 |
| Veto LLD | 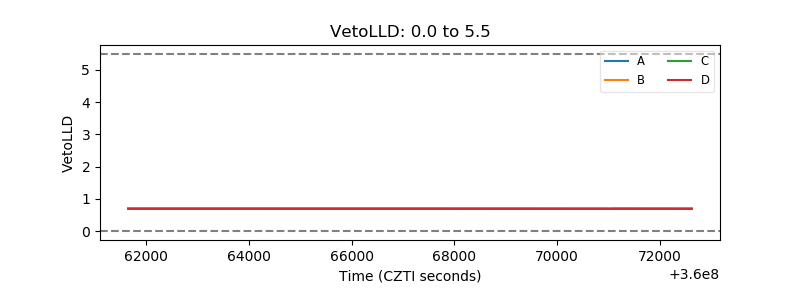 |
| Alpha Counter | 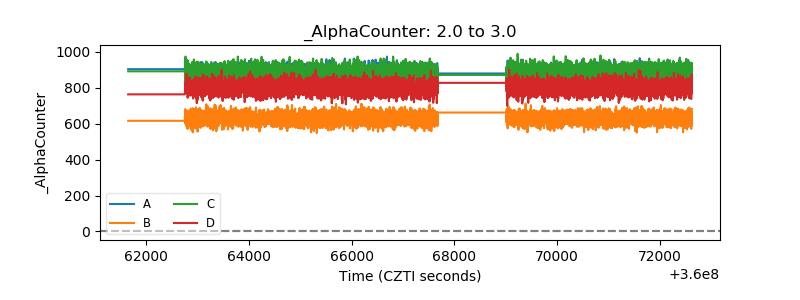 |
| _CPM_Rate | 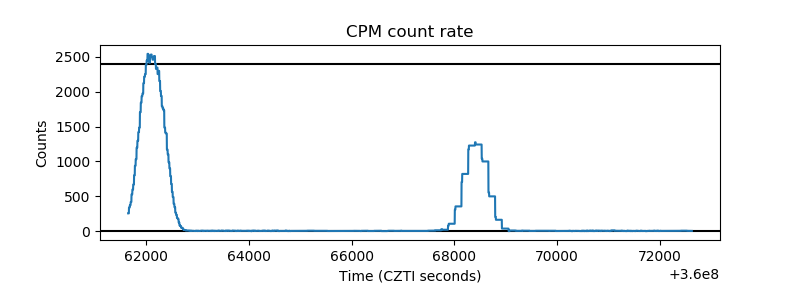 |
| CZT Counter | 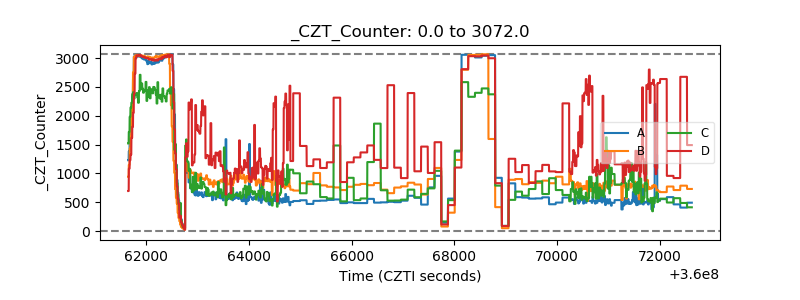 |
| +2.5 Volts monitor |  |
| +5 Volts monitor |  |
| _ROLL_ROT | 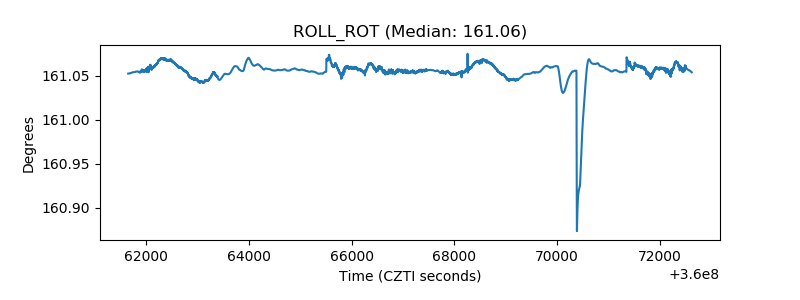 |
| _Roll_DEC | 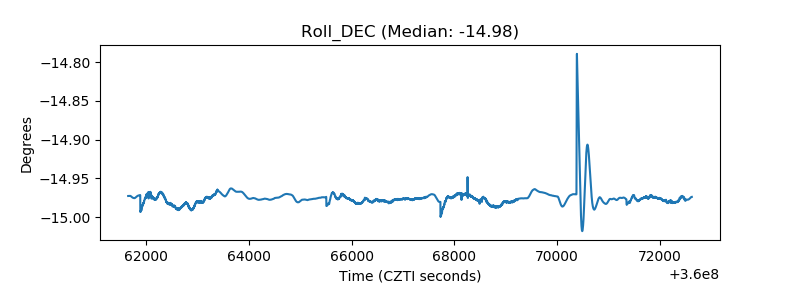 |
| _Roll_RA | 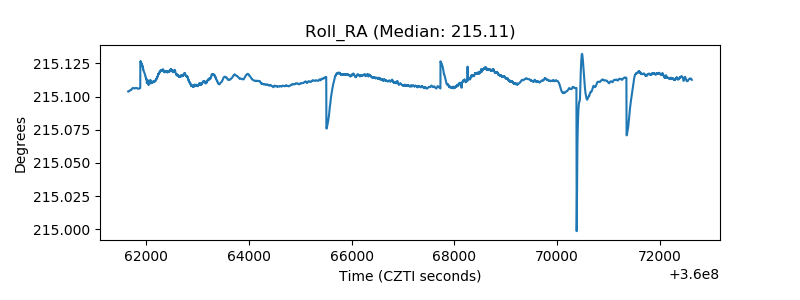 |
| Veto Counter | 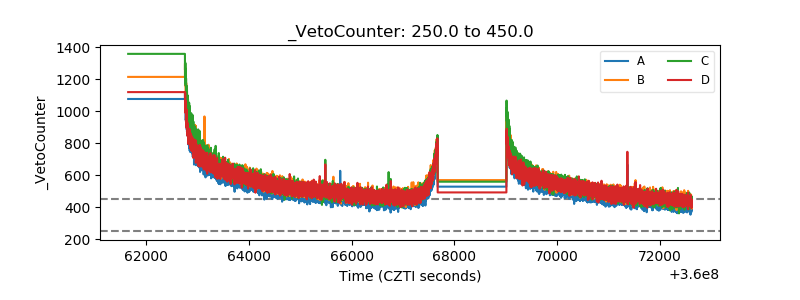 |