| Param | Original file | Final file |
|---|---|---|
| Filename | modeM0/AS1A10_094T78_9000004420cztM0_level2.fits | modeM0/AS1A10_094T78_9000004420cztM0_level2_quad_clean.evt |
| Size (bytes) | 200,122,560 | 275,719,680 |
| Size | 190.9 MB | 262.9 MB |
| Events in quadrant A | 1,265,588 | 1,923,828 |
| Events in quadrant B | 1,181,924 | 1,865,958 |
| Events in quadrant C | 1,204,870 | 1,786,298 |
| Events in quadrant D | 970,912 | 1,339,088 |
| Mode SS | |||
|---|---|---|---|
| Quadrant | BADHDUFLAG | Total packets | Discarded packets |
| A | 0 | 426 | 0 |
| B | 0 | 426 | 0 |
| C | 0 | 426 | 0 |
| D | 0 | 426 | 0 |
| Mode M9 | |||
|---|---|---|---|
| Quadrant | BADHDUFLAG | Total packets | Discarded packets |
| A | 0 | 23 | 0 |
| B | 0 | 23 | 0 |
| C | 0 | 23 | 0 |
| D | 0 | 23 | 0 |
| Mode M0 | |||
|---|---|---|---|
| Quadrant | BADHDUFLAG | Total packets | Discarded packets |
| A | 0 | 44512 | 0 |
| B | 0 | 63565 | 0 |
| C | 0 | 47749 | 0 |
| D | 0 | 104140 | 0 |
| Quadrant | Total seconds | Saturated seconds | Saturation percentage |
|---|---|---|---|
| A | 20839 | 383 | 1.837900% |
| B | 20839 | 623 | 2.989587% |
| C | 20839 | 540 | 2.591295% |
| D | 20839 | 4583 | 21.992418% |
Noise dominated data is calculated using 1-second bins in cleaned event files. If a bin has >2000 counts, and if more than 50% of those come from <1% of pixels, then it is considered to be noise-dominated and hence unusable.
| Quadrant | # 1 sec bins | Bins with >0 counts | Bins with >2000 counts | High rate bins dominated by noise | Noise dominated (total time) | Noise dominated (detector-on time) | Marked lightcurve |
|---|---|---|---|---|---|---|---|
| A | 23154 | 20837 | 0 | 0 | 0.00% | 0.00% | 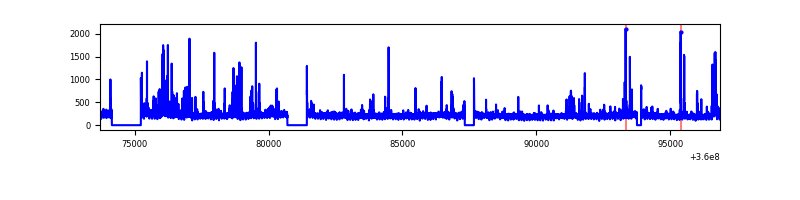 |
| B | 23154 | 20837 | 0 | 0 | 0.00% | 0.00% |  |
| C | 23153 | 20837 | 0 | 0 | 0.00% | 0.00% |  |
| D | 23154 | 20827 | 0 | 0 | 0.00% | 0.00% |  |
Top three noisy pixels from each quadrant. If the there are fewer than three noisy pixels in the level2.evt file, extra rows are filled as -1
| Pixel properties | Quadrant properties | ||||||
|---|---|---|---|---|---|---|---|
| Quadrant | DetID | PixID | Counts | Sigma | Mean | Median | Sigma |
| A | 0 | 29 | 1034 | 8.8 | 330 | 313 | 82.0 |
| A | 9 | 19 | 965 | 7.96 | 330 | 313 | 82.0 |
| A | 7 | 110 | 955 | 7.83 | 330 | 313 | 82.0 |
| B | 2 | 9 | 973 | 10.65 | 312 | 299 | 63.3 |
| B | 2 | 8 | 833 | 8.44 | 312 | 299 | 63.3 |
| B | 14 | 254 | 794 | 7.82 | 312 | 299 | 63.3 |
| C | 12 | 241 | 876 | 7.07 | 319 | 301 | 81.3 |
| C | 3 | 158 | 853 | 6.79 | 319 | 301 | 81.3 |
| C | 3 | 187 | 824 | 6.43 | 319 | 301 | 81.3 |
| D | 15 | 46 | 783 | 7.07 | 277 | 252 | 75.0 |
| D | 1 | 3 | 688 | 5.81 | 277 | 252 | 75.0 |
| D | 10 | 189 | 677 | 5.66 | 277 | 252 | 75.0 |
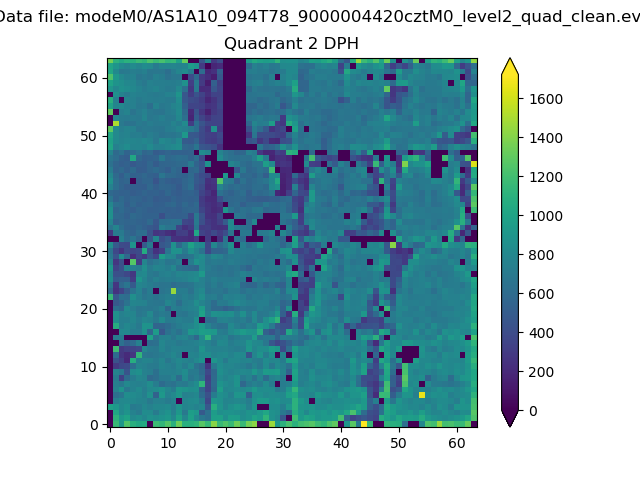
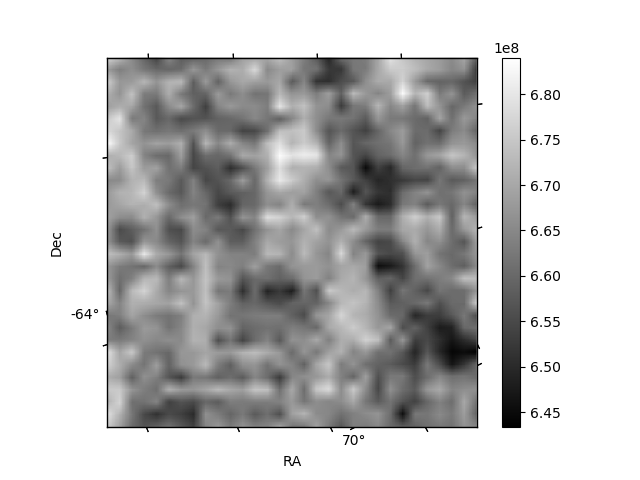
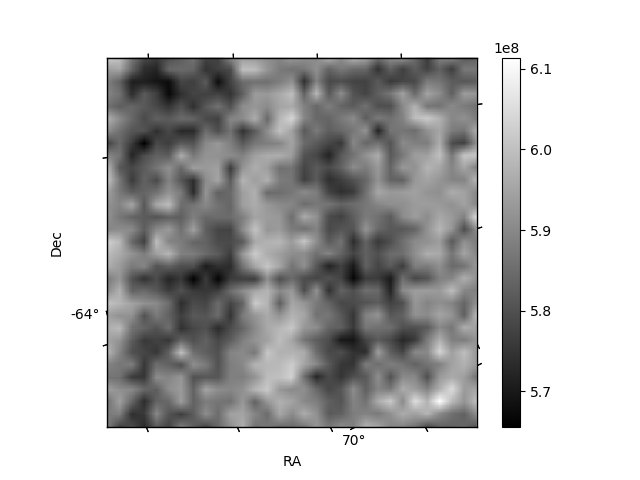
Histogram calculated using DETX and DETY for each event in the final _common_clean file
| Quadrant A |  |
 |
Quadrant B |
|---|---|---|---|
| Quadrant D | 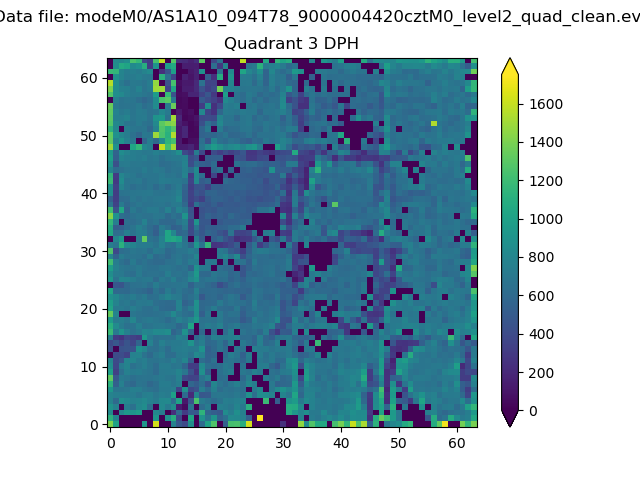 |
 |
Quadrant C |
| Plot type | Count rate plots | Images |
|---|---|---|
| Comparison with Poisson distribution Blue bars denote a histogram of data divided into 1 sec bins. Red curve is a Poisson curve with rate = median count rate of data. |
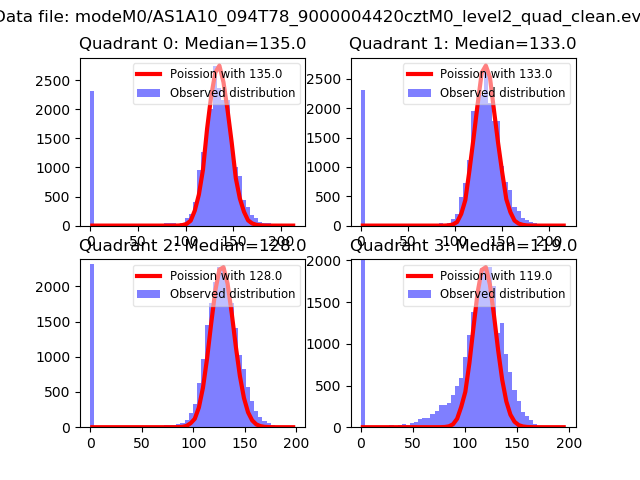 |
 |
| Quadrant-wise count rates Data is divided into 100 sec bins |
 |
|
| Module-wise count rates for Quadrant A Data is divided into 100 sec bins |
 |
 |
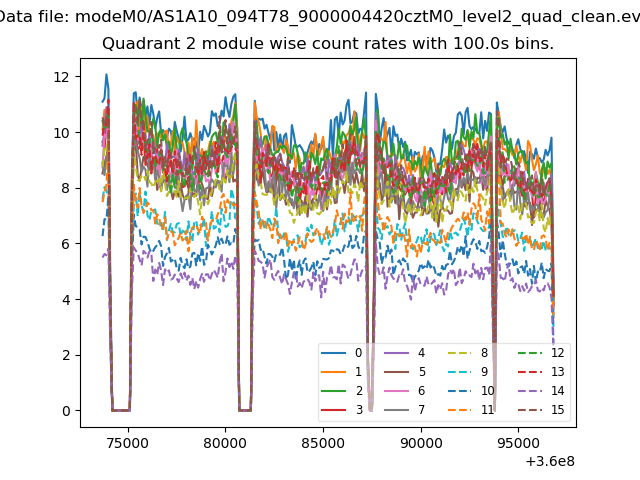
| Module-wise count rates for Quadrant B Data is divided into 100 sec bins |
 |
 |
| Module-wise count rates for Quadrant C Data is divided into 100 sec bins |
 |
 |
| Module-wise count rates for Quadrant D Data is divided into 100 sec bins |
 |
 |
| Parameter | Plot |
|---|---|
| CZT HV Monitor | 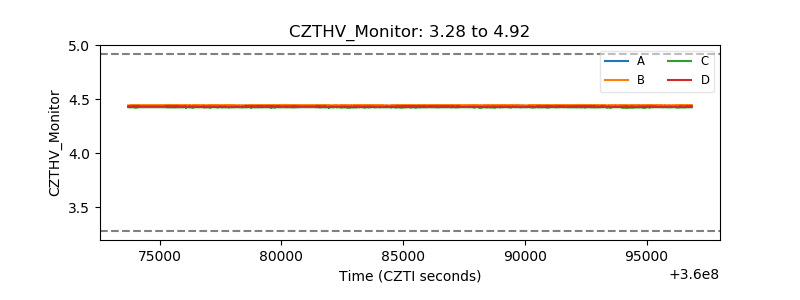 |
| D_VDD | 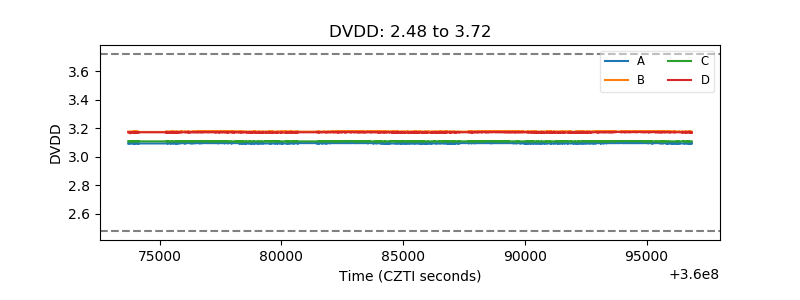 |
| Temperature 1 |  |
| Veto HV Monitor |  |
| Veto LLD | 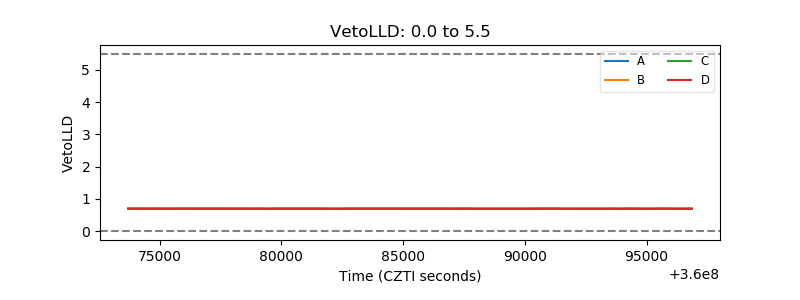 |
| Alpha Counter |  |
| _CPM_Rate |  |
| CZT Counter |  |
| +2.5 Volts monitor |  |
| +5 Volts monitor |  |
| _ROLL_ROT | 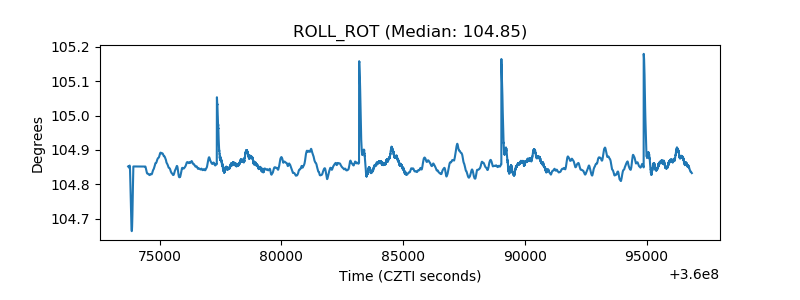 |
| _Roll_DEC |  |
| _Roll_RA |  |
| Veto Counter | 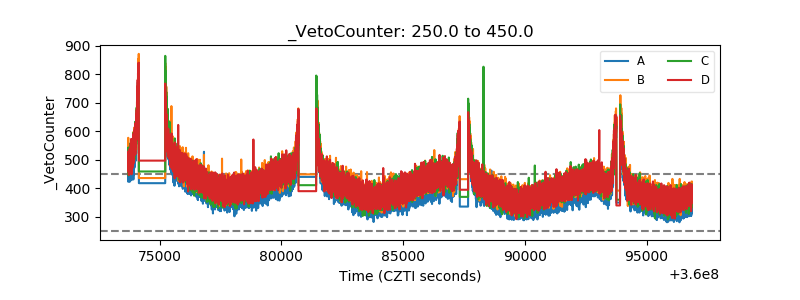 |