| Param | Original file | Final file |
|---|---|---|
| Filename | modeM0/AS1A10_094T78_9000004420_30660cztM0_level2.evt | modeM0/AS1A10_094T78_9000004420_30660cztM0_level2_quad_clean.evt |
| Size (bytes) | 239,181,120 | 43,436,160 |
| Size | 228.1 MB | 41.4 MB |
| Events in quadrant A | 1,246,104 | 304,307 |
| Events in quadrant B | 1,647,237 | 305,768 |
| Events in quadrant C | 1,272,665 | 292,807 |
| Events in quadrant D | 2,936,081 | 262,364 |
| Mode SS | |||
|---|---|---|---|
| Quadrant | BADHDUFLAG | Total packets | Discarded packets |
| A | 0 | 44 | 0 |
| B | 0 | 44 | 0 |
| C | 0 | 44 | 0 |
| D | 0 | 44 | 0 |
| Mode M9 | |||
|---|---|---|---|
| Quadrant | BADHDUFLAG | Total packets | Discarded packets |
| A | 0 | 11 | 0 |
| B | 0 | 11 | 0 |
| C | 0 | 11 | 0 |
| D | 0 | 11 | 0 |
| Mode M0 | |||
|---|---|---|---|
| Quadrant | BADHDUFLAG | Total packets | Discarded packets |
| A | 0 | 4997 | 1 |
| B | 0 | 6435 | 1 |
| C | 0 | 5131 | 1 |
| D | 0 | 10121 | 1 |
| Quadrant | Total seconds | Saturated seconds | Saturation percentage |
|---|---|---|---|
| A | 2059 | 114 | 5.536668% |
| B | 2059 | 144 | 6.993686% |
| C | 2059 | 149 | 7.236523% |
| D | 2059 | 557 | 27.051967% |
Noise dominated data is calculated using 1-second bins in cleaned event files. If a bin has >2000 counts, and if more than 50% of those come from <1% of pixels, then it is considered to be noise-dominated and hence unusable.
| Quadrant | # 1 sec bins | Bins with >0 counts | Bins with >2000 counts | High rate bins dominated by noise | Noise dominated (total time) | Noise dominated (detector-on time) | Marked lightcurve |
|---|---|---|---|---|---|---|---|
| A | 3144 | 2060 | 7 | 7 | 0.22% | 0.34% | 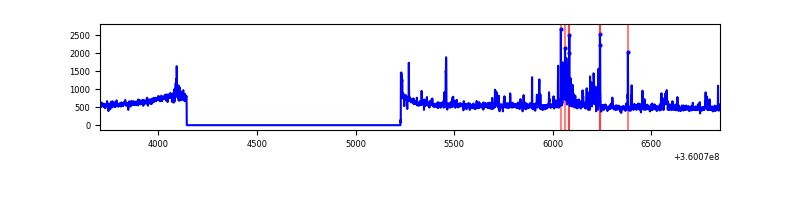 |
| B | 3144 | 2060 | 0 | 0 | 0.00% | 0.00% | 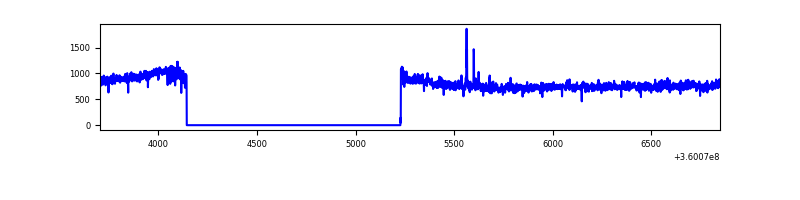 |
| C | 3144 | 2060 | 2 | 2 | 0.06% | 0.10% | 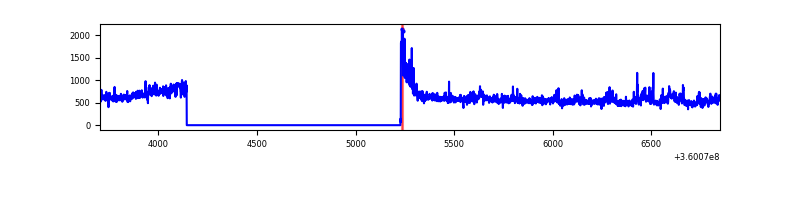 |
| D | 3144 | 2060 | 377 | 377 | 11.99% | 18.30% | 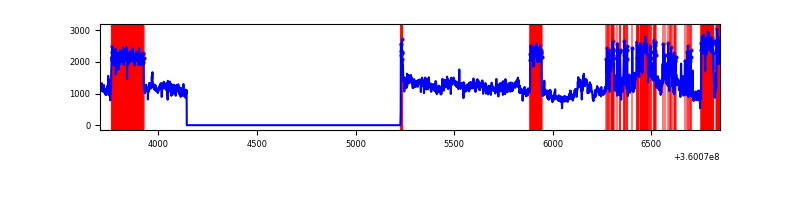 |
Top three noisy pixels from each quadrant. If the there are fewer than three noisy pixels in the level2.evt file, extra rows are filled as -1
| Pixel properties | Quadrant properties | ||||||
|---|---|---|---|---|---|---|---|
| Quadrant | DetID | PixID | Counts | Sigma | Mean | Median | Sigma |
| A | 0 | 13 | 115392 | 1943.63 | 288 | 282 | 59.2 |
| A | 12 | 96 | 10966 | 180.4 | 288 | 282 | 59.2 |
| A | 8 | 192 | 6223 | 100.31 | 288 | 282 | 59.2 |
| B | 6 | 159 | 537353 | 9870.31 | 277 | 270 | 54.4 |
| B | 0 | 190 | 10037 | 179.49 | 277 | 270 | 54.4 |
| B | 4 | 171 | 7109 | 125.68 | 277 | 270 | 54.4 |
| C | 3 | 233 | 131605 | 2033.46 | 271 | 270 | 64.6 |
| C | 14 | 238 | 44696 | 687.84 | 271 | 270 | 64.6 |
| C | 0 | 10 | 36833 | 566.1 | 271 | 270 | 64.6 |
| D | 8 | 195 | 1380038 | 19631.71 | 263 | 257 | 70.3 |
| D | 10 | 253 | 296145 | 4209.93 | 263 | 257 | 70.3 |
| D | 13 | 249 | 183495 | 2607.14 | 263 | 257 | 70.3 |
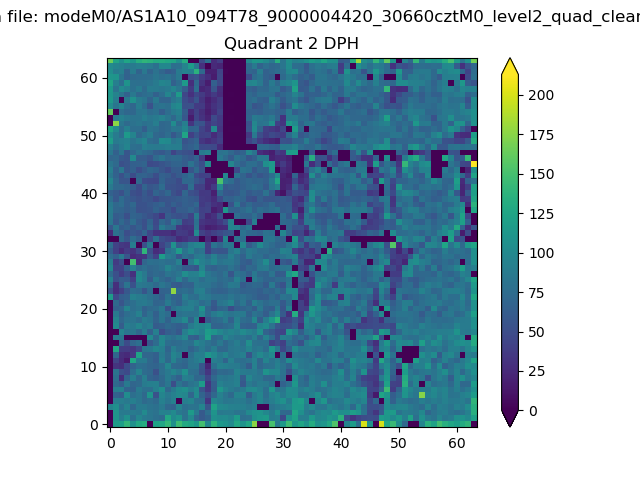
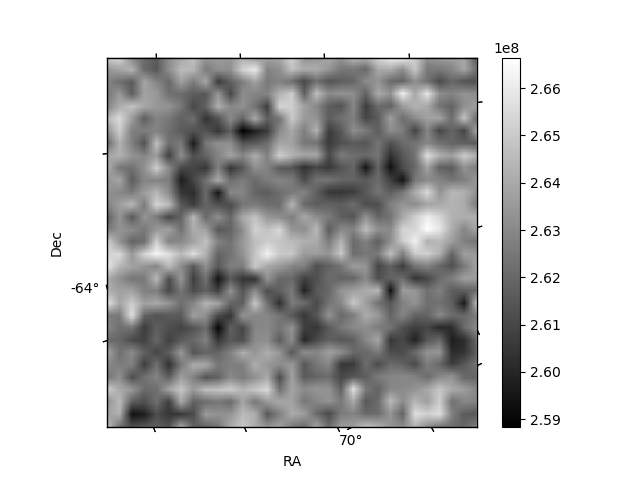
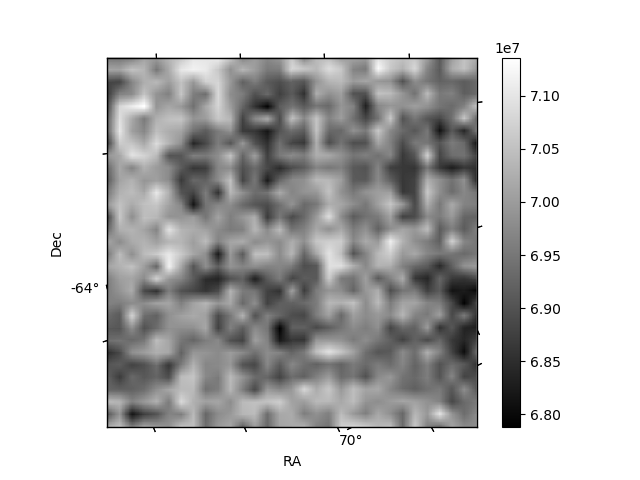
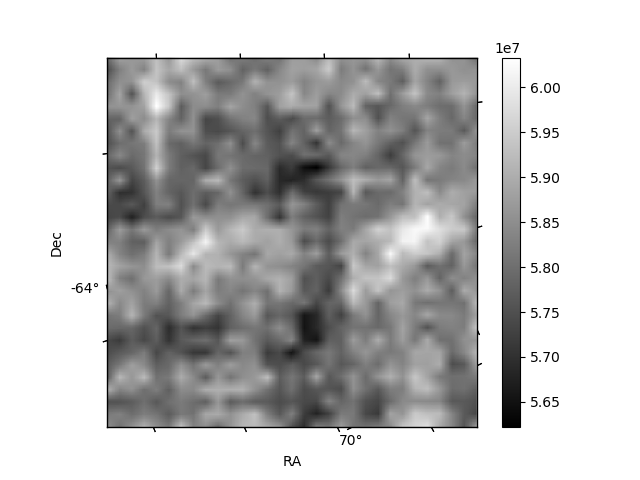
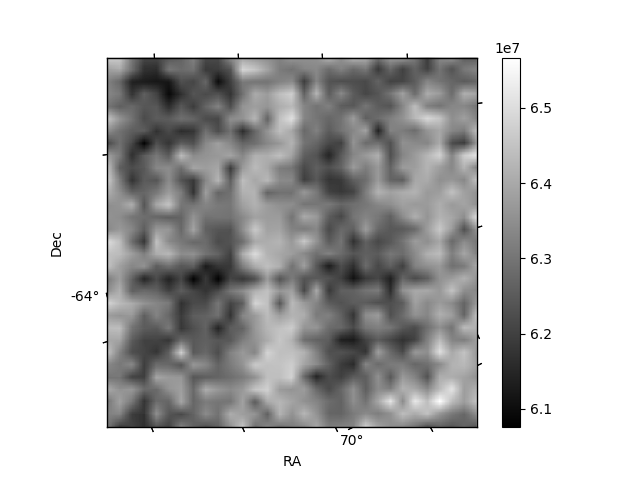
Histogram calculated using DETX and DETY for each event in the final _common_clean file
| Quadrant A | 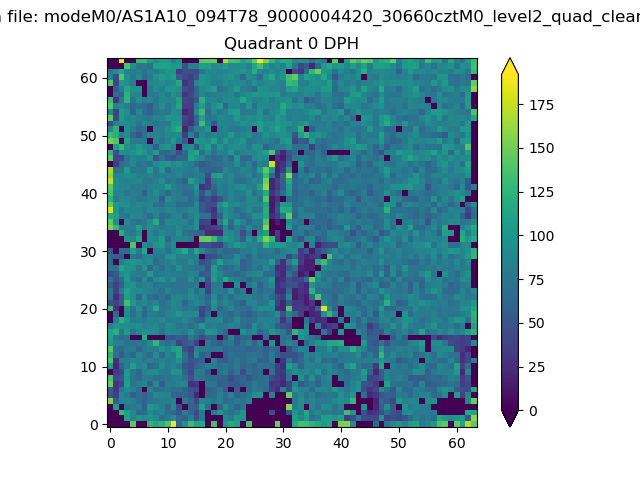 |
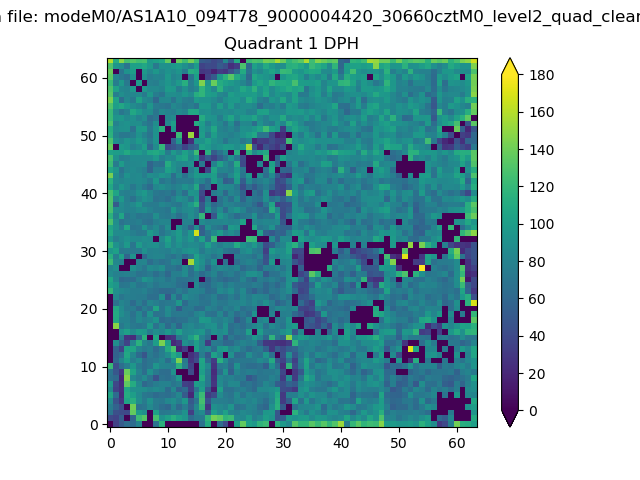 |
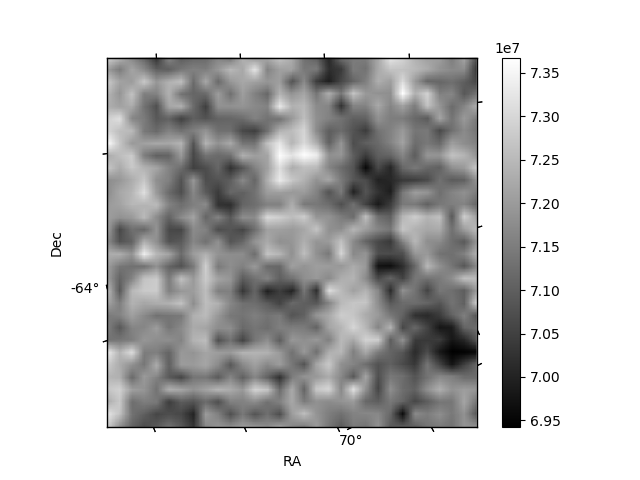
Quadrant B |
|---|---|---|---|
| Quadrant D | 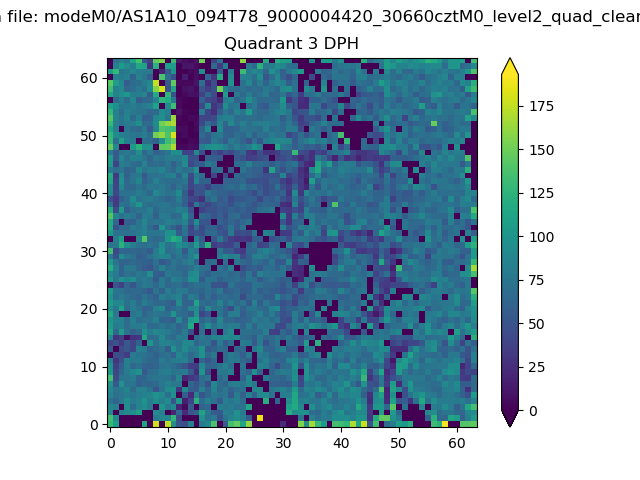 |
 |
Quadrant C |
| Plot type | Count rate plots | Images |
|---|---|---|
| Comparison with Poisson distribution Blue bars denote a histogram of data divided into 1 sec bins. Red curve is a Poisson curve with rate = median count rate of data. |
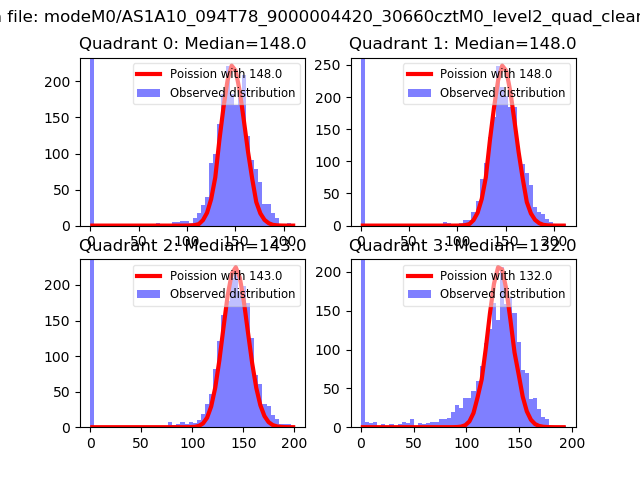 |
 |
| Quadrant-wise count rates Data is divided into 100 sec bins |
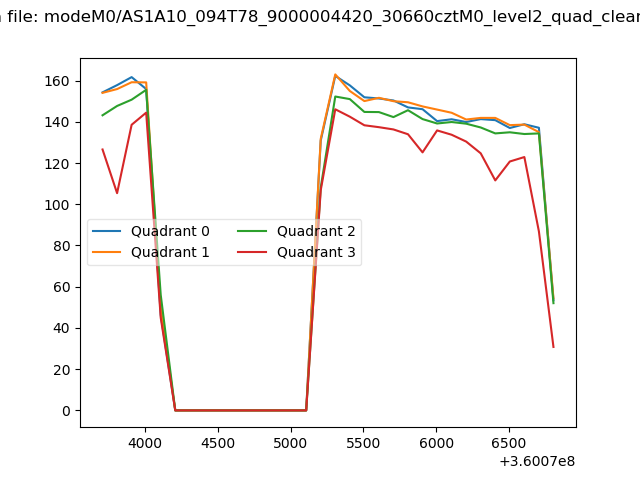 |
|
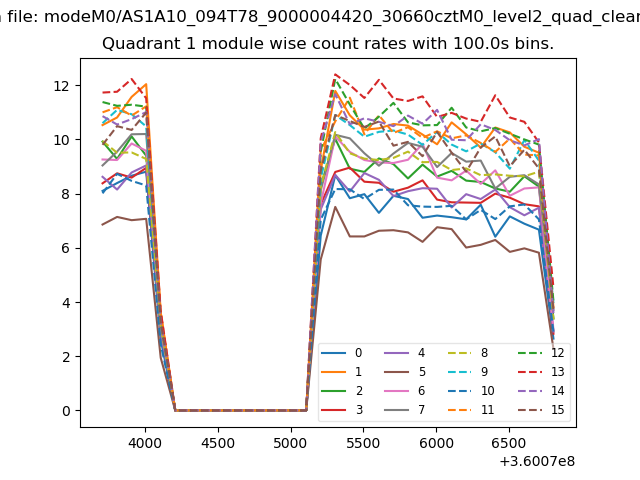
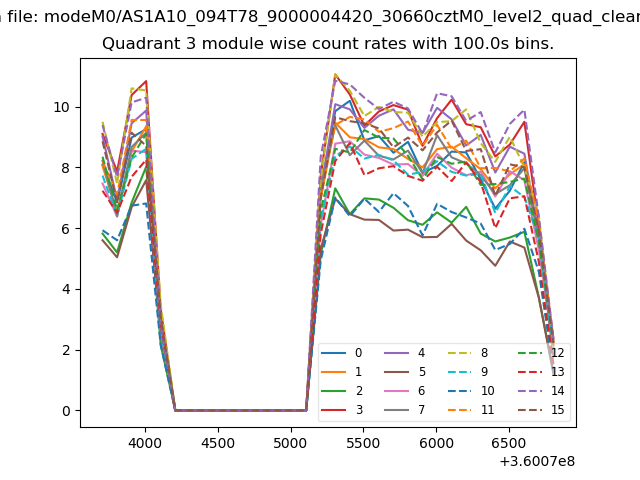
| Module-wise count rates for Quadrant A Data is divided into 100 sec bins |
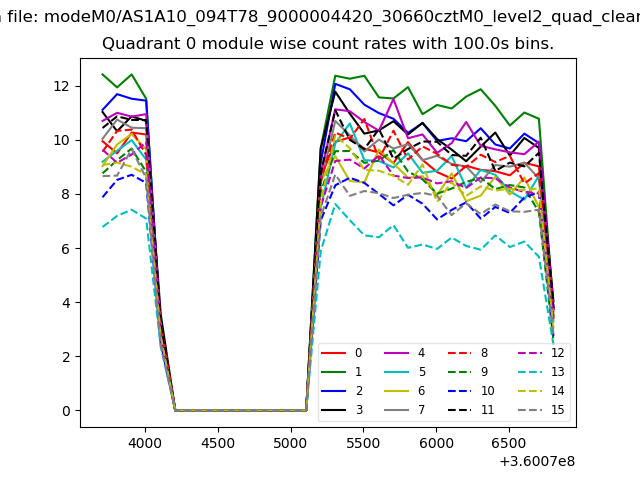 |
 |
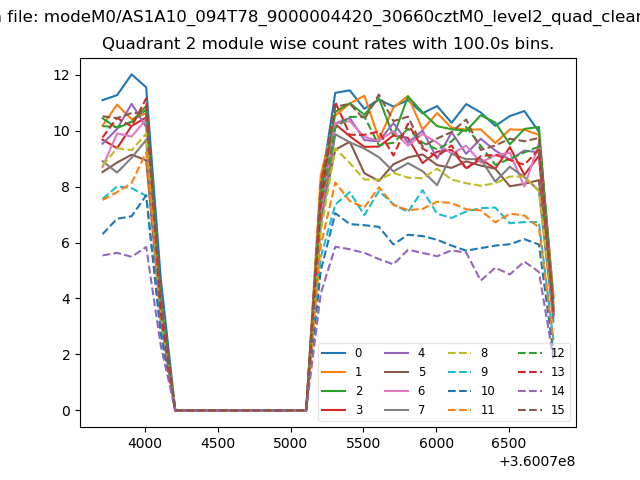
| Module-wise count rates for Quadrant B Data is divided into 100 sec bins |
 |
 |
| Module-wise count rates for Quadrant C Data is divided into 100 sec bins |
 |
 |
| Module-wise count rates for Quadrant D Data is divided into 100 sec bins |
 |
 |
| Parameter | Plot |
|---|---|
| CZT HV Monitor | 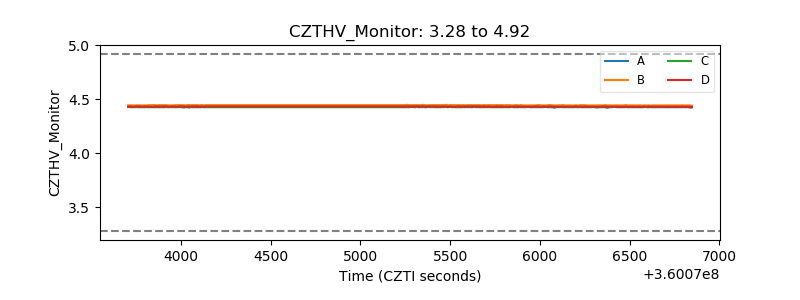 |
| D_VDD | 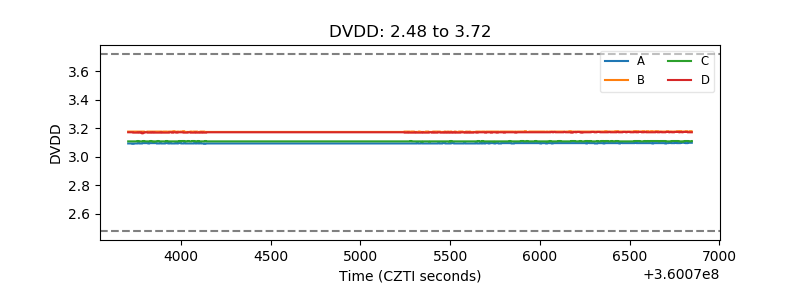 |
| Temperature 1 | 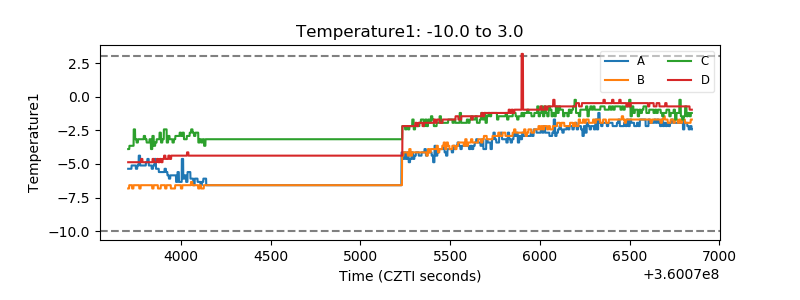 |
| Veto HV Monitor | 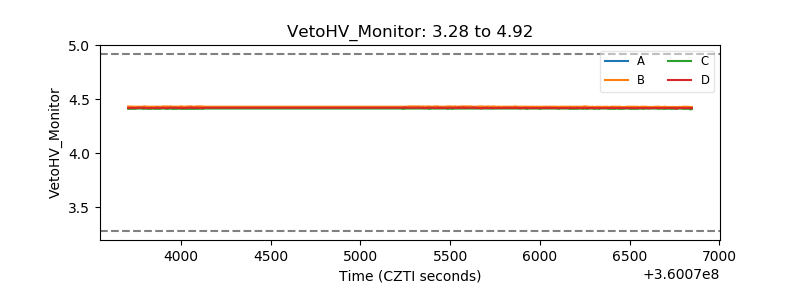 |
| Veto LLD | 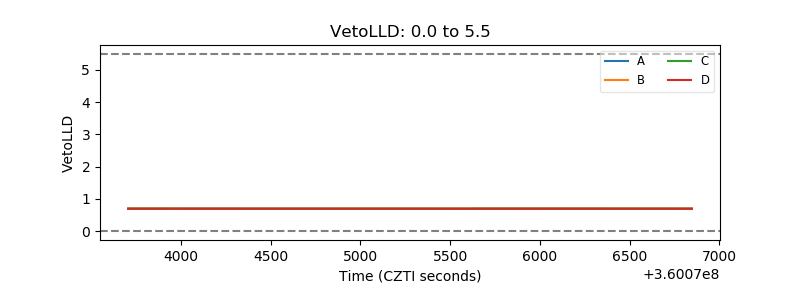 |
| Alpha Counter | 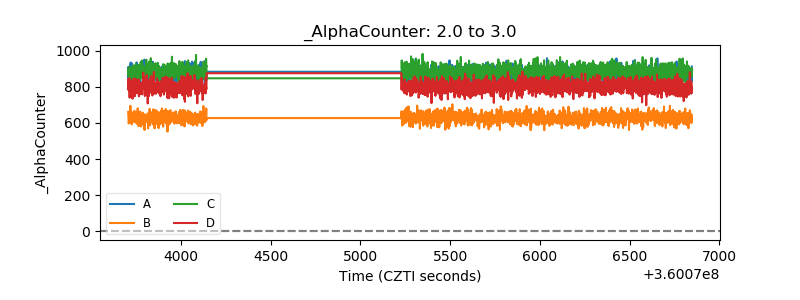 |
| _CPM_Rate | 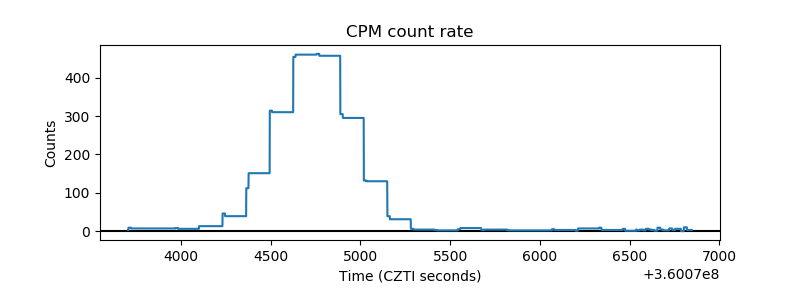 |
| CZT Counter | 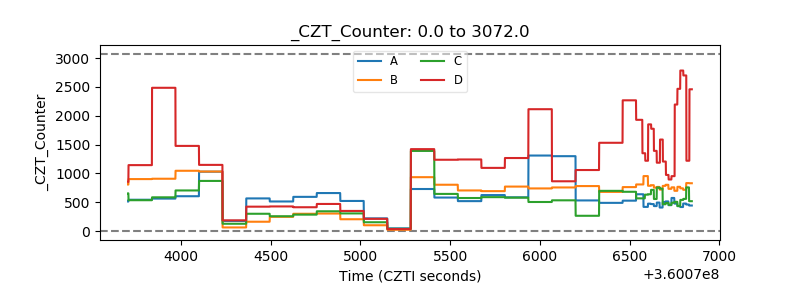 |
| +2.5 Volts monitor |  |
| +5 Volts monitor |  |
| _ROLL_ROT | 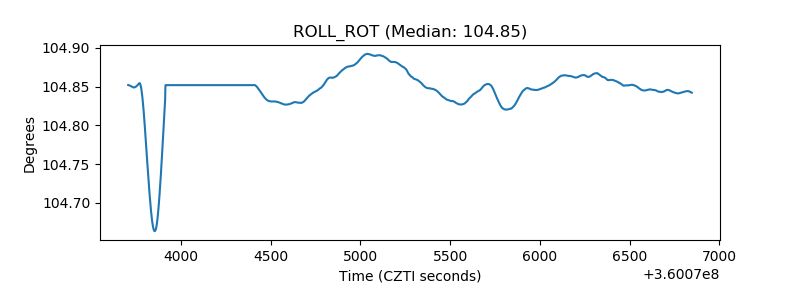 |
| _Roll_DEC | 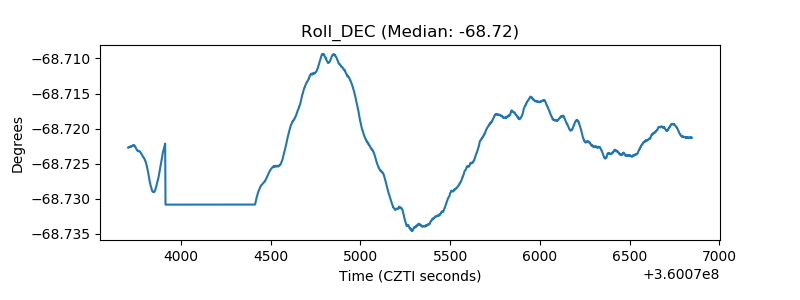 |
| _Roll_RA | 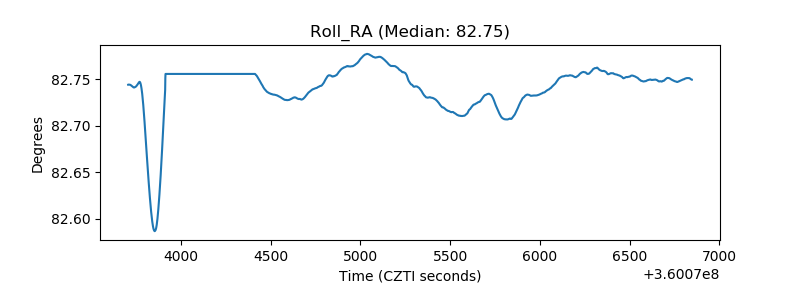 |
| Veto Counter | 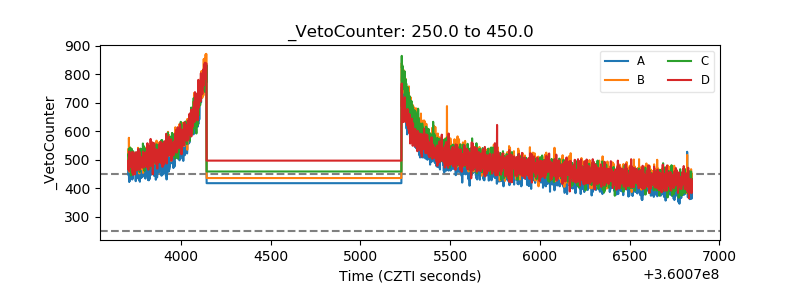 |