| Param | Original file | Final file |
|---|---|---|
| Filename | modeM0/AS1A10_094T78_9000004420_30664cztM0_level2.evt | modeM0/AS1A10_094T78_9000004420_30664cztM0_level2_quad_clean.evt |
| Size (bytes) | 320,875,200 | 51,626,880 |
| Size | 306.0 MB | 49.2 MB |
| Events in quadrant A | 1,344,725 | 361,535 |
| Events in quadrant B | 2,240,893 | 351,583 |
| Events in quadrant C | 1,461,098 | 341,658 |
| Events in quadrant D | 4,477,955 | 305,658 |
| Mode SS | |||
|---|---|---|---|
| Quadrant | BADHDUFLAG | Total packets | Discarded packets |
| A | 0 | 58 | 0 |
| B | 0 | 58 | 0 |
| C | 0 | 58 | 0 |
| D | 0 | 58 | 0 |
| Mode M0 | |||
|---|---|---|---|
| Quadrant | BADHDUFLAG | Total packets | Discarded packets |
| A | 0 | 5994 | 0 |
| B | 0 | 8890 | 0 |
| C | 0 | 6185 | 0 |
| D | 0 | 15319 | 0 |
| Quadrant | Total seconds | Saturated seconds | Saturation percentage |
|---|---|---|---|
| A | 2830 | 10 | 0.353357% |
| B | 2831 | 42 | 1.483575% |
| C | 2831 | 26 | 0.918403% |
| D | 2831 | 576 | 20.346167% |
Noise dominated data is calculated using 1-second bins in cleaned event files. If a bin has >2000 counts, and if more than 50% of those come from <1% of pixels, then it is considered to be noise-dominated and hence unusable.
| Quadrant | # 1 sec bins | Bins with >0 counts | Bins with >2000 counts | High rate bins dominated by noise | Noise dominated (total time) | Noise dominated (detector-on time) | Marked lightcurve |
|---|---|---|---|---|---|---|---|
| A | 2830 | 2830 | 4 | 4 | 0.14% | 0.14% | 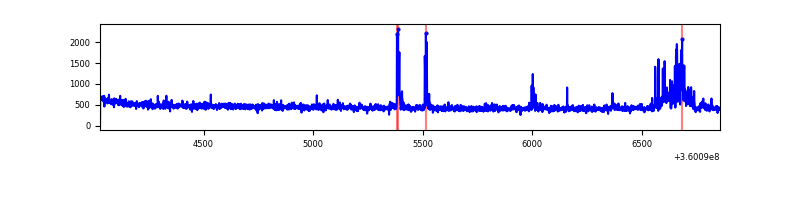 |
| B | 2831 | 2831 | 16 | 16 | 0.57% | 0.57% | 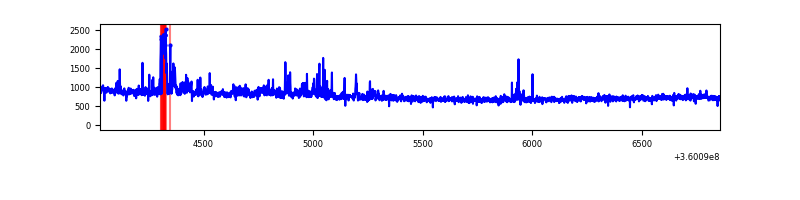 |
| C | 2831 | 2831 | 1 | 1 | 0.04% | 0.04% | 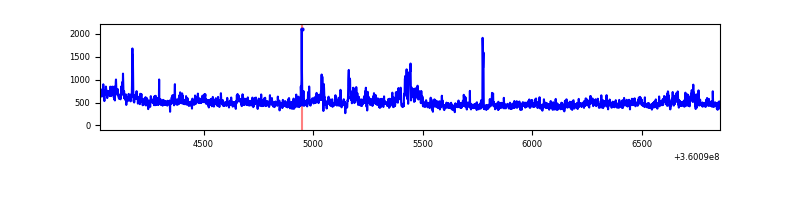 |
| D | 2831 | 2831 | 711 | 711 | 25.11% | 25.11% | 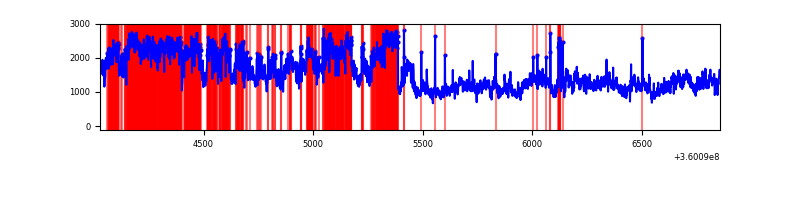 |
Top three noisy pixels from each quadrant. If the there are fewer than three noisy pixels in the level2.evt file, extra rows are filled as -1
| Pixel properties | Quadrant properties | ||||||
|---|---|---|---|---|---|---|---|
| Quadrant | DetID | PixID | Counts | Sigma | Mean | Median | Sigma |
| A | 0 | 13 | 105549 | 1601.22 | 320 | 313 | 65.7 |
| A | 13 | 254 | 5375 | 77.02 | 320 | 313 | 65.7 |
| A | 3 | 137 | 3260 | 44.84 | 320 | 313 | 65.7 |
| B | 6 | 159 | 819974 | 13310.05 | 317 | 309 | 61.6 |
| B | 5 | 172 | 61363 | 991.42 | 317 | 309 | 61.6 |
| B | 15 | 32 | 48559 | 783.5 | 317 | 309 | 61.6 |
| C | 3 | 233 | 219404 | 3055.23 | 300 | 302 | 71.7 |
| C | 14 | 238 | 49257 | 682.65 | 300 | 302 | 71.7 |
| C | 10 | 22 | 8677 | 116.78 | 300 | 302 | 71.7 |
| D | 8 | 195 | 2036973 | 29185.44 | 287 | 279 | 69.8 |
| D | 12 | 79 | 977232 | 13999.55 | 287 | 279 | 69.8 |
| D | 12 | 227 | 105098 | 1502.04 | 287 | 279 | 69.8 |
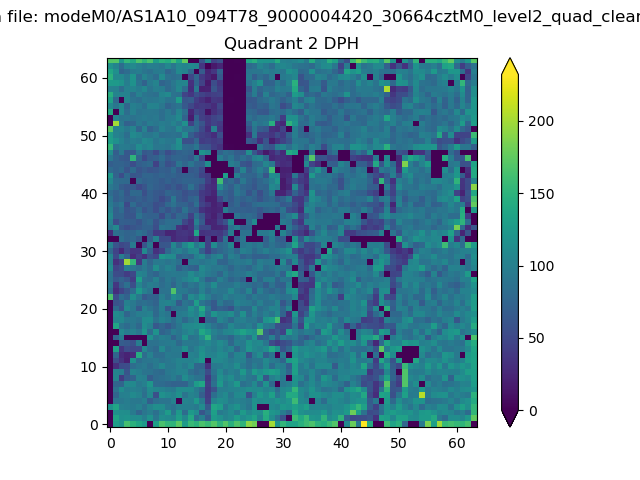
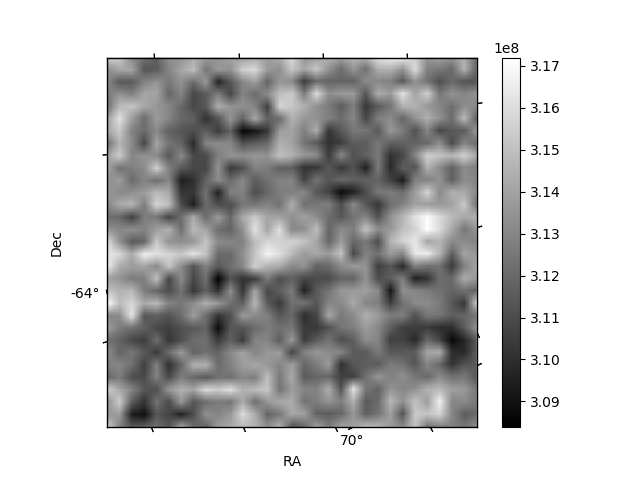
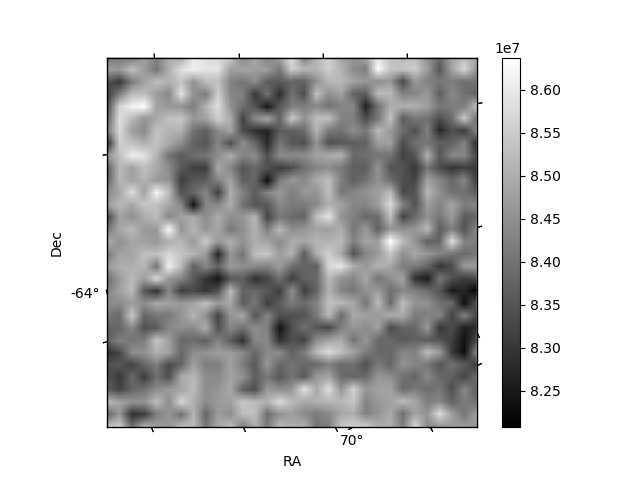
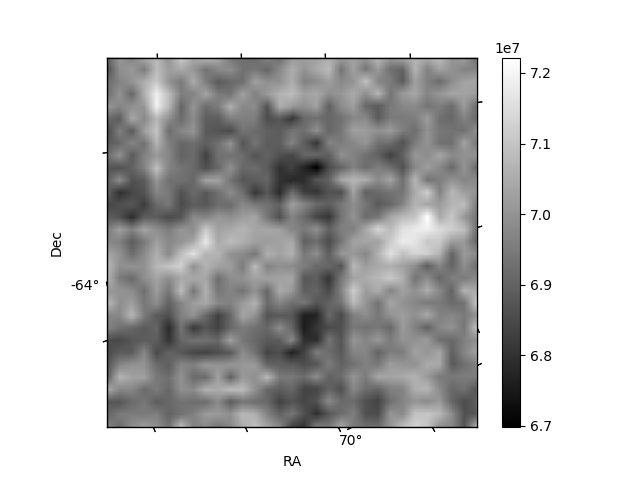
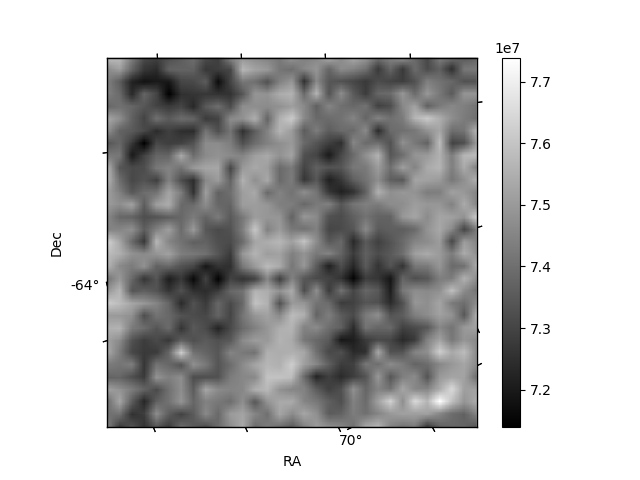
Histogram calculated using DETX and DETY for each event in the final _common_clean file
| Quadrant A | 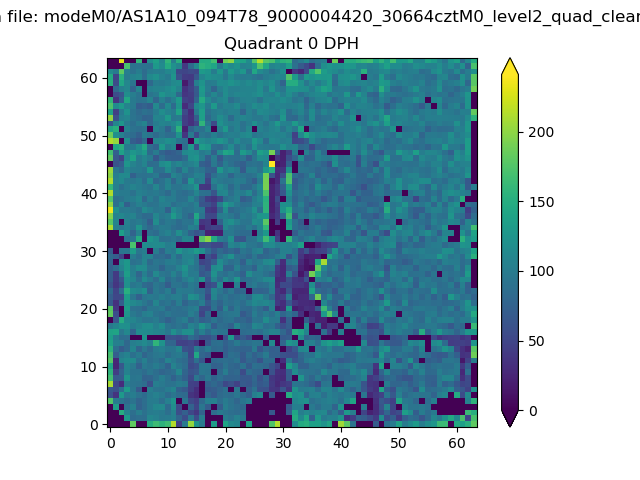 |
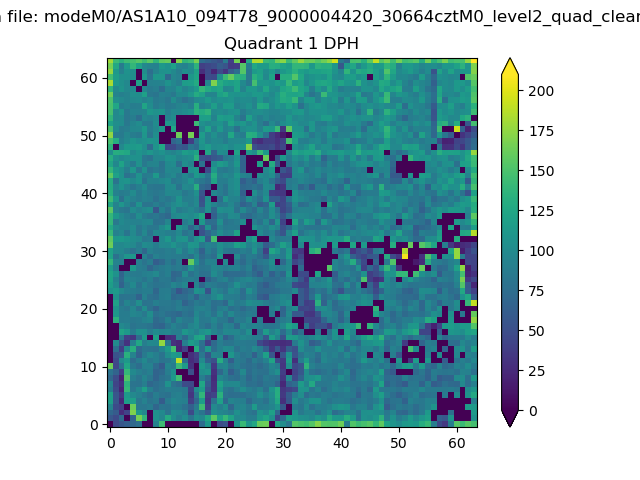 |
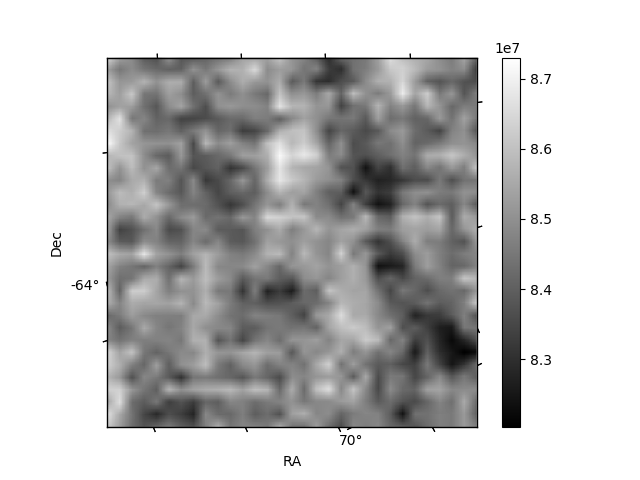
Quadrant B |
|---|---|---|---|
| Quadrant D | 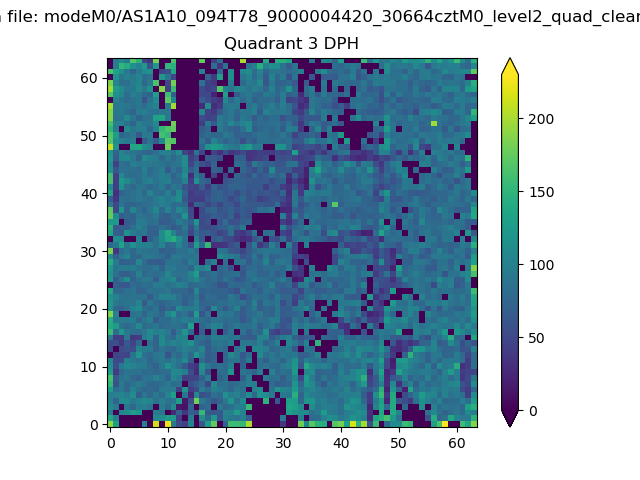 |
 |
Quadrant C |
| Plot type | Count rate plots | Images |
|---|---|---|
| Comparison with Poisson distribution Blue bars denote a histogram of data divided into 1 sec bins. Red curve is a Poisson curve with rate = median count rate of data. |
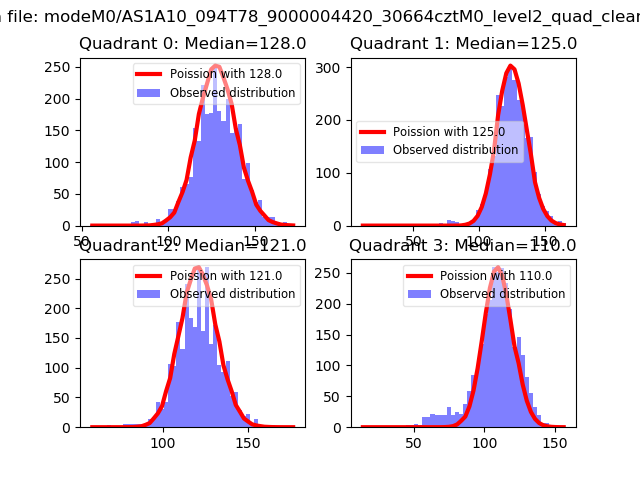 |
 |
| Quadrant-wise count rates Data is divided into 100 sec bins |
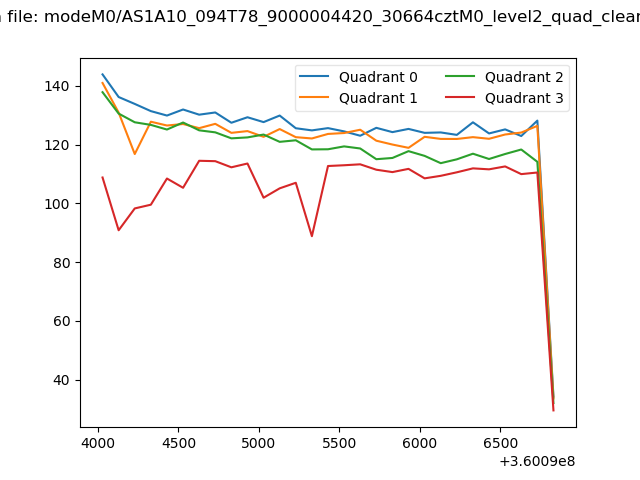 |
|
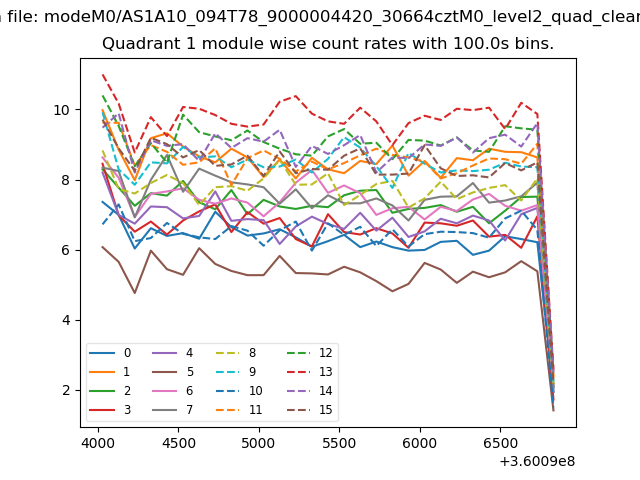
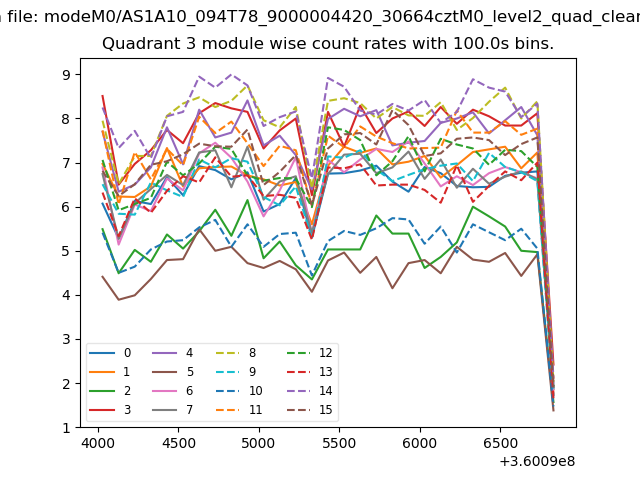
| Module-wise count rates for Quadrant A Data is divided into 100 sec bins |
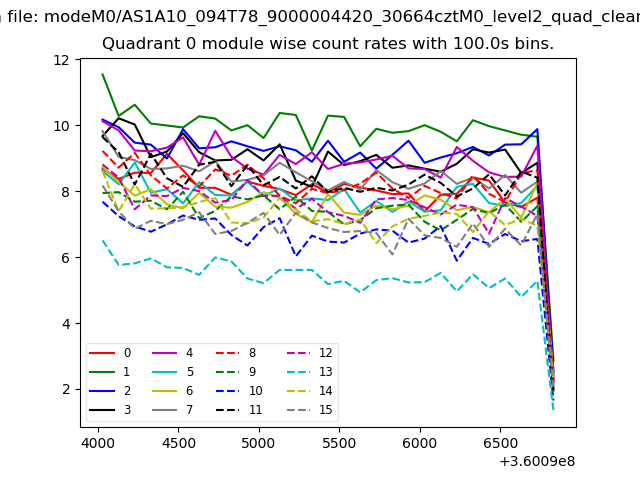 |
 |
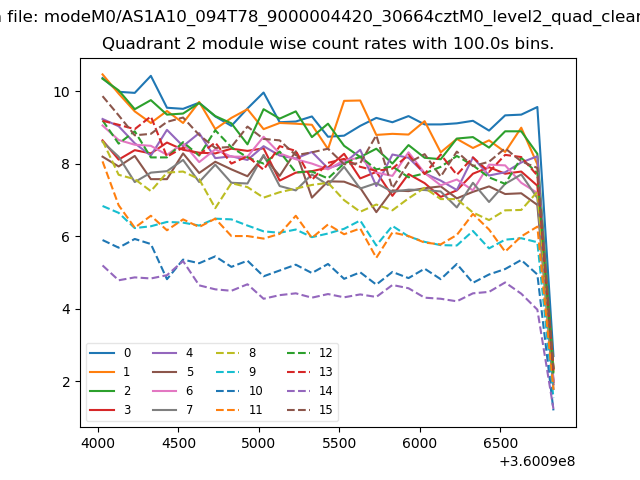
| Module-wise count rates for Quadrant B Data is divided into 100 sec bins |
 |
 |
| Module-wise count rates for Quadrant C Data is divided into 100 sec bins |
 |
 |
| Module-wise count rates for Quadrant D Data is divided into 100 sec bins |
 |
 |
| Parameter | Plot |
|---|---|
| CZT HV Monitor | 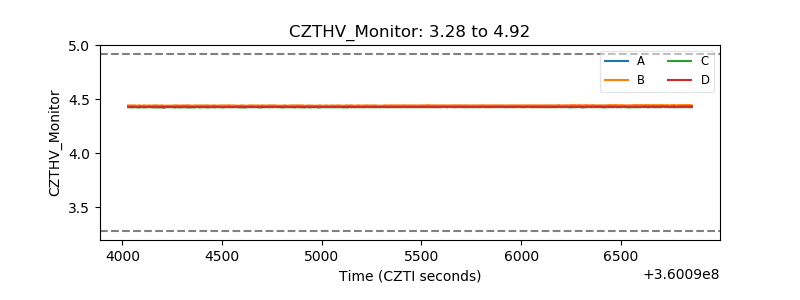 |
| D_VDD | 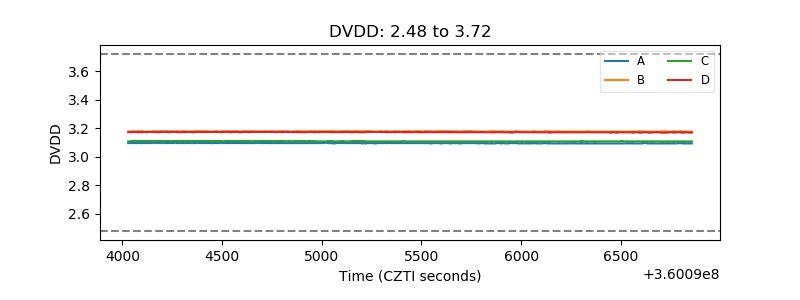 |
| Temperature 1 | 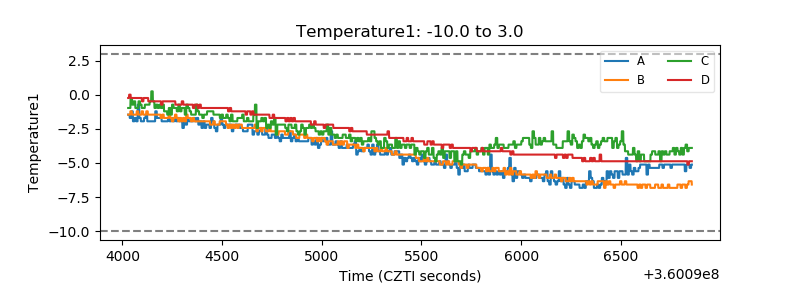 |
| Veto HV Monitor | 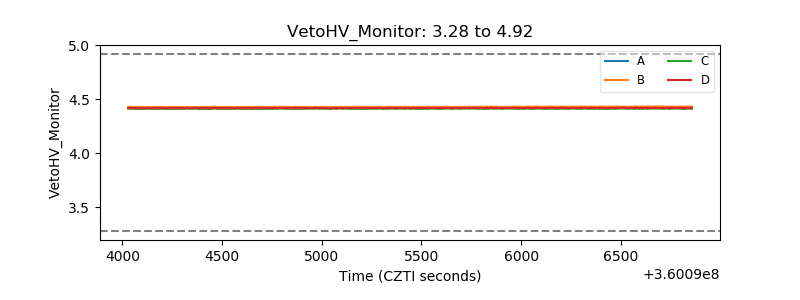 |
| Veto LLD | 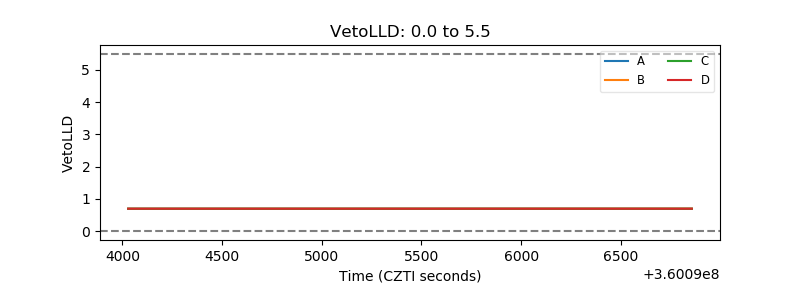 |
| Alpha Counter | 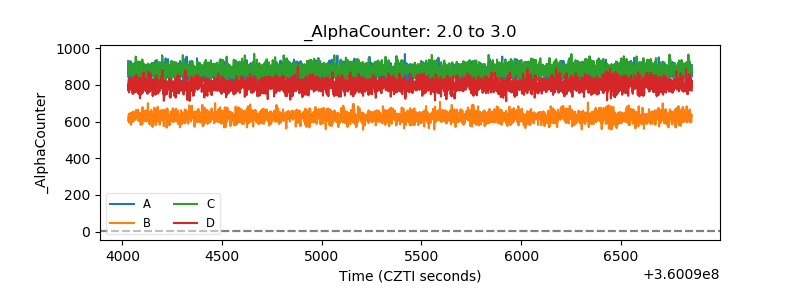 |
| _CPM_Rate | 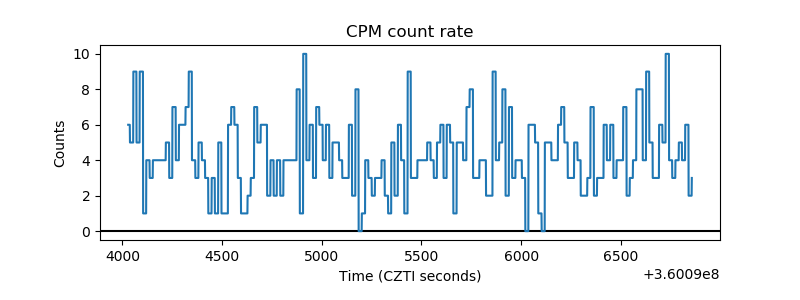 |
| CZT Counter |  |
| +2.5 Volts monitor |  |
| +5 Volts monitor |  |
| _ROLL_ROT | 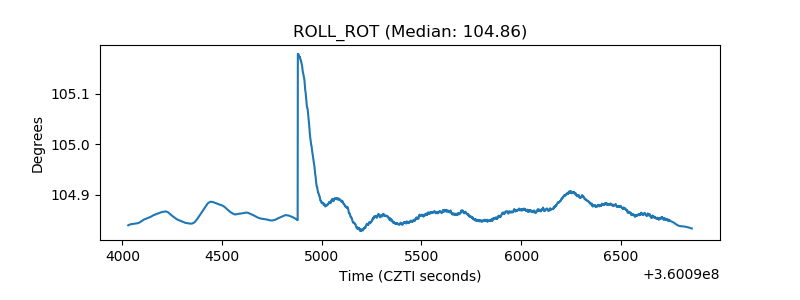 |
| _Roll_DEC | 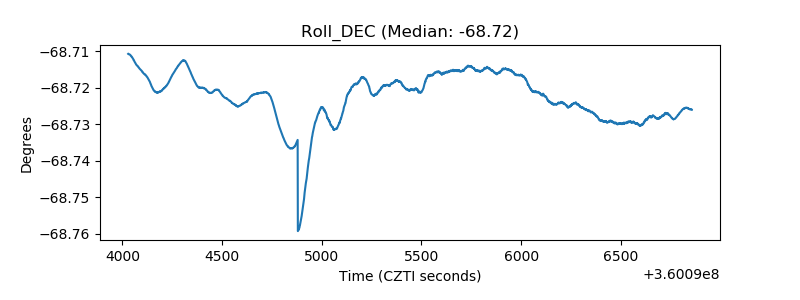 |
| _Roll_RA | 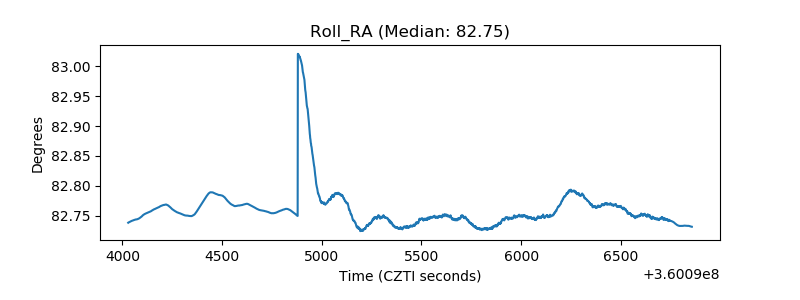 |
| Veto Counter | 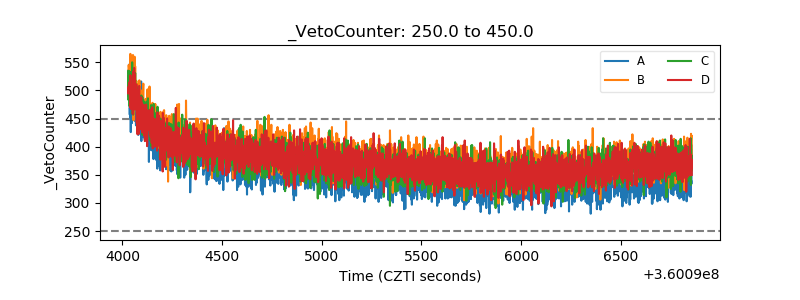 |