| Param | Original file | Final file |
|---|---|---|
| Filename | modeM0/AS1A10_094T79_9000004422cztM0_level2.fits | modeM0/AS1A10_094T79_9000004422cztM0_level2_quad_clean.evt |
| Size (bytes) | 382,291,200 | 461,698,560 |
| Size | 364.6 MB | 440.3 MB |
| Events in quadrant A | 2,438,724 | 3,143,042 |
| Events in quadrant B | 2,269,976 | 3,076,190 |
| Events in quadrant C | 2,342,382 | 2,953,080 |
| Events in quadrant D | 1,862,594 | 2,150,521 |
| Mode M9 | |||
|---|---|---|---|
| Quadrant | BADHDUFLAG | Total packets | Discarded packets |
| A | 0 | 59 | 0 |
| B | 0 | 59 | 0 |
| C | 0 | 59 | 0 |
| D | 0 | 59 | 0 |
| Mode M0 | |||
|---|---|---|---|
| Quadrant | BADHDUFLAG | Total packets | Discarded packets |
| A | 0 | 82955 | 0 |
| B | 0 | 117615 | 0 |
| C | 0 | 86472 | 0 |
| D | 0 | 202919 | 0 |
| Mode SS | |||
|---|---|---|---|
| Quadrant | BADHDUFLAG | Total packets | Discarded packets |
| A | 0 | 790 | 0 |
| B | 0 | 790 | 0 |
| C | 0 | 790 | 0 |
| D | 0 | 790 | 0 |
| Quadrant | Total seconds | Saturated seconds | Saturation percentage |
|---|---|---|---|
| A | 38730 | 390 | 1.006971% |
| B | 38730 | 538 | 1.389104% |
| C | 38730 | 799 | 2.063000% |
| D | 38730 | 9579 | 24.732765% |
Noise dominated data is calculated using 1-second bins in cleaned event files. If a bin has >2000 counts, and if more than 50% of those come from <1% of pixels, then it is considered to be noise-dominated and hence unusable.
| Quadrant | # 1 sec bins | Bins with >0 counts | Bins with >2000 counts | High rate bins dominated by noise | Noise dominated (total time) | Noise dominated (detector-on time) | Marked lightcurve |
|---|---|---|---|---|---|---|---|
| A | 44735 | 38724 | 0 | 0 | 0.00% | 0.00% |  |
| B | 44734 | 38726 | 0 | 0 | 0.00% | 0.00% |  |
| C | 44734 | 38722 | 0 | 0 | 0.00% | 0.00% |  |
| D | 44734 | 38699 | 0 | 0 | 0.00% | 0.00% |  |
Top three noisy pixels from each quadrant. If the there are fewer than three noisy pixels in the level2.evt file, extra rows are filled as -1
| Pixel properties | Quadrant properties | ||||||
|---|---|---|---|---|---|---|---|
| Quadrant | DetID | PixID | Counts | Sigma | Mean | Median | Sigma |
| A | 0 | 29 | 1980 | 8.84 | 636 | 600 | 156.1 |
| A | 7 | 110 | 1879 | 8.19 | 636 | 600 | 156.1 |
| A | 9 | 19 | 1816 | 7.79 | 636 | 600 | 156.1 |
| B | 2 | 9 | 1908 | 11.31 | 600 | 576 | 117.8 |
| B | 2 | 8 | 1537 | 8.16 | 600 | 576 | 117.8 |
| B | 5 | 128 | 1521 | 8.02 | 600 | 576 | 117.8 |
| C | 1 | 81 | 1818 | 7.95 | 620 | 584 | 155.2 |
| C | 1 | 80 | 1787 | 7.75 | 620 | 584 | 155.2 |
| C | 3 | 187 | 1605 | 6.58 | 620 | 584 | 155.2 |
| D | 15 | 46 | 1396 | 6.46 | 532 | 488 | 140.5 |
| D | 10 | 189 | 1302 | 5.79 | 532 | 488 | 140.5 |
| D | 6 | 231 | 1297 | 5.76 | 532 | 488 | 140.5 |
Histogram calculated using DETX and DETY for each event in the final _common_clean file
| Quadrant A |  |
 |
Quadrant B |
|---|---|---|---|
| Quadrant D |  |
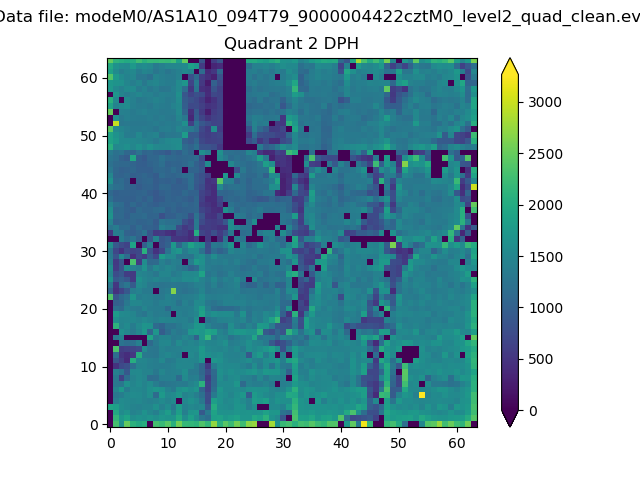 |
Quadrant C |
| Plot type | Count rate plots | Images |
|---|---|---|
| Comparison with Poisson distribution Blue bars denote a histogram of data divided into 1 sec bins. Red curve is a Poisson curve with rate = median count rate of data. |
 |
 |
| Quadrant-wise count rates Data is divided into 100 sec bins |
 |
|
| Module-wise count rates for Quadrant A Data is divided into 100 sec bins |
 |
 |
| Module-wise count rates for Quadrant B Data is divided into 100 sec bins |
 |
 |
| Module-wise count rates for Quadrant C Data is divided into 100 sec bins |
 |
 |
| Module-wise count rates for Quadrant D Data is divided into 100 sec bins |
 |
 |
| Parameter | Plot |
|---|---|
| CZT HV Monitor |  |
| D_VDD |  |
| Temperature 1 |  |
| Veto HV Monitor |  |
| Veto LLD |  |
| Alpha Counter |  |
| _CPM_Rate |  |
| CZT Counter | 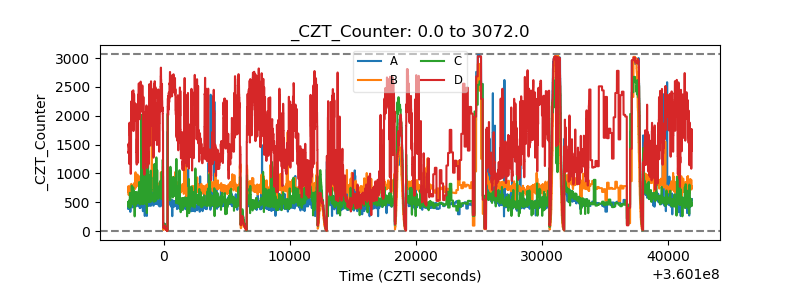 |
| +2.5 Volts monitor |  |
| +5 Volts monitor |  |
| _ROLL_ROT |  |
| _Roll_DEC |  |
| _Roll_RA |  |
| Veto Counter |  |