| Param | Original file | Final file |
|---|---|---|
| Filename | modeM0/AS1A10_094T79_9000004422_30666cztM0_level2.evt | modeM0/AS1A10_094T79_9000004422_30666cztM0_level2_quad_clean.evt |
| Size (bytes) | 1,426,536,000 | 230,906,880 |
| Size | 1.3 GB | 220.2 MB |
| Events in quadrant A | 6,179,528 | 1,620,616 |
| Events in quadrant B | 9,500,322 | 1,600,676 |
| Events in quadrant C | 6,779,319 | 1,542,490 |
| Events in quadrant D | 19,901,192 | 1,361,440 |
| Mode M9 | |||
|---|---|---|---|
| Quadrant | BADHDUFLAG | Total packets | Discarded packets |
| A | 0 | 12 | 0 |
| B | 0 | 12 | 0 |
| C | 0 | 12 | 0 |
| D | 0 | 12 | 0 |
| Mode M0 | |||
|---|---|---|---|
| Quadrant | BADHDUFLAG | Total packets | Discarded packets |
| A | 0 | 26546 | 2 |
| B | 0 | 37875 | 2 |
| C | 0 | 27725 | 2 |
| D | 0 | 67914 | 4 |
| Mode SS | |||
|---|---|---|---|
| Quadrant | BADHDUFLAG | Total packets | Discarded packets |
| A | 0 | 256 | 0 |
| B | 0 | 256 | 0 |
| C | 0 | 256 | 0 |
| D | 0 | 256 | 0 |
| Quadrant | Total seconds | Saturated seconds | Saturation percentage |
|---|---|---|---|
| A | 12549 | 132 | 1.051877% |
| B | 12550 | 170 | 1.354582% |
| C | 12550 | 180 | 1.434263% |
| D | 12549 | 2935 | 23.388318% |
Noise dominated data is calculated using 1-second bins in cleaned event files. If a bin has >2000 counts, and if more than 50% of those come from <1% of pixels, then it is considered to be noise-dominated and hence unusable.
| Quadrant | # 1 sec bins | Bins with >0 counts | Bins with >2000 counts | High rate bins dominated by noise | Noise dominated (total time) | Noise dominated (detector-on time) | Marked lightcurve |
|---|---|---|---|---|---|---|---|
| A | 13784 | 12549 | 36 | 36 | 0.26% | 0.29% | 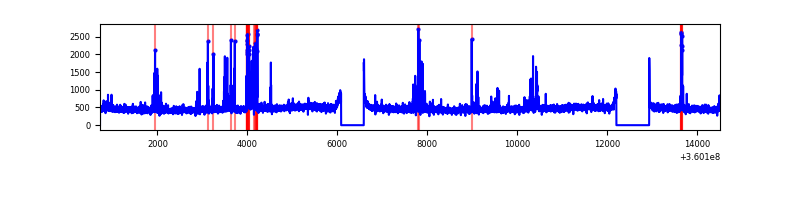 |
| B | 13785 | 12551 | 10 | 10 | 0.07% | 0.08% | 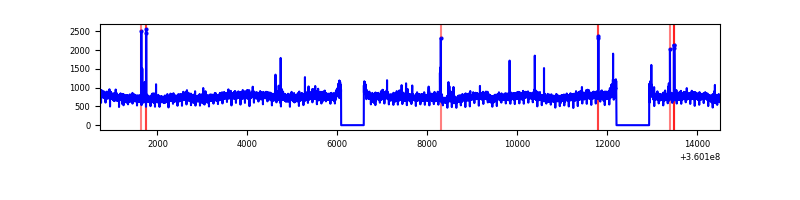 |
| C | 13785 | 12552 | 2 | 2 | 0.01% | 0.02% | 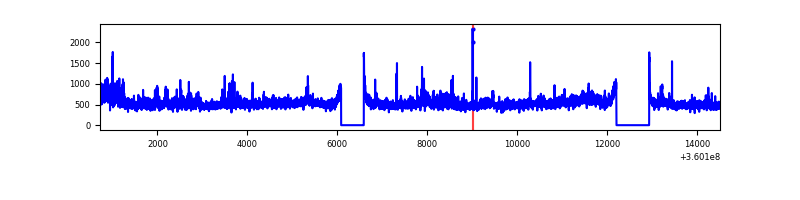 |
| D | 13784 | 12551 | 3054 | 3054 | 22.16% | 24.33% | 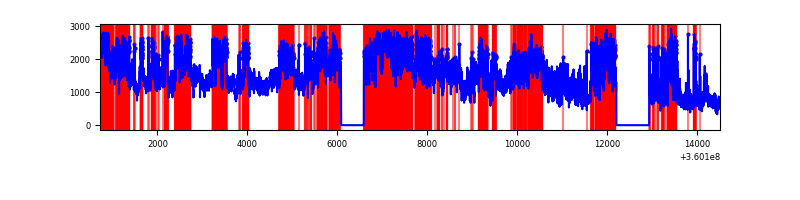 |
Top three noisy pixels from each quadrant. If the there are fewer than three noisy pixels in the level2.evt file, extra rows are filled as -1
| Pixel properties | Quadrant properties | ||||||
|---|---|---|---|---|---|---|---|
| Quadrant | DetID | PixID | Counts | Sigma | Mean | Median | Sigma |
| A | 0 | 13 | 401626 | 1344.36 | 1492 | 1462 | 297.7 |
| A | 13 | 254 | 23405 | 73.72 | 1492 | 1462 | 297.7 |
| A | 8 | 192 | 22672 | 71.26 | 1492 | 1462 | 297.7 |
| B | 6 | 159 | 3601922 | 12967.89 | 1471 | 1432 | 277.6 |
| B | 12 | 111 | 34926 | 120.63 | 1471 | 1432 | 277.6 |
| B | 11 | 111 | 32135 | 110.58 | 1471 | 1432 | 277.6 |
| C | 3 | 233 | 939404 | 2834.16 | 1424 | 1431 | 331.0 |
| C | 14 | 238 | 233161 | 700.19 | 1424 | 1431 | 331.0 |
| C | 2 | 114 | 29347 | 84.35 | 1424 | 1431 | 331.0 |
| D | 8 | 195 | 9736320 | 30852.02 | 1347 | 1308 | 315.5 |
| D | 12 | 227 | 1730784 | 5481.02 | 1347 | 1308 | 315.5 |
| D | 12 | 79 | 1424026 | 4508.85 | 1347 | 1308 | 315.5 |
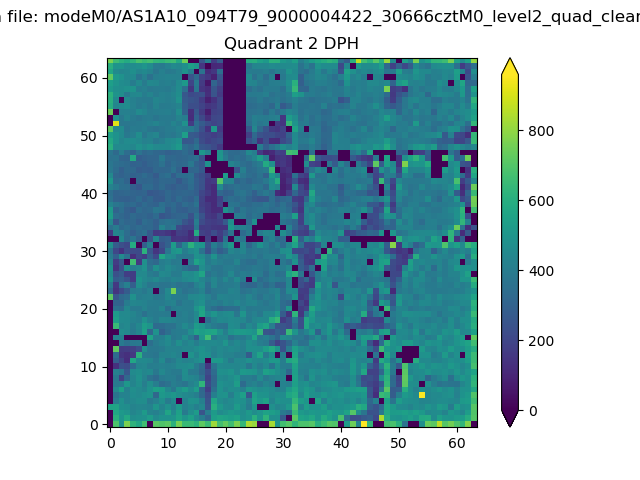
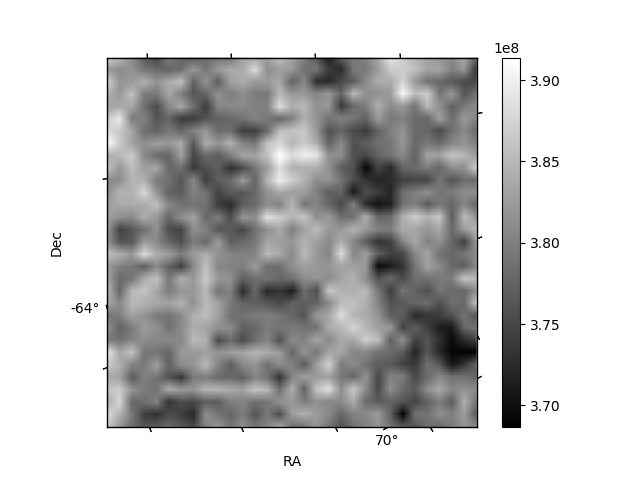
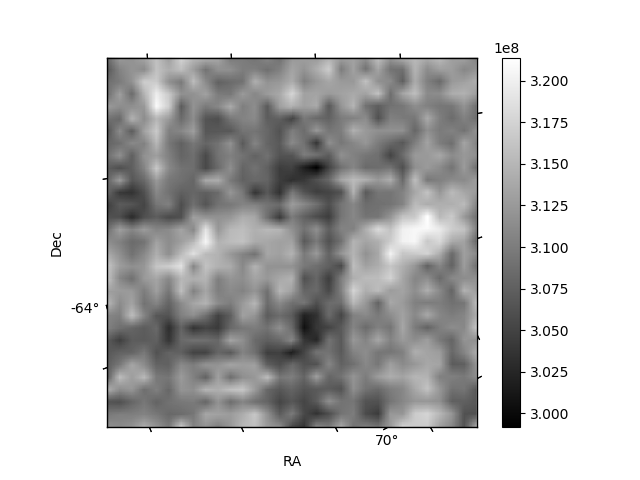
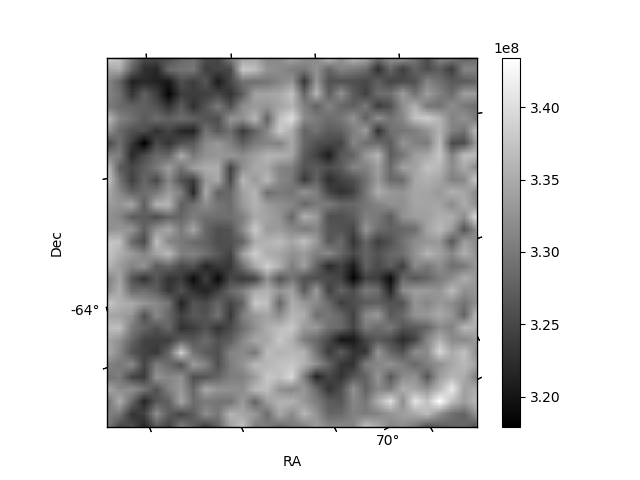
Histogram calculated using DETX and DETY for each event in the final _common_clean file
| Quadrant A | 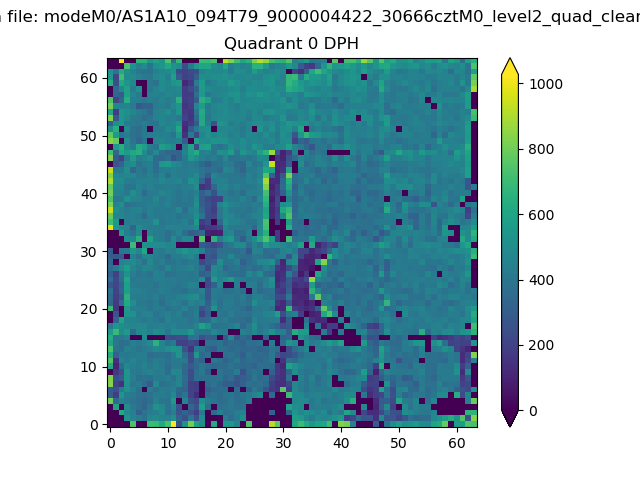 |
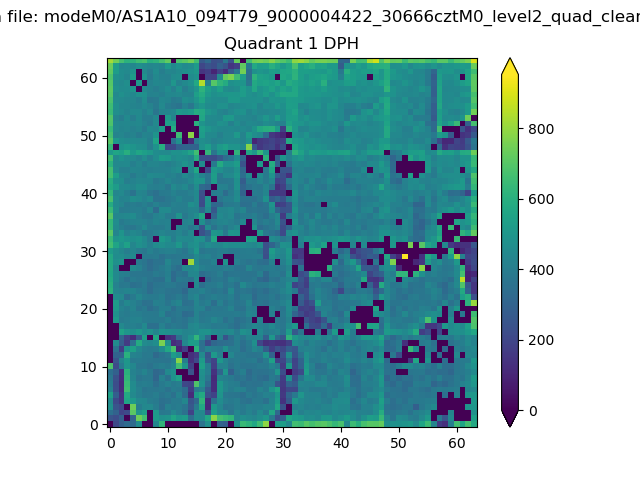 |
Quadrant B |
|---|---|---|---|
| Quadrant D | 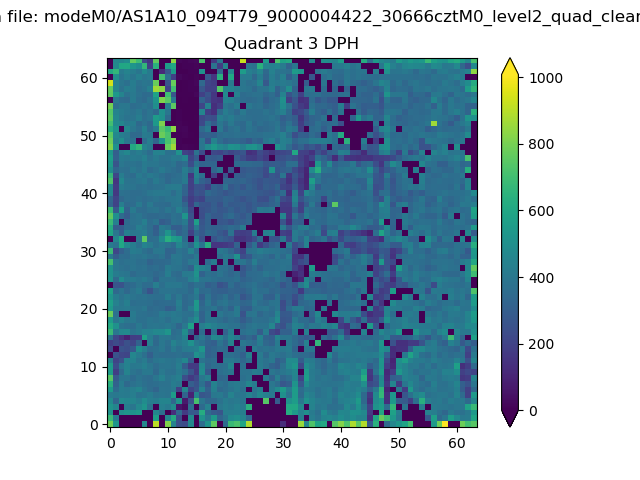 |
 |
Quadrant C |
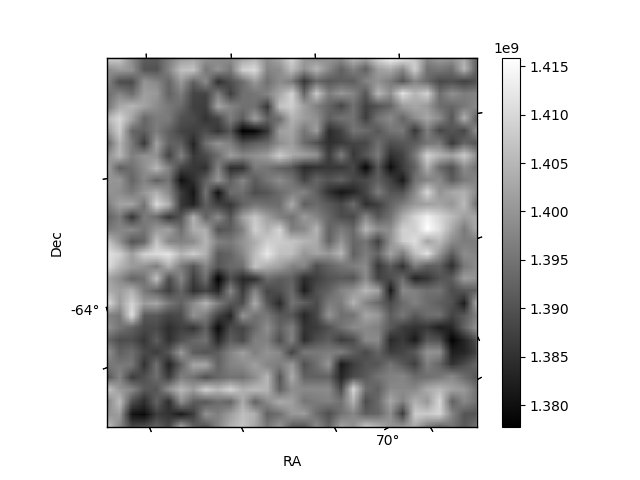
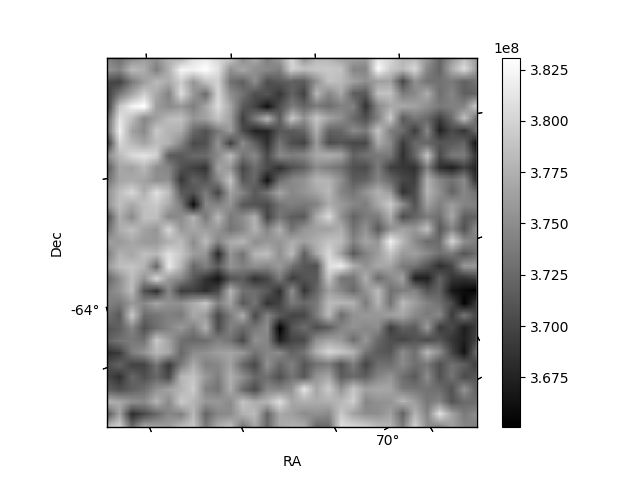
| Plot type | Count rate plots | Images |
|---|---|---|
| Comparison with Poisson distribution Blue bars denote a histogram of data divided into 1 sec bins. Red curve is a Poisson curve with rate = median count rate of data. |
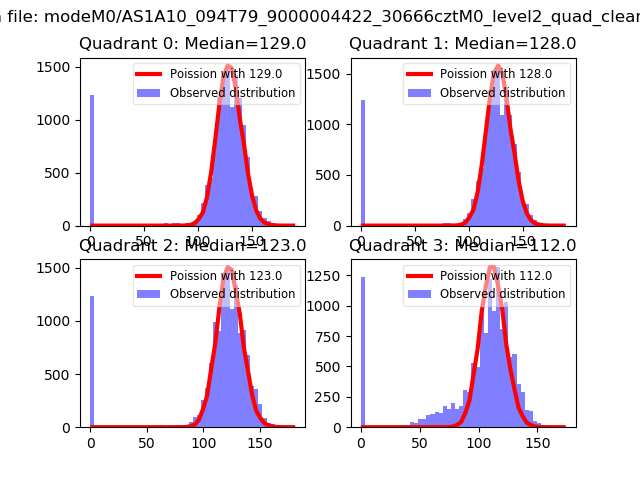 |
 |
| Quadrant-wise count rates Data is divided into 100 sec bins |
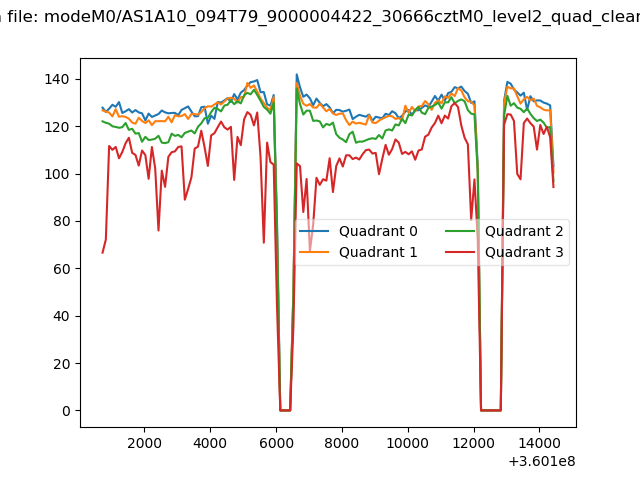 |
|
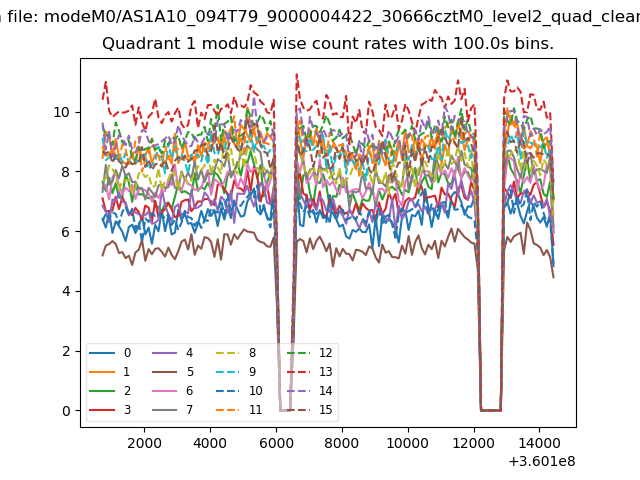
| Module-wise count rates for Quadrant A Data is divided into 100 sec bins |
 |
 |
| Module-wise count rates for Quadrant B Data is divided into 100 sec bins |
 |
 |
| Module-wise count rates for Quadrant C Data is divided into 100 sec bins |
 |
 |
| Module-wise count rates for Quadrant D Data is divided into 100 sec bins |
 |
 |
| Parameter | Plot |
|---|---|
| CZT HV Monitor | 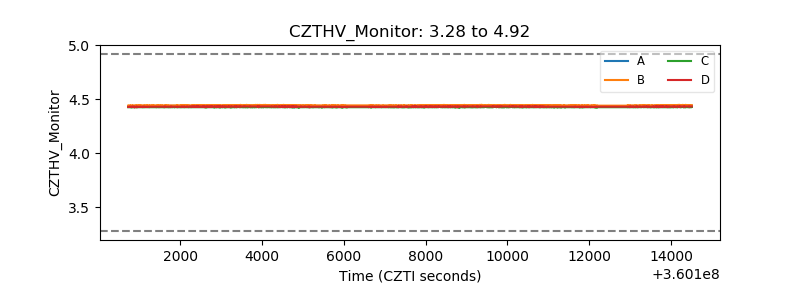 |
| D_VDD | 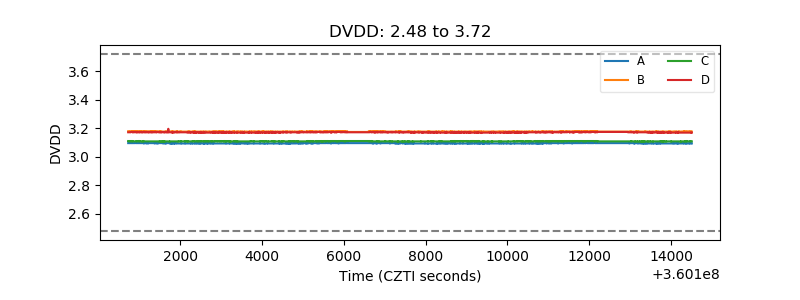 |
| Temperature 1 | 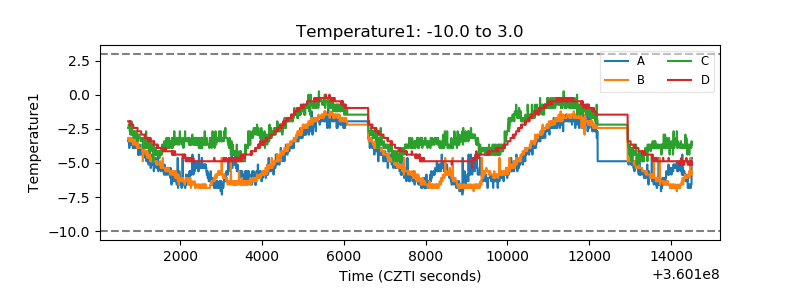 |
| Veto HV Monitor | 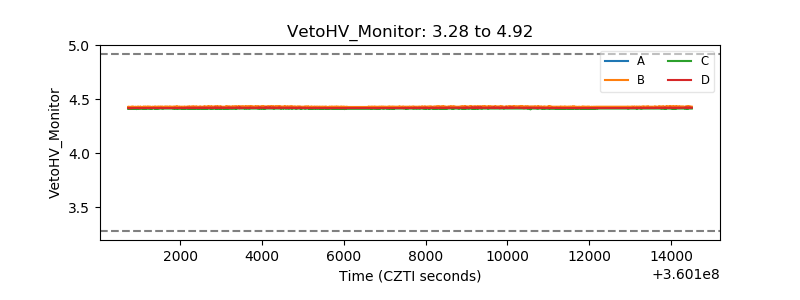 |
| Veto LLD | 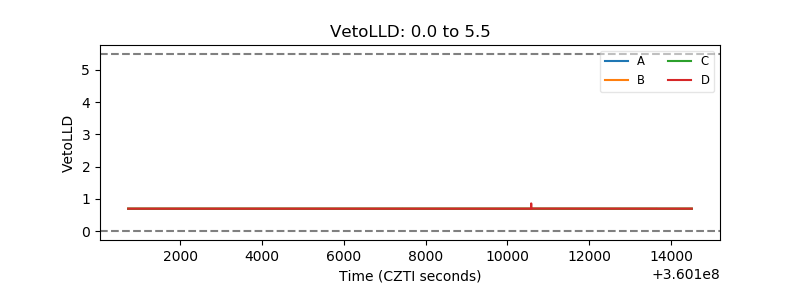 |
| Alpha Counter | 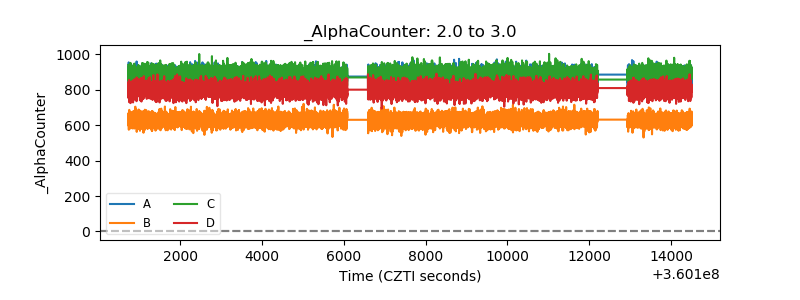 |
| _CPM_Rate | 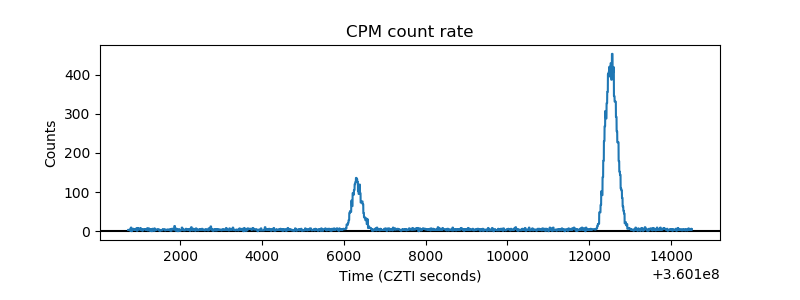 |
| CZT Counter | 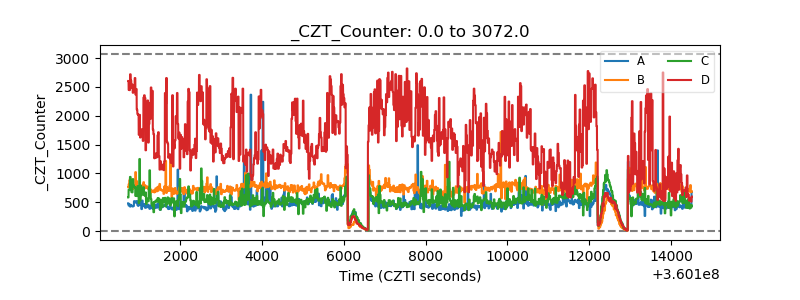 |
| +2.5 Volts monitor |  |
| +5 Volts monitor |  |
| _ROLL_ROT | 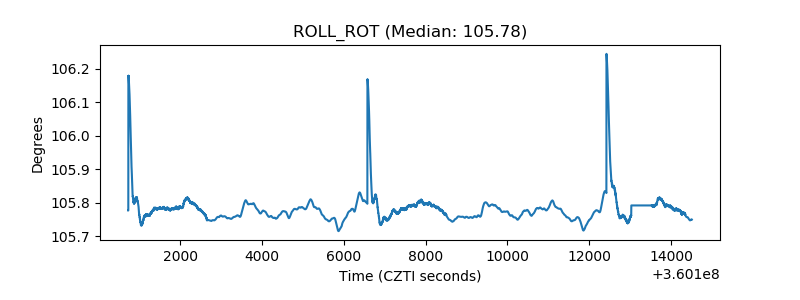 |
| _Roll_DEC |  |
| _Roll_RA | 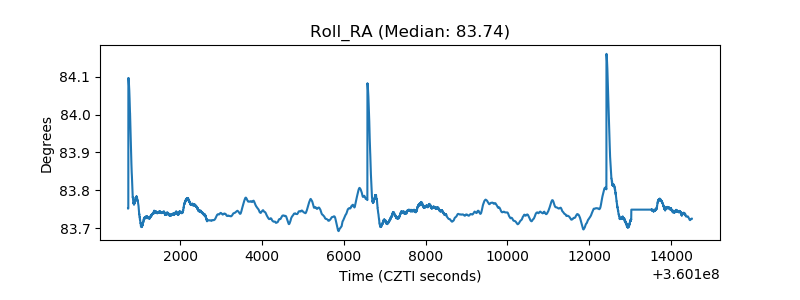 |
| Veto Counter |  |