| Param | Original file | Final file |
|---|---|---|
| Filename | modeM0/AS1A10_094T79_9000004422_30667cztM0_level2.evt | modeM0/AS1A10_094T79_9000004422_30667cztM0_level2_quad_clean.evt |
| Size (bytes) | 639,970,560 | 125,501,760 |
| Size | 610.3 MB | 119.7 MB |
| Events in quadrant A | 3,186,427 | 876,004 |
| Events in quadrant B | 5,033,194 | 868,657 |
| Events in quadrant C | 3,358,086 | 832,826 |
| Events in quadrant D | 7,356,031 | 761,574 |
| Mode M9 | |||
|---|---|---|---|
| Quadrant | BADHDUFLAG | Total packets | Discarded packets |
| A | 0 | 9 | 0 |
| B | 0 | 9 | 0 |
| C | 0 | 9 | 0 |
| D | 0 | 9 | 0 |
| Mode M0 | |||
|---|---|---|---|
| Quadrant | BADHDUFLAG | Total packets | Discarded packets |
| A | 0 | 13716 | 1 |
| B | 0 | 19929 | 1 |
| C | 0 | 13815 | 1 |
| D | 0 | 26422 | 1 |
| Mode SS | |||
|---|---|---|---|
| Quadrant | BADHDUFLAG | Total packets | Discarded packets |
| A | 0 | 134 | 0 |
| B | 0 | 134 | 0 |
| C | 0 | 134 | 0 |
| D | 0 | 134 | 0 |
| Quadrant | Total seconds | Saturated seconds | Saturation percentage |
|---|---|---|---|
| A | 6621 | 37 | 0.558828% |
| B | 6622 | 59 | 0.890969% |
| C | 6622 | 74 | 1.117487% |
| D | 6622 | 1231 | 18.589550% |
Noise dominated data is calculated using 1-second bins in cleaned event files. If a bin has >2000 counts, and if more than 50% of those come from <1% of pixels, then it is considered to be noise-dominated and hence unusable.
| Quadrant | # 1 sec bins | Bins with >0 counts | Bins with >2000 counts | High rate bins dominated by noise | Noise dominated (total time) | Noise dominated (detector-on time) | Marked lightcurve |
|---|---|---|---|---|---|---|---|
| A | 7516 | 6621 | 10 | 10 | 0.13% | 0.15% | 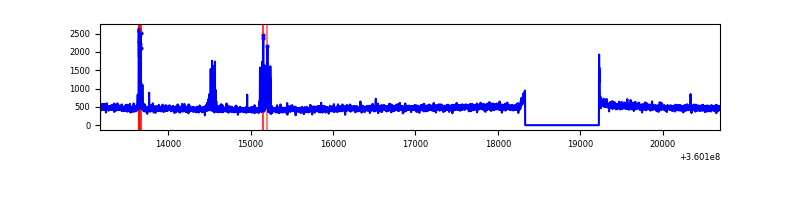 |
| B | 7517 | 6622 | 4 | 4 | 0.05% | 0.06% | 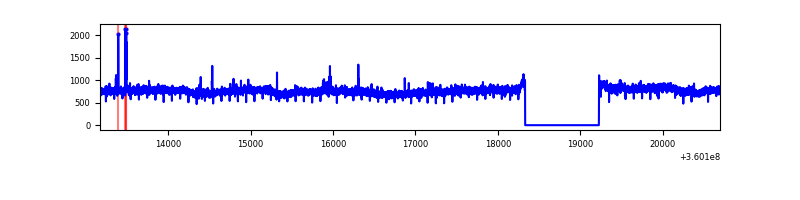 |
| C | 7517 | 6622 | 0 | 0 | 0.00% | 0.00% | 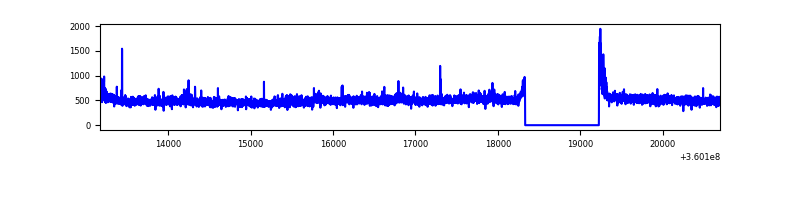 |
| D | 7517 | 6623 | 1256 | 1256 | 16.71% | 18.96% | 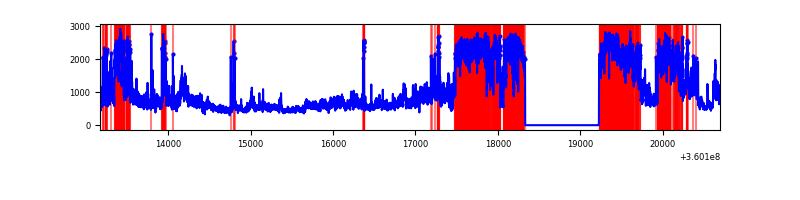 |
Top three noisy pixels from each quadrant. If the there are fewer than three noisy pixels in the level2.evt file, extra rows are filled as -1
| Pixel properties | Quadrant properties | ||||||
|---|---|---|---|---|---|---|---|
| Quadrant | DetID | PixID | Counts | Sigma | Mean | Median | Sigma |
| A | 0 | 13 | 115471 | 721.24 | 793 | 775 | 159.0 |
| A | 13 | 254 | 12097 | 71.2 | 793 | 775 | 159.0 |
| A | 8 | 192 | 10102 | 58.65 | 793 | 775 | 159.0 |
| B | 6 | 159 | 1906495 | 12758.12 | 786 | 766 | 149.4 |
| B | 12 | 111 | 18811 | 120.8 | 786 | 766 | 149.4 |
| B | 11 | 111 | 16940 | 108.28 | 786 | 766 | 149.4 |
| C | 3 | 233 | 187885 | 1053.96 | 762 | 767 | 177.5 |
| C | 14 | 238 | 124714 | 698.14 | 762 | 767 | 177.5 |
| C | 0 | 10 | 33002 | 181.57 | 762 | 767 | 177.5 |
| D | 8 | 195 | 2192397 | 12766.57 | 728 | 710 | 171.7 |
| D | 12 | 227 | 1579258 | 9195.04 | 728 | 710 | 171.7 |
| D | 2 | 250 | 334879 | 1946.53 | 728 | 710 | 171.7 |
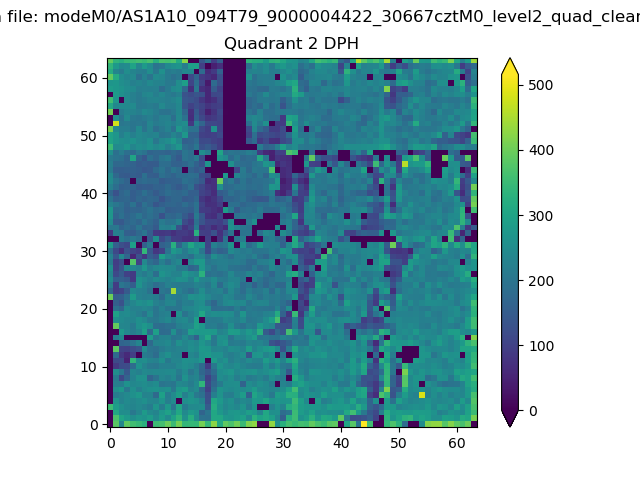
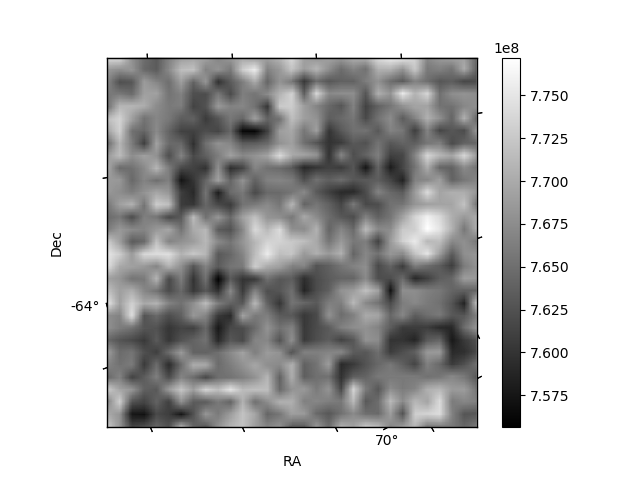
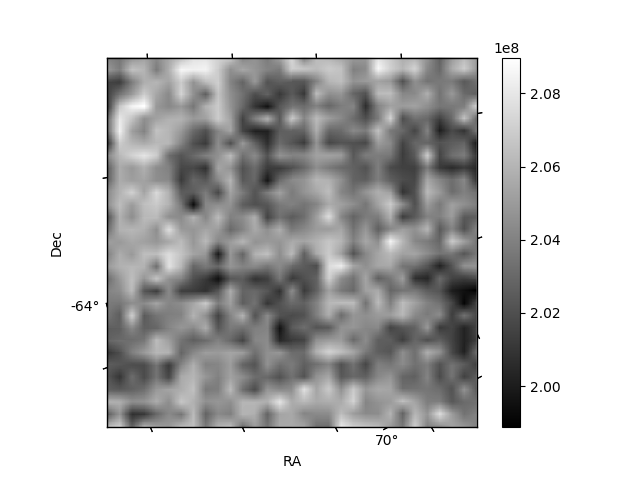
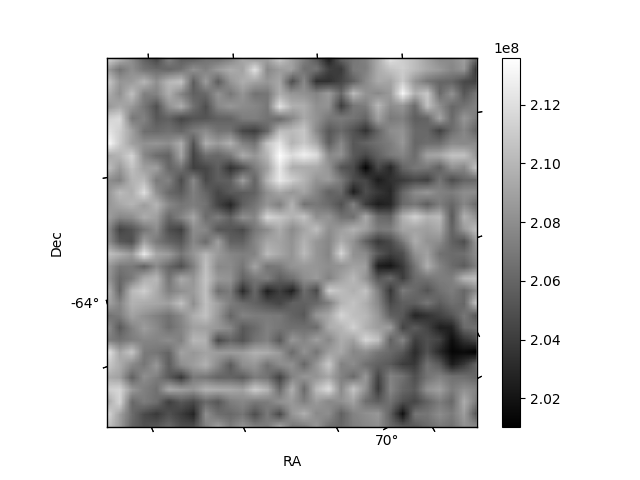
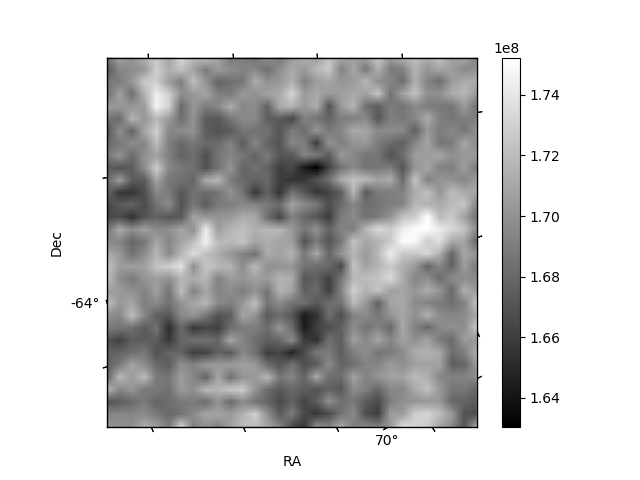
Histogram calculated using DETX and DETY for each event in the final _common_clean file
| Quadrant A | 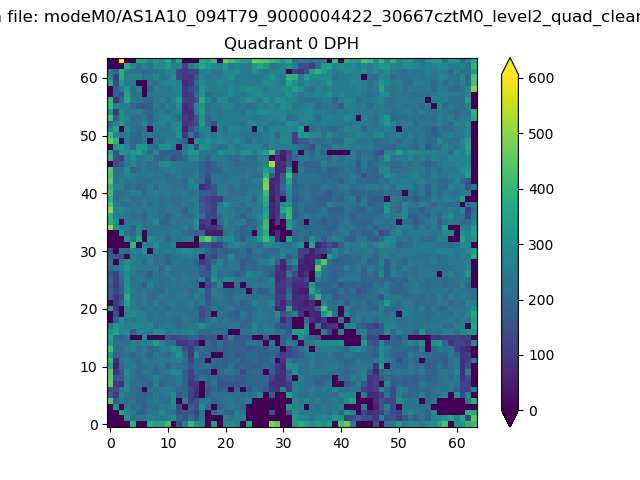 |
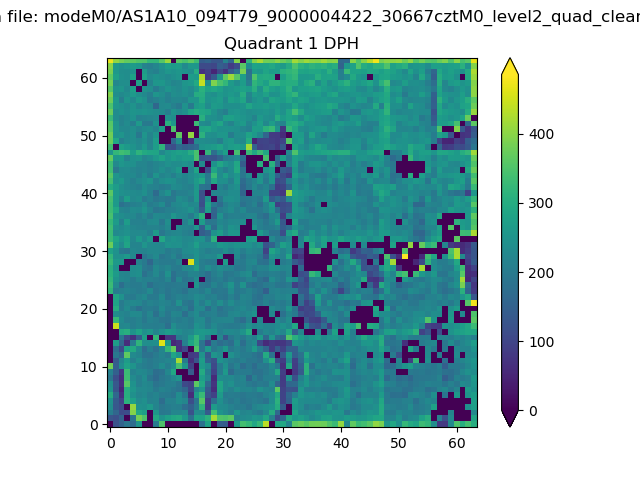 |
Quadrant B |
|---|---|---|---|
| Quadrant D | 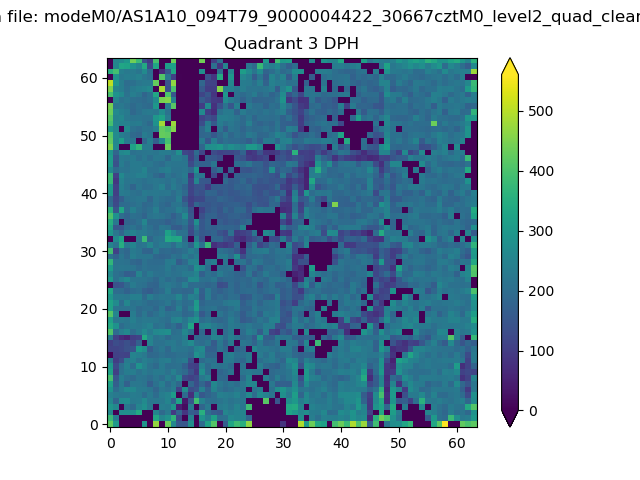 |
 |
Quadrant C |
| Plot type | Count rate plots | Images |
|---|---|---|
| Comparison with Poisson distribution Blue bars denote a histogram of data divided into 1 sec bins. Red curve is a Poisson curve with rate = median count rate of data. |
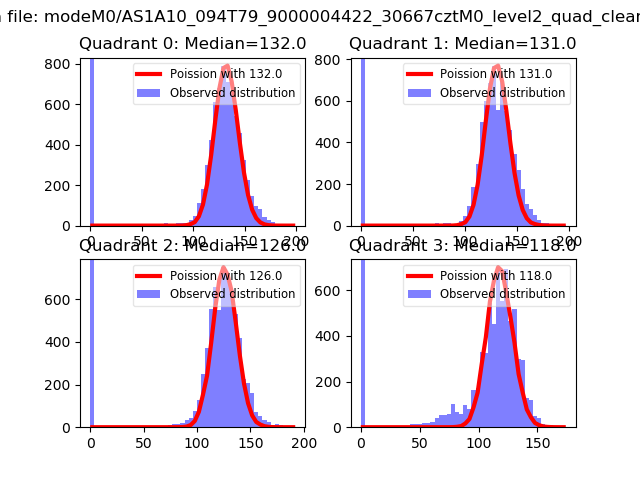 |
 |
| Quadrant-wise count rates Data is divided into 100 sec bins |
 |
|
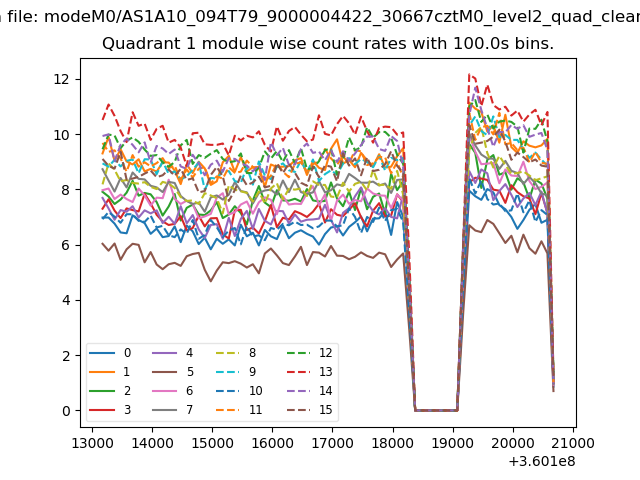
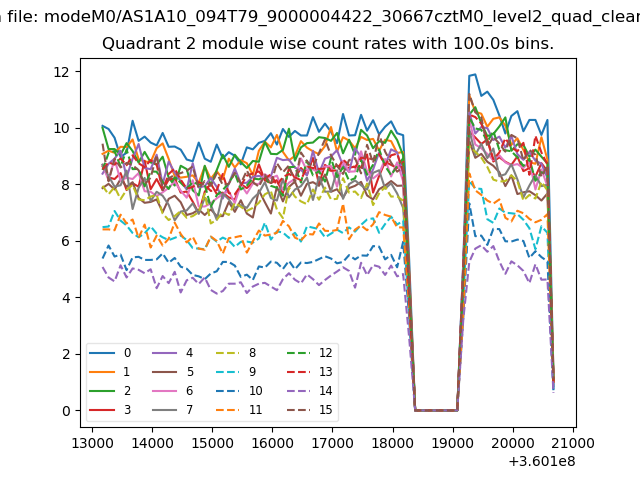
| Module-wise count rates for Quadrant A Data is divided into 100 sec bins |
 |
 |
| Module-wise count rates for Quadrant B Data is divided into 100 sec bins |
 |
 |
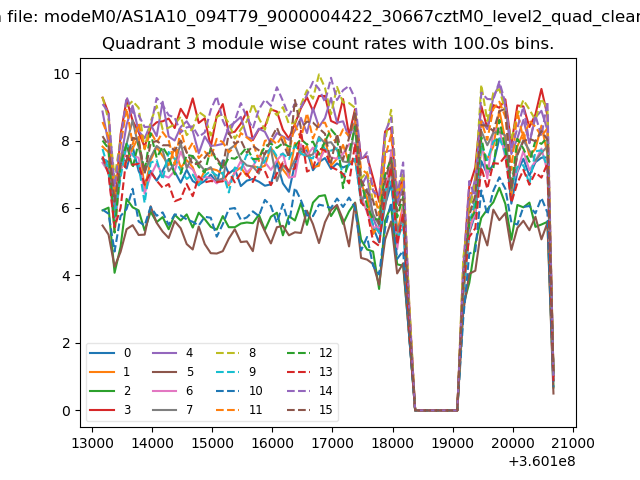
| Module-wise count rates for Quadrant C Data is divided into 100 sec bins |
 |
 |
| Module-wise count rates for Quadrant D Data is divided into 100 sec bins |
 |
 |
| Parameter | Plot |
|---|---|
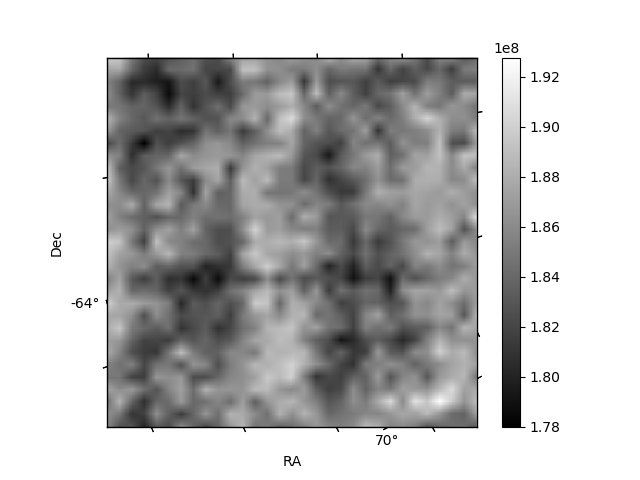
| CZT HV Monitor |  |
| D_VDD | 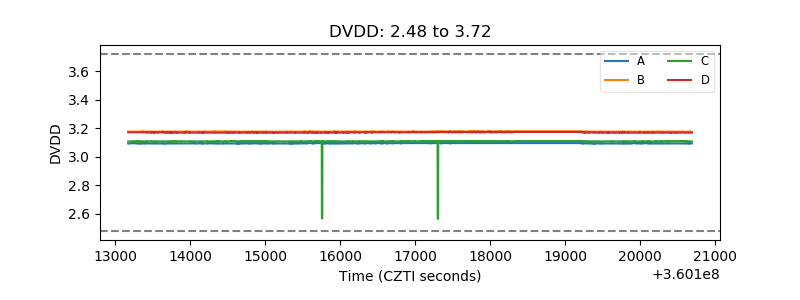 |
| Temperature 1 | 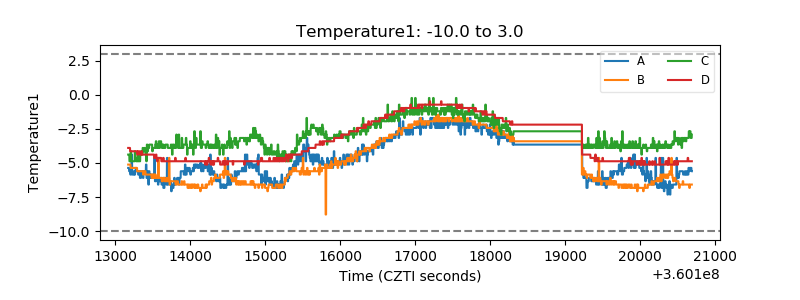 |
| Veto HV Monitor |  |
| Veto LLD | 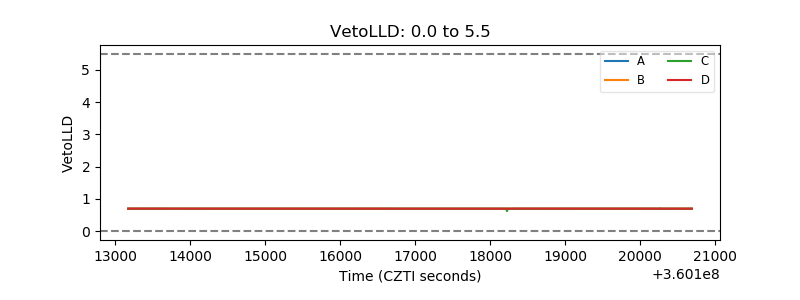 |
| Alpha Counter | 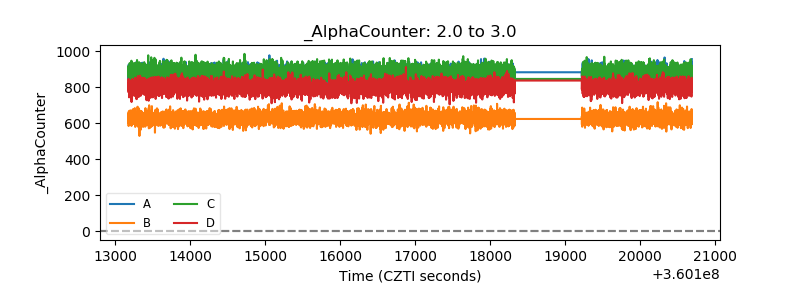 |
| _CPM_Rate | 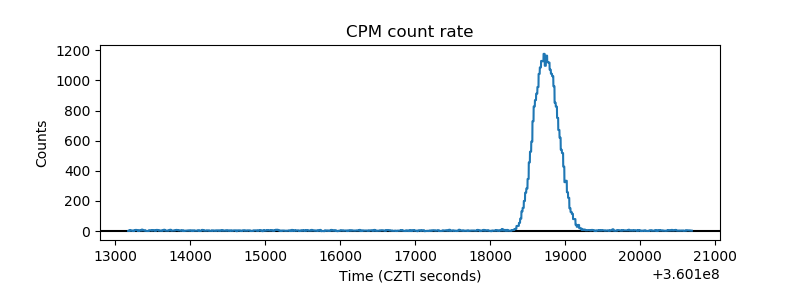 |
| CZT Counter | 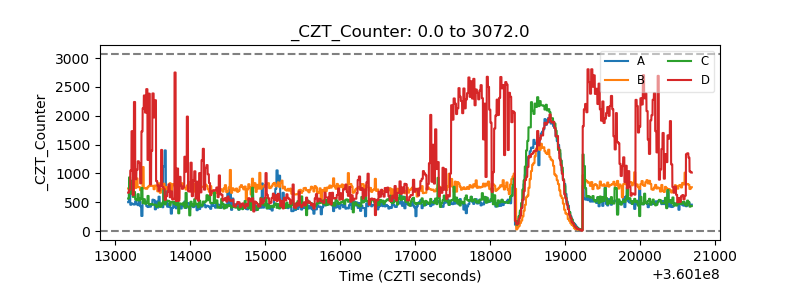 |
| +2.5 Volts monitor |  |
| +5 Volts monitor |  |
| _ROLL_ROT | 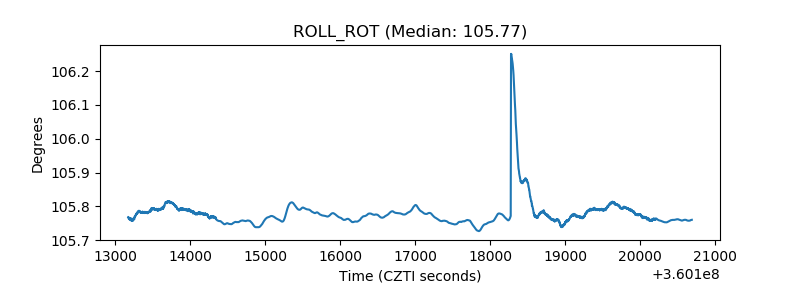 |
| _Roll_DEC | 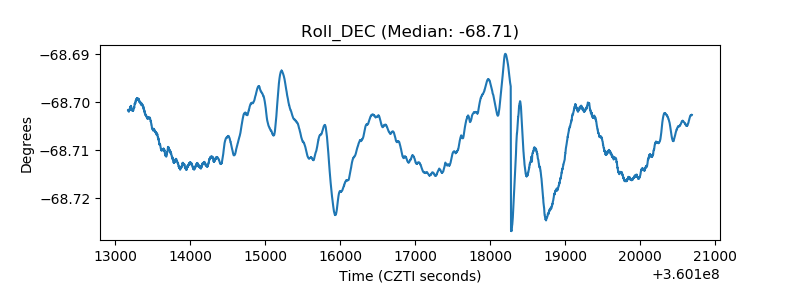 |
| _Roll_RA | 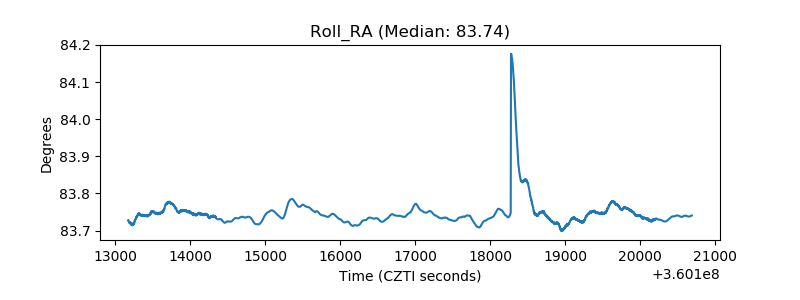 |
| Veto Counter | 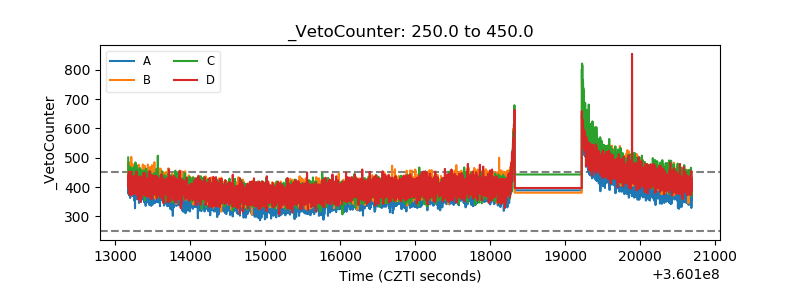 |