| Param | Original file | Final file |
|---|---|---|
| Filename | modeM0/AS1A10_094T79_9000004422_30668cztM0_level2.evt | modeM0/AS1A10_094T79_9000004422_30668cztM0_level2_quad_clean.evt |
| Size (bytes) | 692,084,160 | 133,171,200 |
| Size | 660.0 MB | 127.0 MB |
| Events in quadrant A | 3,473,664 | 926,397 |
| Events in quadrant B | 5,164,989 | 927,700 |
| Events in quadrant C | 3,446,157 | 896,099 |
| Events in quadrant D | 8,424,252 | 817,379 |
| Mode M9 | |||
|---|---|---|---|
| Quadrant | BADHDUFLAG | Total packets | Discarded packets |
| A | 0 | 19 | 0 |
| B | 0 | 19 | 0 |
| C | 0 | 19 | 0 |
| D | 0 | 19 | 0 |
| Mode M0 | |||
|---|---|---|---|
| Quadrant | BADHDUFLAG | Total packets | Discarded packets |
| A | 0 | 14605 | 2 |
| B | 0 | 20184 | 2 |
| C | 0 | 14350 | 2 |
| D | 0 | 29577 | 3 |
| Mode SS | |||
|---|---|---|---|
| Quadrant | BADHDUFLAG | Total packets | Discarded packets |
| A | 0 | 138 | 0 |
| B | 0 | 138 | 0 |
| C | 0 | 138 | 0 |
| D | 0 | 138 | 0 |
| Quadrant | Total seconds | Saturated seconds | Saturation percentage |
|---|---|---|---|
| A | 6677 | 106 | 1.587539% |
| B | 6678 | 108 | 1.617251% |
| C | 6678 | 145 | 2.171309% |
| D | 6677 | 1065 | 15.950277% |
Noise dominated data is calculated using 1-second bins in cleaned event files. If a bin has >2000 counts, and if more than 50% of those come from <1% of pixels, then it is considered to be noise-dominated and hence unusable.
| Quadrant | # 1 sec bins | Bins with >0 counts | Bins with >2000 counts | High rate bins dominated by noise | Noise dominated (total time) | Noise dominated (detector-on time) | Marked lightcurve |
|---|---|---|---|---|---|---|---|
| A | 8607 | 6677 | 28 | 28 | 0.33% | 0.42% | 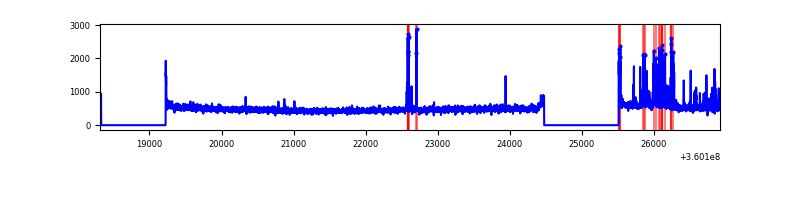 |
| B | 8608 | 6678 | 4 | 4 | 0.05% | 0.06% | 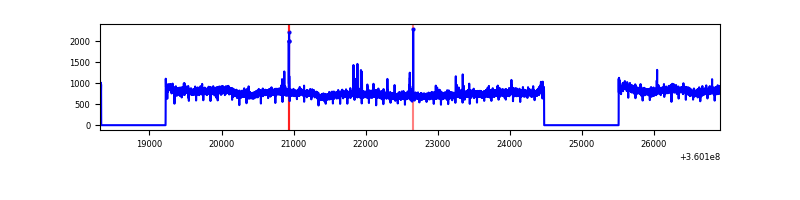 |
| C | 8608 | 6678 | 0 | 0 | 0.00% | 0.00% | 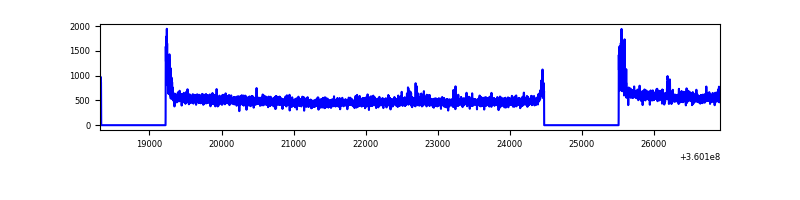 |
| D | 8607 | 6679 | 1024 | 1024 | 11.90% | 15.33% | 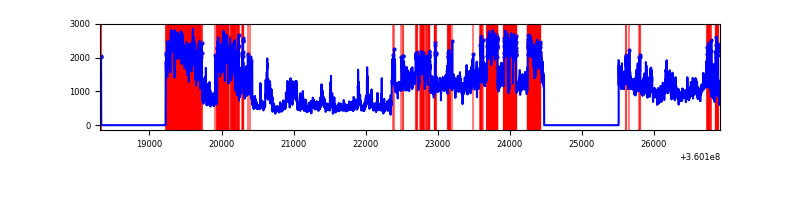 |
Top three noisy pixels from each quadrant. If the there are fewer than three noisy pixels in the level2.evt file, extra rows are filled as -1
| Pixel properties | Quadrant properties | ||||||
|---|---|---|---|---|---|---|---|
| Quadrant | DetID | PixID | Counts | Sigma | Mean | Median | Sigma |
| A | 0 | 13 | 213753 | 1273.61 | 832 | 815 | 167.2 |
| A | 12 | 96 | 30531 | 177.74 | 832 | 815 | 167.2 |
| A | 8 | 192 | 20477 | 117.6 | 832 | 815 | 167.2 |
| B | 6 | 159 | 1881705 | 12211.97 | 826 | 805 | 154.0 |
| B | 0 | 190 | 19114 | 118.87 | 826 | 805 | 154.0 |
| B | 12 | 111 | 18952 | 117.82 | 826 | 805 | 154.0 |
| C | 14 | 238 | 131738 | 700.24 | 806 | 812 | 187.0 |
| C | 3 | 233 | 87686 | 464.64 | 806 | 812 | 187.0 |
| C | 0 | 10 | 64017 | 338.05 | 806 | 812 | 187.0 |
| D | 8 | 195 | 3312601 | 18207.38 | 779 | 758 | 181.9 |
| D | 12 | 227 | 1915011 | 10523.91 | 779 | 758 | 181.9 |
| D | 12 | 218 | 85067 | 463.5 | 779 | 758 | 181.9 |
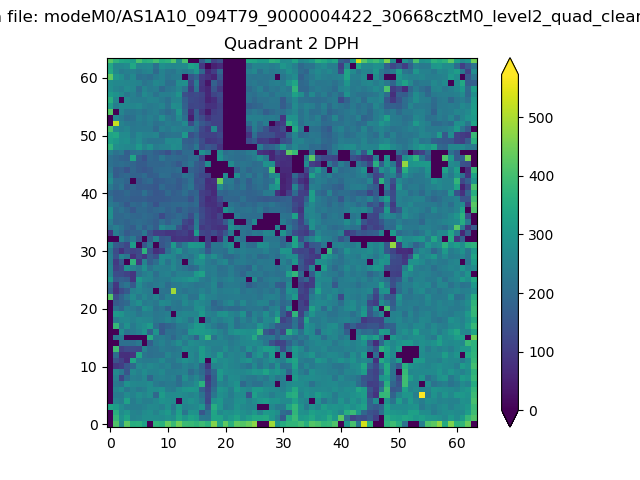
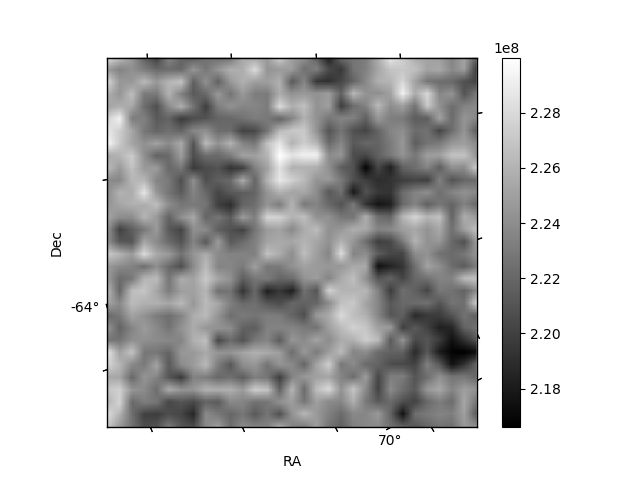
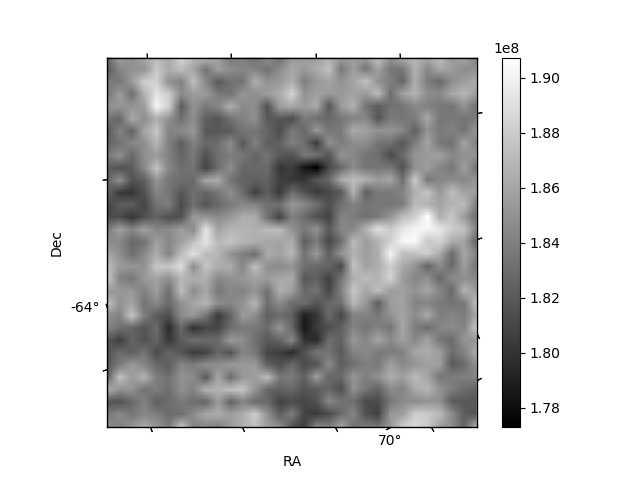
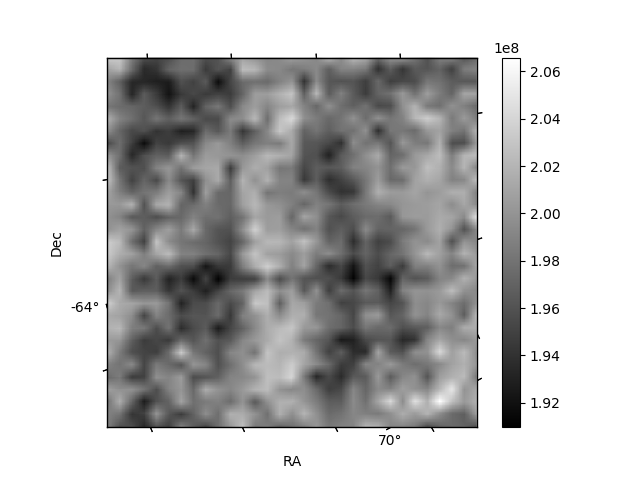
Histogram calculated using DETX and DETY for each event in the final _common_clean file
| Quadrant A | 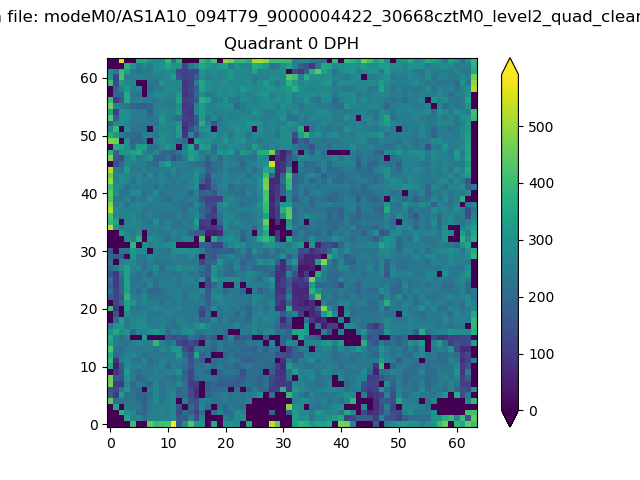 |
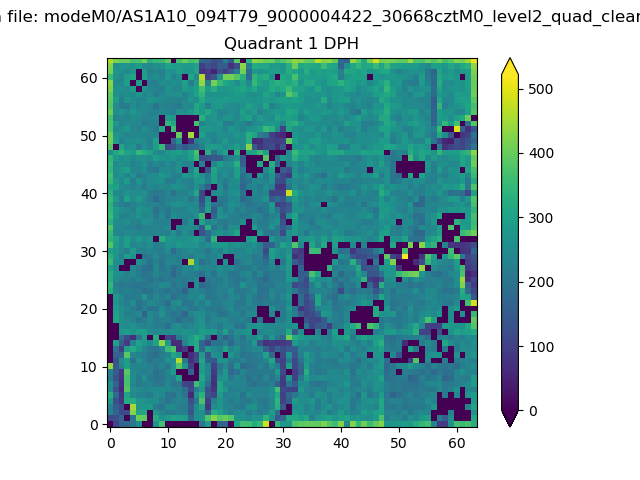 |
Quadrant B |
|---|---|---|---|
| Quadrant D | 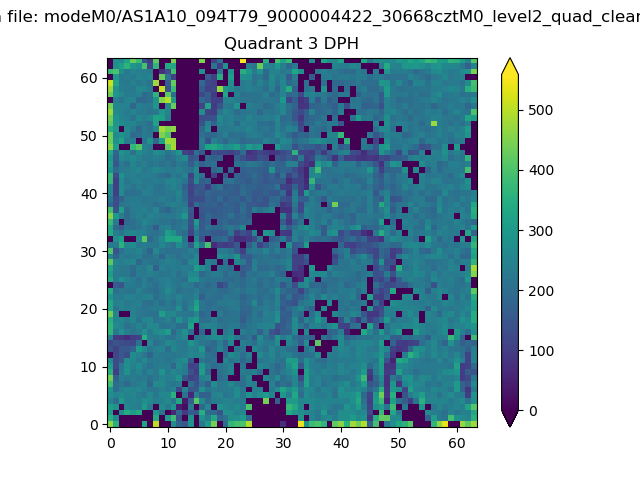 |
 |
Quadrant C |
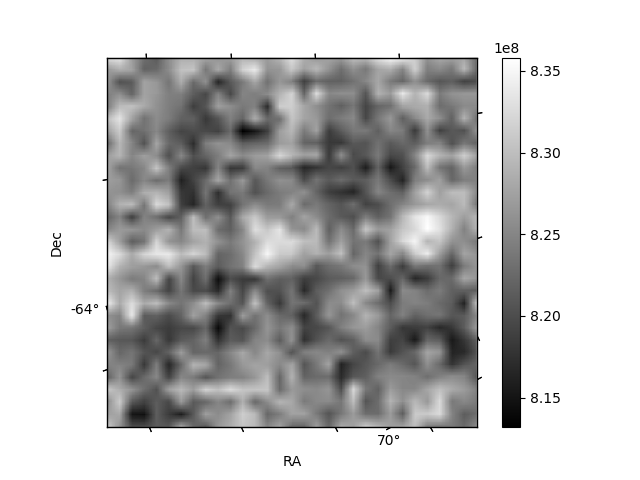
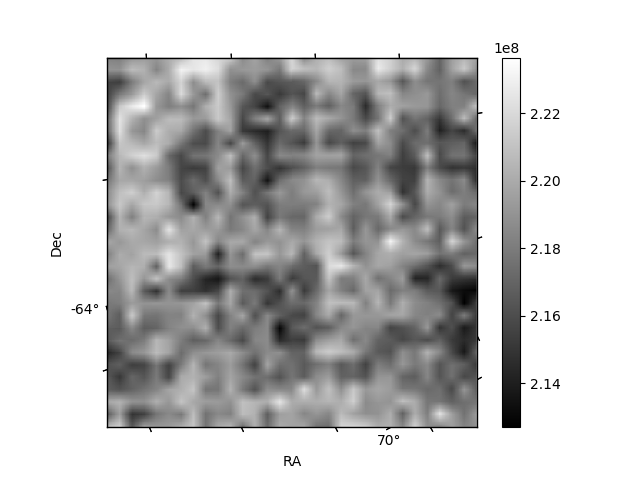
| Plot type | Count rate plots | Images |
|---|---|---|
| Comparison with Poisson distribution Blue bars denote a histogram of data divided into 1 sec bins. Red curve is a Poisson curve with rate = median count rate of data. |
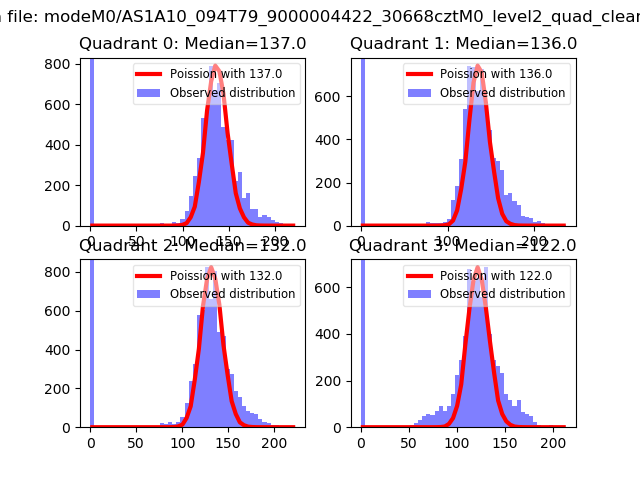 |
 |
| Quadrant-wise count rates Data is divided into 100 sec bins |
 |
|
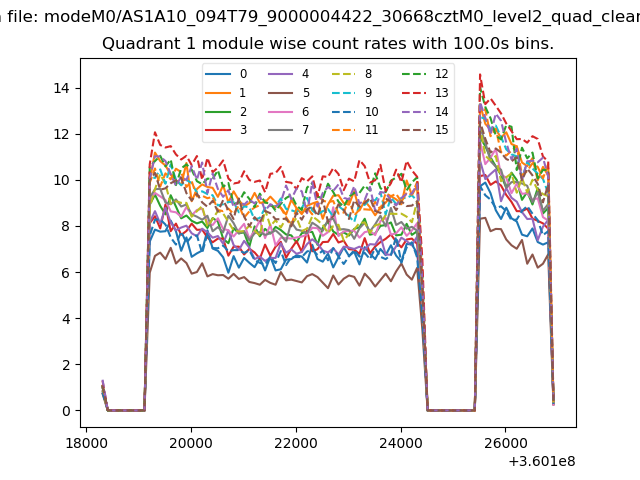
| Module-wise count rates for Quadrant A Data is divided into 100 sec bins |
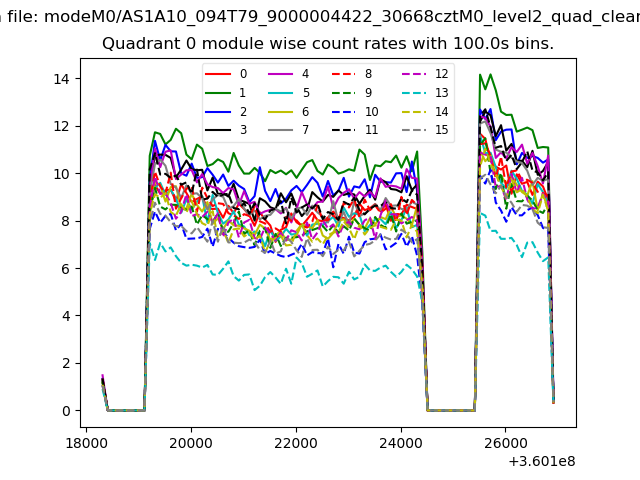 |
 |
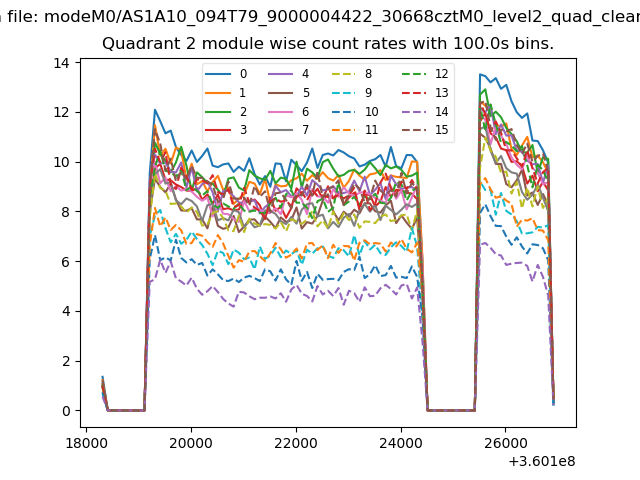
| Module-wise count rates for Quadrant B Data is divided into 100 sec bins |
 |
 |
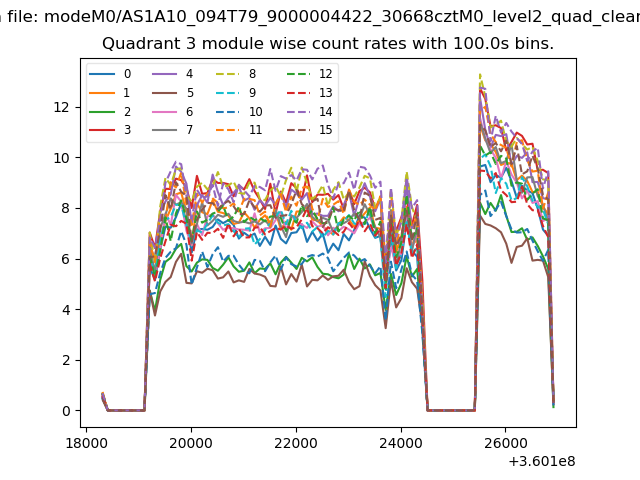
| Module-wise count rates for Quadrant C Data is divided into 100 sec bins |
 |
 |
| Module-wise count rates for Quadrant D Data is divided into 100 sec bins |
 |
 |
| Parameter | Plot |
|---|---|
| CZT HV Monitor | 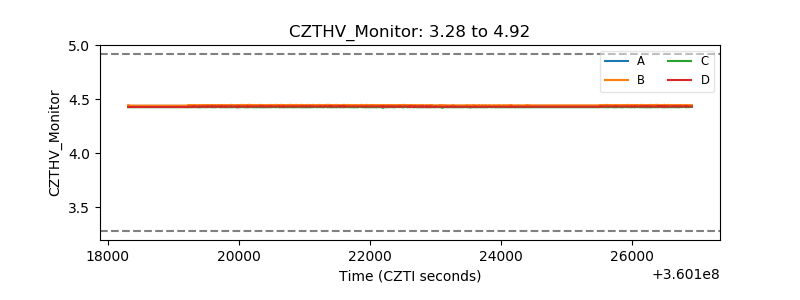 |
| D_VDD | 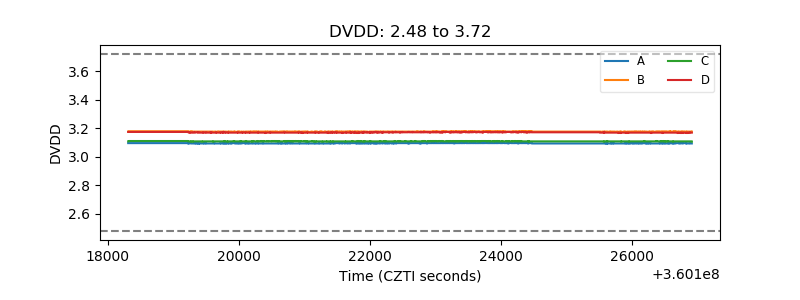 |
| Temperature 1 | 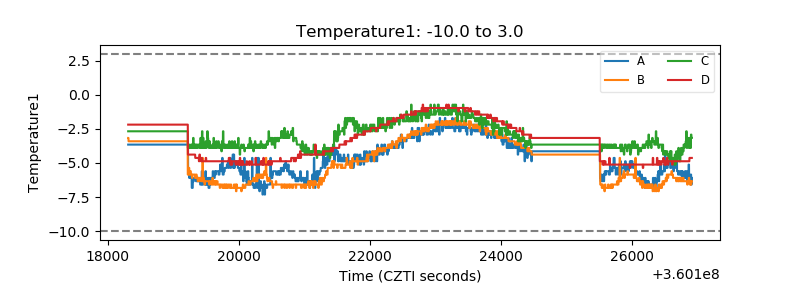 |
| Veto HV Monitor | 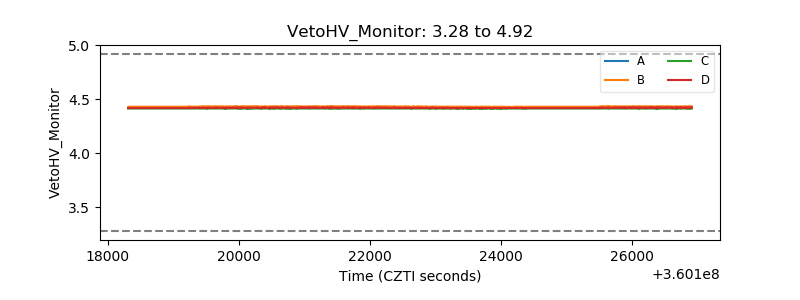 |
| Veto LLD | 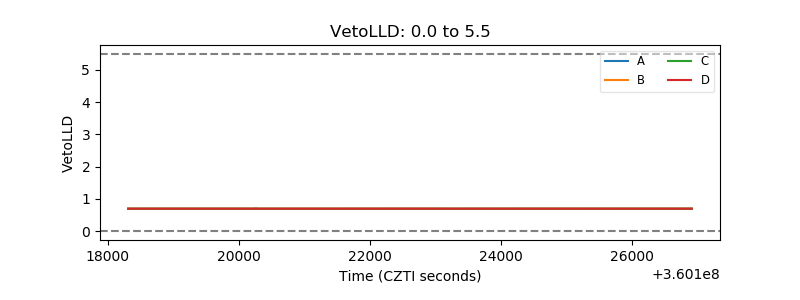 |
| Alpha Counter | 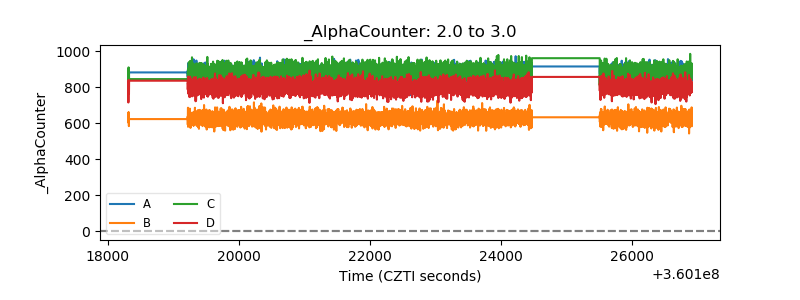 |
| _CPM_Rate | 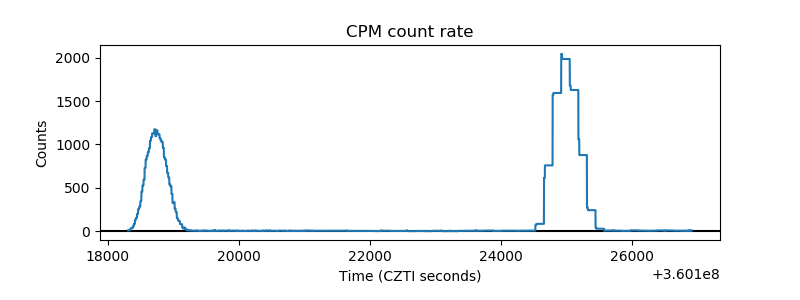 |
| CZT Counter | 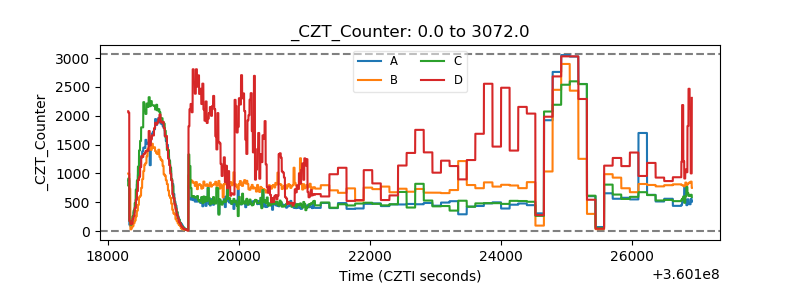 |
| +2.5 Volts monitor |  |
| +5 Volts monitor |  |
| _ROLL_ROT | 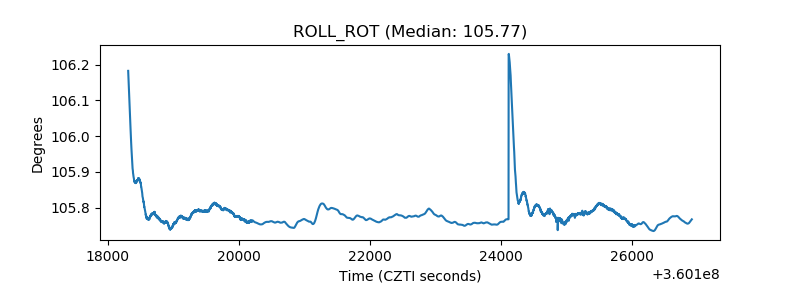 |
| _Roll_DEC | 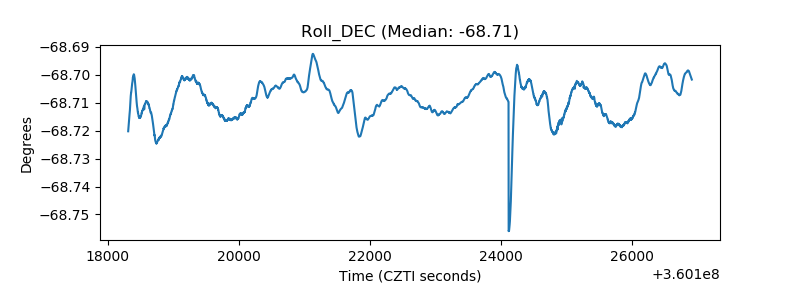 |
| _Roll_RA | 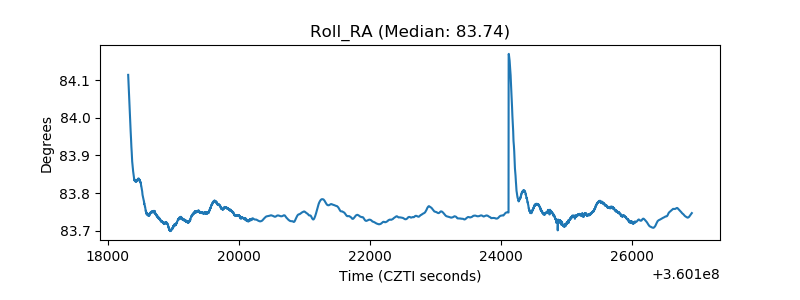 |
| Veto Counter | 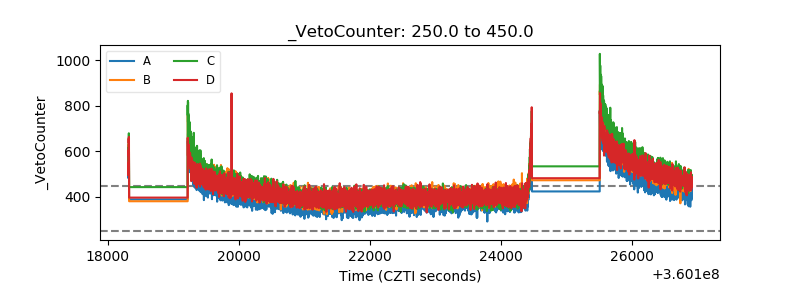 |