| Param | Original file | Final file |
|---|---|---|
| Filename | modeM0/AS1A10_094T79_9000004422_30670cztM0_level2.evt | modeM0/AS1A10_094T79_9000004422_30670cztM0_level2_quad_clean.evt |
| Size (bytes) | 656,121,600 | 121,089,600 |
| Size | 625.7 MB | 115.5 MB |
| Events in quadrant A | 3,044,420 | 849,992 |
| Events in quadrant B | 4,496,418 | 850,901 |
| Events in quadrant C | 3,094,714 | 825,038 |
| Events in quadrant D | 8,847,492 | 739,229 |
| Mode M9 | |||
|---|---|---|---|
| Quadrant | BADHDUFLAG | Total packets | Discarded packets |
| A | 0 | 12 | 0 |
| B | 0 | 12 | 0 |
| C | 0 | 12 | 0 |
| D | 0 | 12 | 0 |
| Mode M0 | |||
|---|---|---|---|
| Quadrant | BADHDUFLAG | Total packets | Discarded packets |
| A | 0 | 12689 | 1 |
| B | 0 | 17479 | 1 |
| C | 0 | 12733 | 1 |
| D | 0 | 30261 | 1 |
| Mode SS | |||
|---|---|---|---|
| Quadrant | BADHDUFLAG | Total packets | Discarded packets |
| A | 0 | 116 | 0 |
| B | 0 | 116 | 0 |
| C | 0 | 116 | 0 |
| D | 0 | 116 | 0 |
| Quadrant | Total seconds | Saturated seconds | Saturation percentage |
|---|---|---|---|
| A | 5752 | 48 | 0.834492% |
| B | 5753 | 57 | 0.990787% |
| C | 5753 | 92 | 1.599166% |
| D | 5753 | 1242 | 21.588736% |
Noise dominated data is calculated using 1-second bins in cleaned event files. If a bin has >2000 counts, and if more than 50% of those come from <1% of pixels, then it is considered to be noise-dominated and hence unusable.
| Quadrant | # 1 sec bins | Bins with >0 counts | Bins with >2000 counts | High rate bins dominated by noise | Noise dominated (total time) | Noise dominated (detector-on time) | Marked lightcurve |
|---|---|---|---|---|---|---|---|
| A | 6932 | 5752 | 16 | 16 | 0.23% | 0.28% | 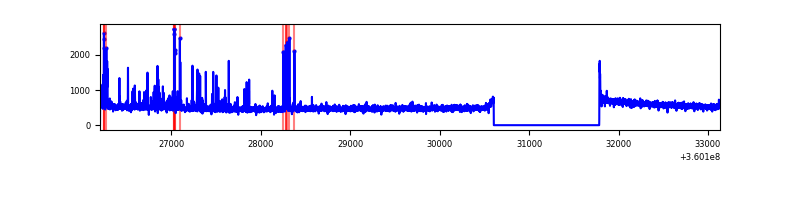 |
| B | 6933 | 5753 | 0 | 0 | 0.00% | 0.00% | 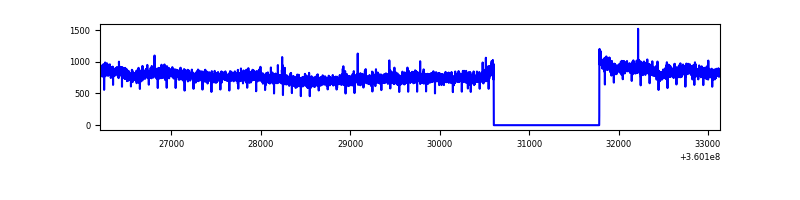 |
| C | 6933 | 5754 | 1 | 1 | 0.01% | 0.02% | 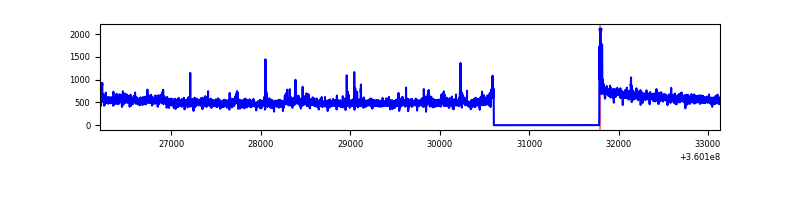 |
| D | 6933 | 5754 | 1362 | 1362 | 19.65% | 23.67% | 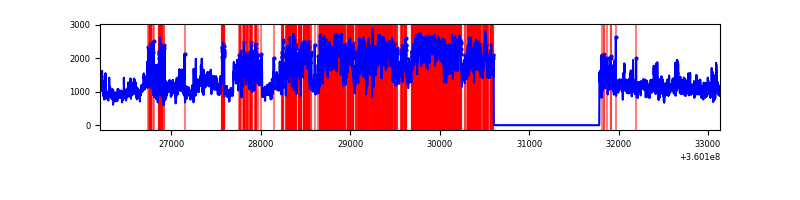 |
Top three noisy pixels from each quadrant. If the there are fewer than three noisy pixels in the level2.evt file, extra rows are filled as -1
| Pixel properties | Quadrant properties | ||||||
|---|---|---|---|---|---|---|---|
| Quadrant | DetID | PixID | Counts | Sigma | Mean | Median | Sigma |
| A | 0 | 13 | 173450 | 1185.32 | 741 | 730 | 145.7 |
| A | 8 | 192 | 11789 | 75.89 | 741 | 730 | 145.7 |
| A | 13 | 254 | 9486 | 60.09 | 741 | 730 | 145.7 |
| B | 6 | 159 | 1610823 | 11793.75 | 732 | 716 | 136.5 |
| B | 12 | 111 | 16052 | 112.33 | 732 | 716 | 136.5 |
| B | 11 | 111 | 14984 | 104.51 | 732 | 716 | 136.5 |
| C | 14 | 238 | 119201 | 711.16 | 720 | 727 | 166.6 |
| C | 3 | 233 | 96319 | 573.8 | 720 | 727 | 166.6 |
| C | 0 | 10 | 24401 | 142.11 | 720 | 727 | 166.6 |
| D | 8 | 195 | 4332020 | 27151.15 | 690 | 674 | 159.5 |
| D | 12 | 227 | 718467 | 4499.5 | 690 | 674 | 159.5 |
| D | 12 | 79 | 424861 | 2659.03 | 690 | 674 | 159.5 |
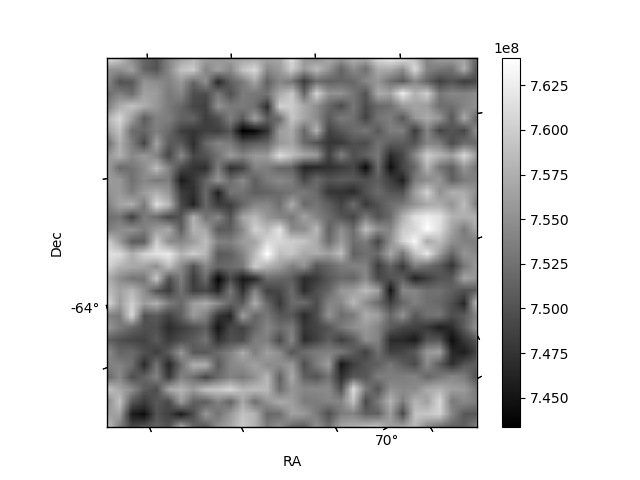
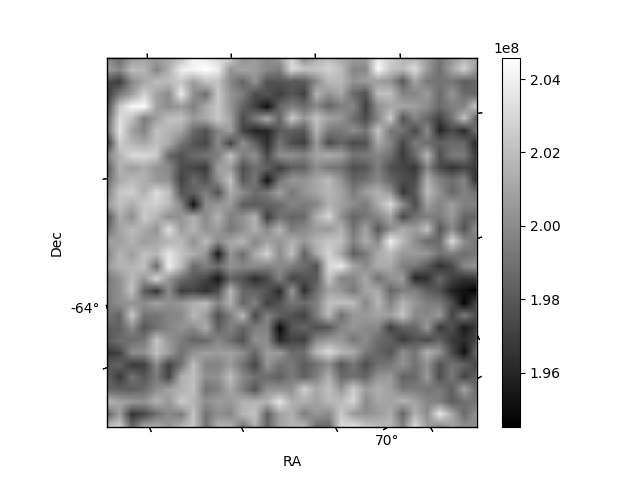
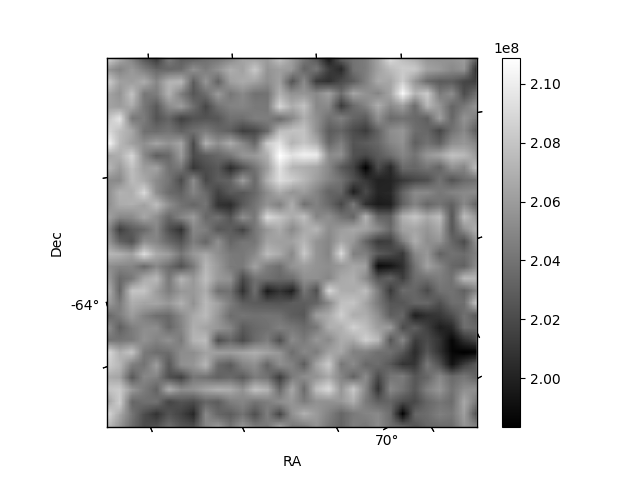
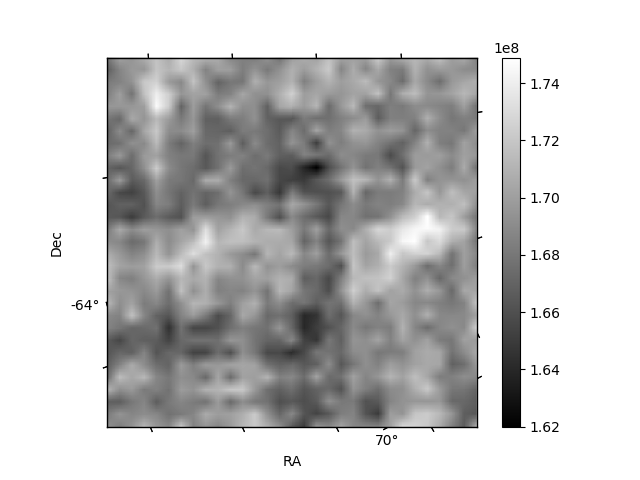
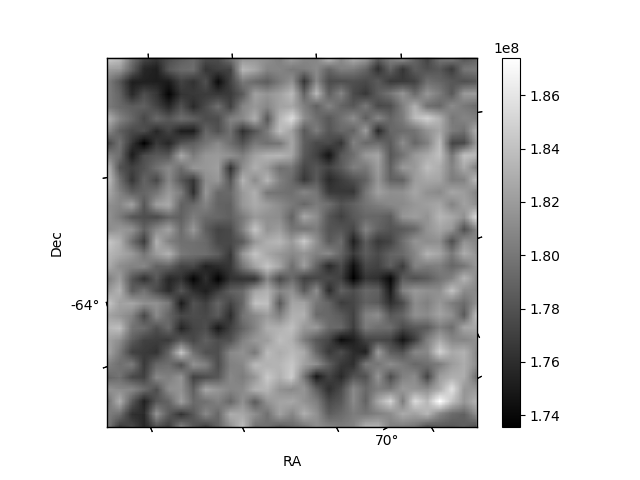
Histogram calculated using DETX and DETY for each event in the final _common_clean file
| Quadrant A | 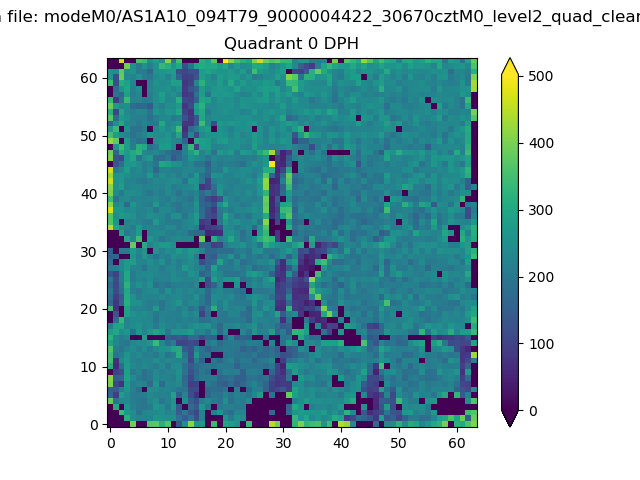 |
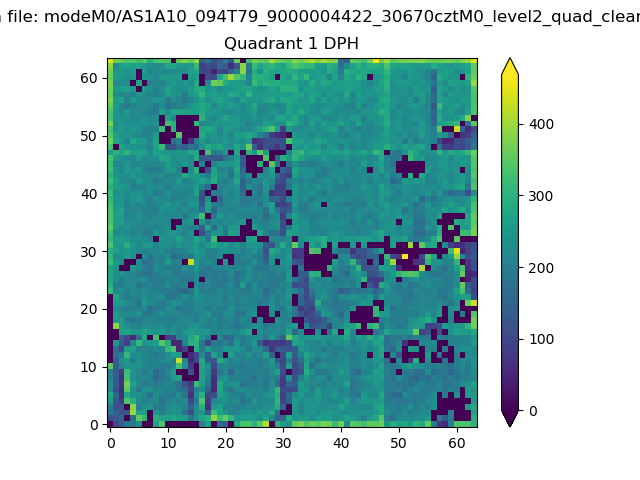 |
Quadrant B |
|---|---|---|---|
| Quadrant D |  |
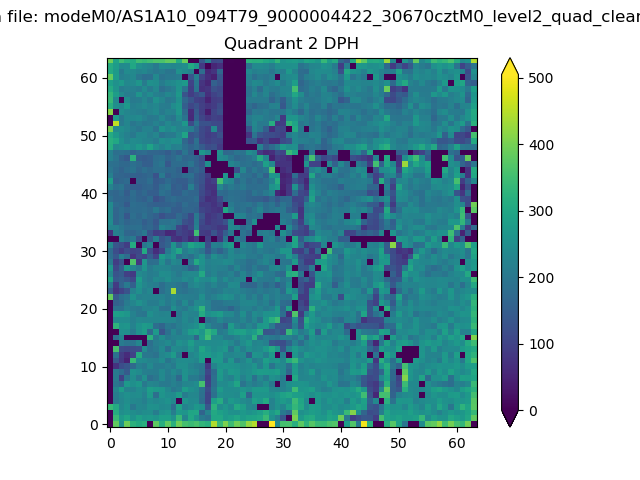 |
Quadrant C |
| Plot type | Count rate plots | Images |
|---|---|---|
| Comparison with Poisson distribution Blue bars denote a histogram of data divided into 1 sec bins. Red curve is a Poisson curve with rate = median count rate of data. |
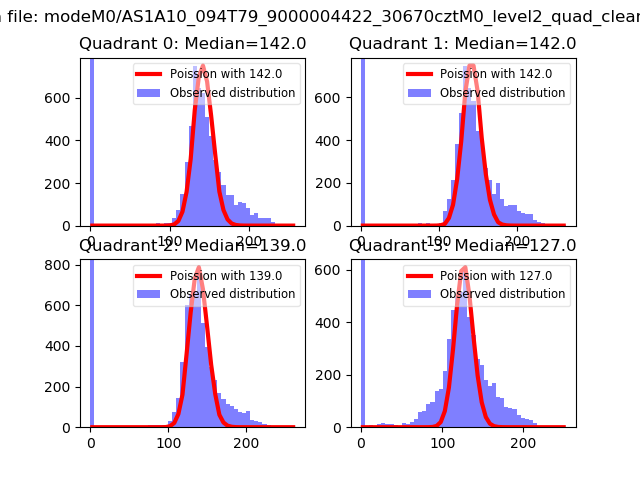 |
 |
| Quadrant-wise count rates Data is divided into 100 sec bins |
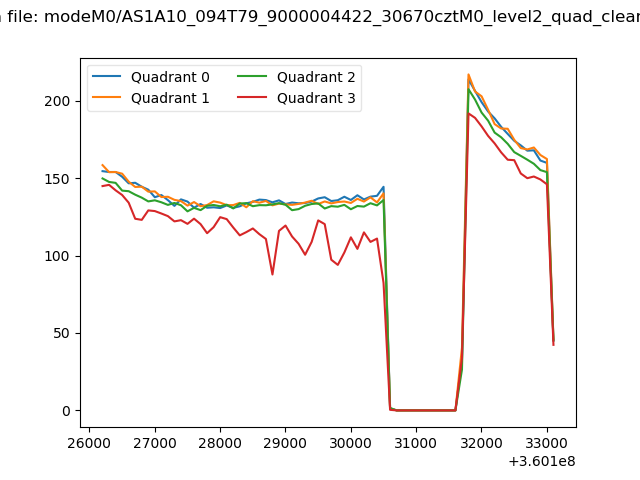 |
|
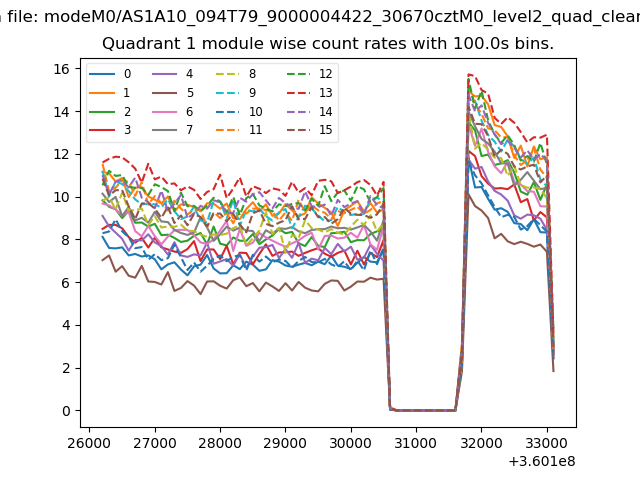
| Module-wise count rates for Quadrant A Data is divided into 100 sec bins |
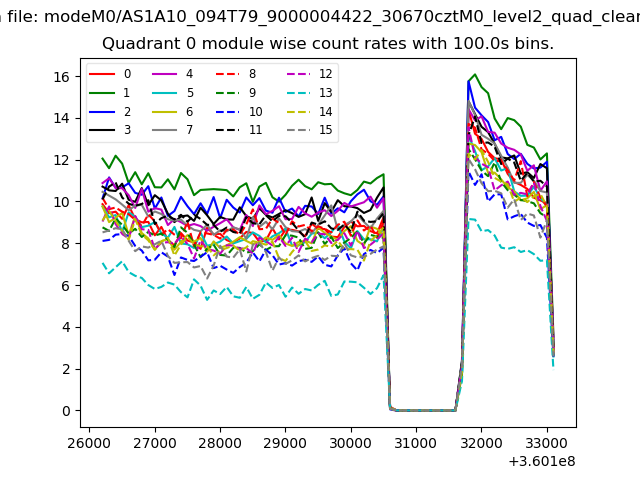 |
 |
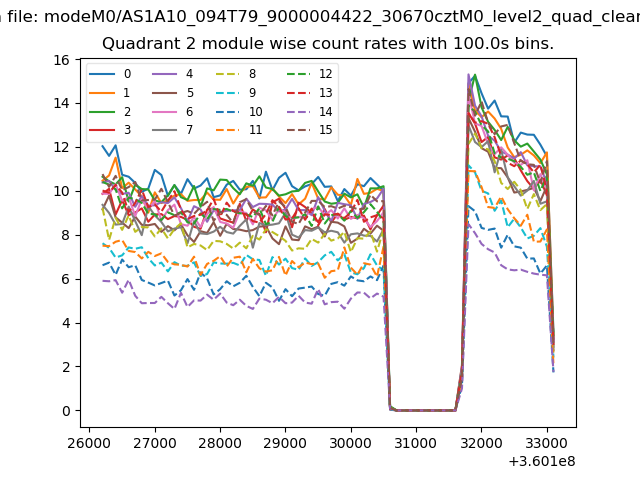
| Module-wise count rates for Quadrant B Data is divided into 100 sec bins |
 |
 |
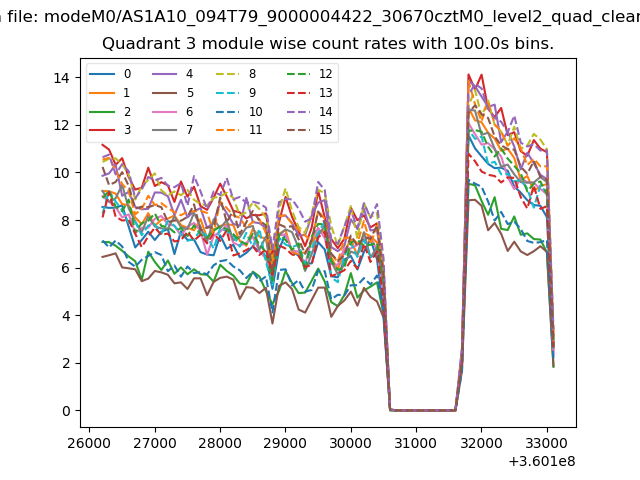
| Module-wise count rates for Quadrant C Data is divided into 100 sec bins |
 |
 |
| Module-wise count rates for Quadrant D Data is divided into 100 sec bins |
 |
 |
| Parameter | Plot |
|---|---|
| CZT HV Monitor | 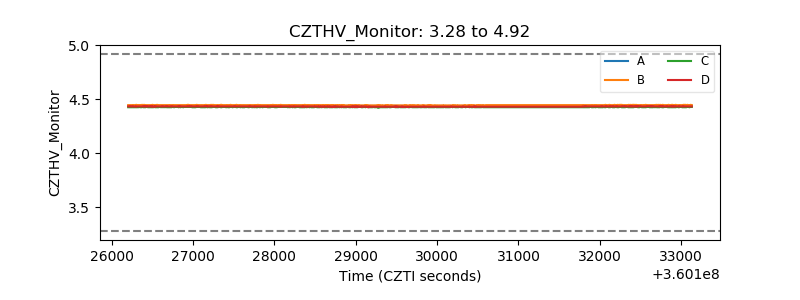 |
| D_VDD | 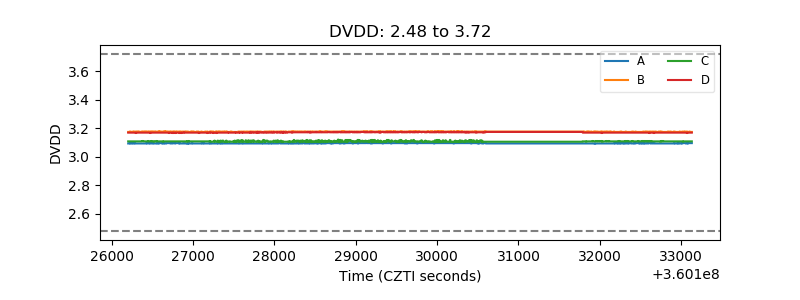 |
| Temperature 1 | 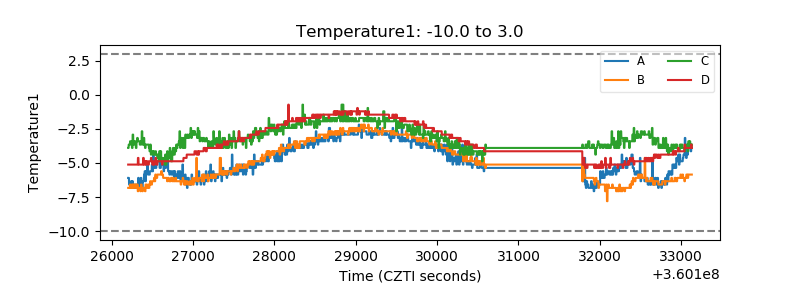 |
| Veto HV Monitor | 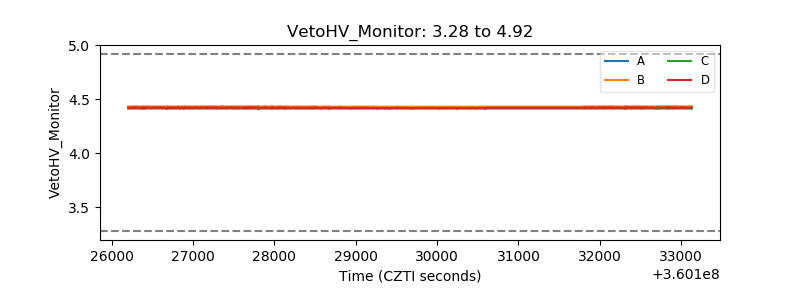 |
| Veto LLD | 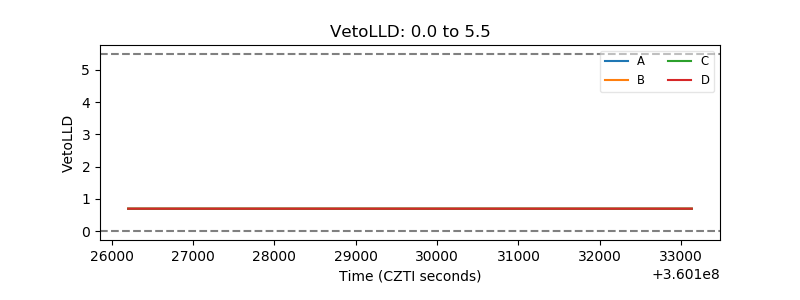 |
| Alpha Counter | 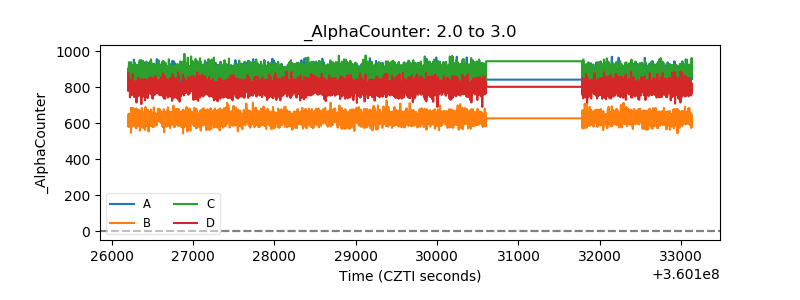 |
| _CPM_Rate | 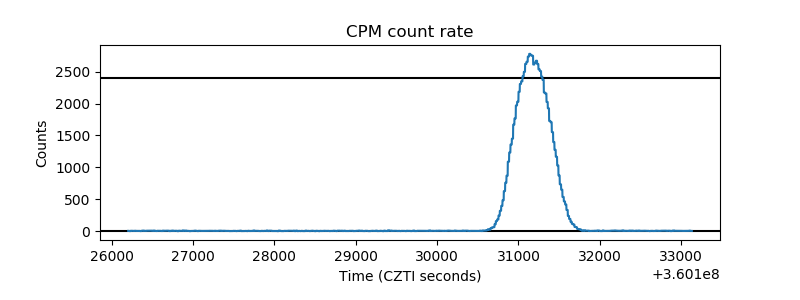 |
| CZT Counter | 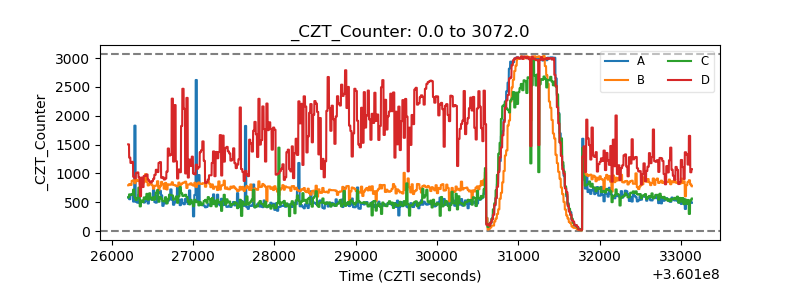 |
| +2.5 Volts monitor | 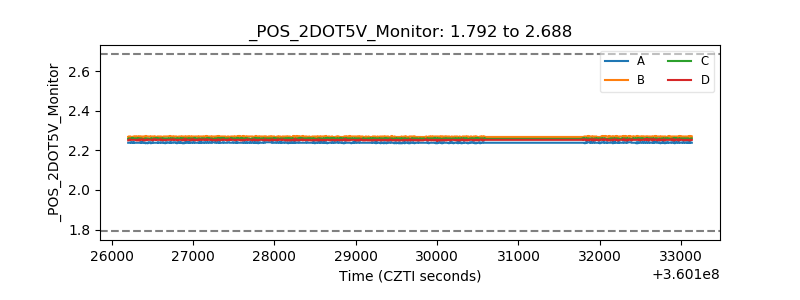 |
| +5 Volts monitor |  |
| _ROLL_ROT |  |
| _Roll_DEC |  |
| _Roll_RA | 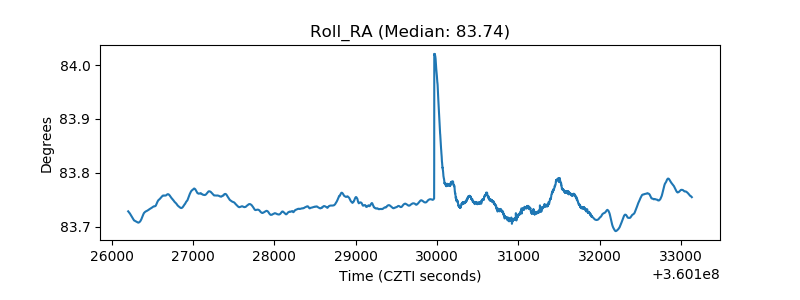 |
| Veto Counter | 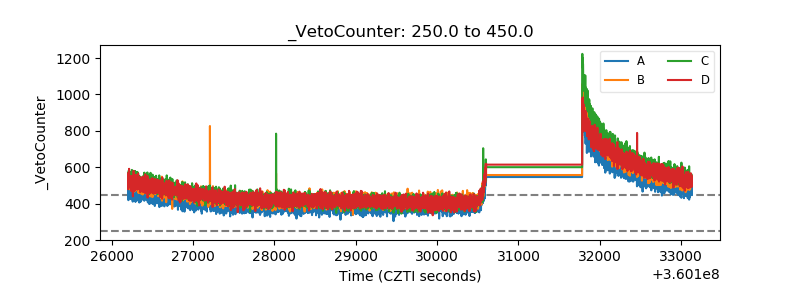 |