| Param | Original file | Final file |
|---|---|---|
| Filename | modeM0/AS1A10_094T79_9000004422_30671cztM0_level2.evt | modeM0/AS1A10_094T79_9000004422_30671cztM0_level2_quad_clean.evt |
| Size (bytes) | 691,833,600 | 133,827,840 |
| Size | 659.8 MB | 127.6 MB |
| Events in quadrant A | 3,147,351 | 946,762 |
| Events in quadrant B | 4,817,021 | 944,222 |
| Events in quadrant C | 3,281,617 | 919,629 |
| Events in quadrant D | 9,305,854 | 827,117 |
| Mode M9 | |||
|---|---|---|---|
| Quadrant | BADHDUFLAG | Total packets | Discarded packets |
| A | 0 | 12 | 0 |
| B | 0 | 12 | 0 |
| C | 0 | 12 | 0 |
| D | 0 | 12 | 0 |
| Mode M0 | |||
|---|---|---|---|
| Quadrant | BADHDUFLAG | Total packets | Discarded packets |
| A | 0 | 13022 | 1 |
| B | 0 | 18371 | 1 |
| C | 0 | 13565 | 1 |
| D | 0 | 31757 | 1 |
| Mode SS | |||
|---|---|---|---|
| Quadrant | BADHDUFLAG | Total packets | Discarded packets |
| A | 0 | 122 | 0 |
| B | 0 | 122 | 0 |
| C | 0 | 122 | 0 |
| D | 0 | 122 | 0 |
| Quadrant | Total seconds | Saturated seconds | Saturation percentage |
|---|---|---|---|
| A | 5942 | 24 | 0.403904% |
| B | 5942 | 80 | 1.346348% |
| C | 5942 | 106 | 1.783911% |
| D | 5942 | 1133 | 19.067654% |
Noise dominated data is calculated using 1-second bins in cleaned event files. If a bin has >2000 counts, and if more than 50% of those come from <1% of pixels, then it is considered to be noise-dominated and hence unusable.
| Quadrant | # 1 sec bins | Bins with >0 counts | Bins with >2000 counts | High rate bins dominated by noise | Noise dominated (total time) | Noise dominated (detector-on time) | Marked lightcurve |
|---|---|---|---|---|---|---|---|
| A | 7232 | 5943 | 2 | 2 | 0.03% | 0.03% | 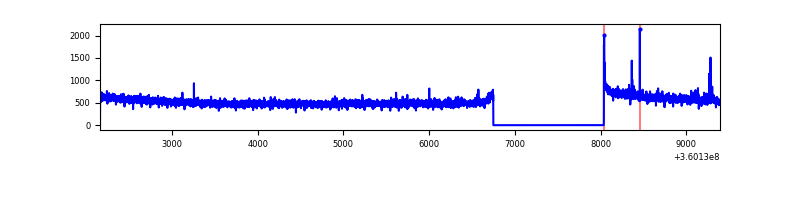 |
| B | 7232 | 5943 | 5 | 5 | 0.07% | 0.08% | 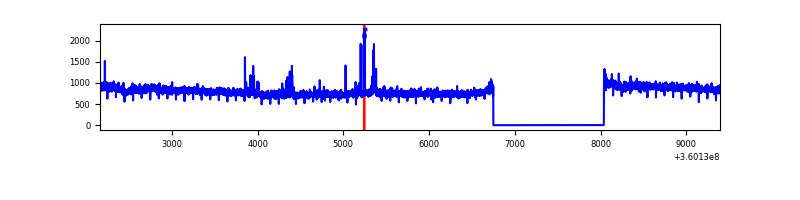 |
| C | 7232 | 5943 | 1 | 1 | 0.01% | 0.02% | 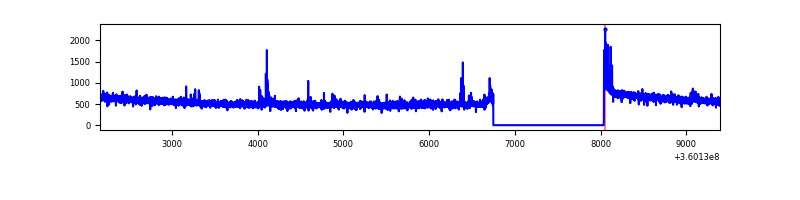 |
| D | 7232 | 5943 | 1257 | 1257 | 17.38% | 21.15% | 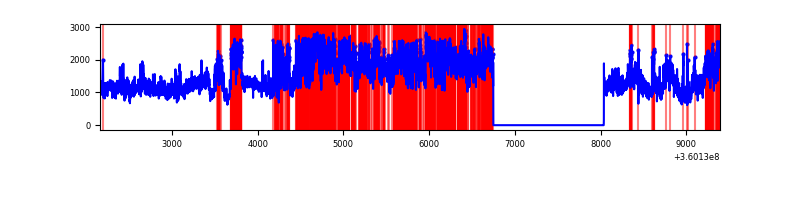 |
Top three noisy pixels from each quadrant. If the there are fewer than three noisy pixels in the level2.evt file, extra rows are filled as -1
| Pixel properties | Quadrant properties | ||||||
|---|---|---|---|---|---|---|---|
| Quadrant | DetID | PixID | Counts | Sigma | Mean | Median | Sigma |
| A | 0 | 13 | 16837 | 101.32 | 809 | 797 | 158.3 |
| A | 13 | 254 | 10798 | 63.17 | 809 | 797 | 158.3 |
| A | 8 | 192 | 10529 | 61.47 | 809 | 797 | 158.3 |
| B | 6 | 159 | 1646789 | 11346.12 | 791 | 774 | 145.1 |
| B | 0 | 156 | 42059 | 284.58 | 791 | 774 | 145.1 |
| B | 12 | 111 | 16999 | 111.84 | 791 | 774 | 145.1 |
| C | 14 | 238 | 133499 | 744.28 | 778 | 785 | 178.3 |
| C | 0 | 10 | 41777 | 229.89 | 778 | 785 | 178.3 |
| C | 3 | 233 | 26273 | 142.94 | 778 | 785 | 178.3 |
| D | 8 | 195 | 4641438 | 26140.19 | 755 | 739 | 177.5 |
| D | 12 | 79 | 684758 | 3852.95 | 755 | 739 | 177.5 |
| D | 2 | 250 | 391603 | 2201.66 | 755 | 739 | 177.5 |
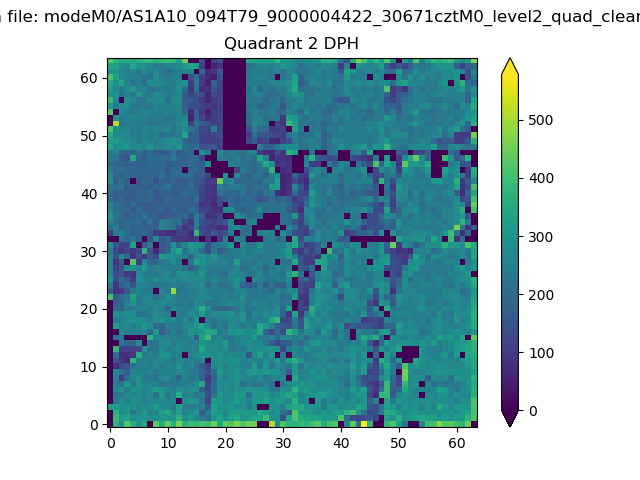
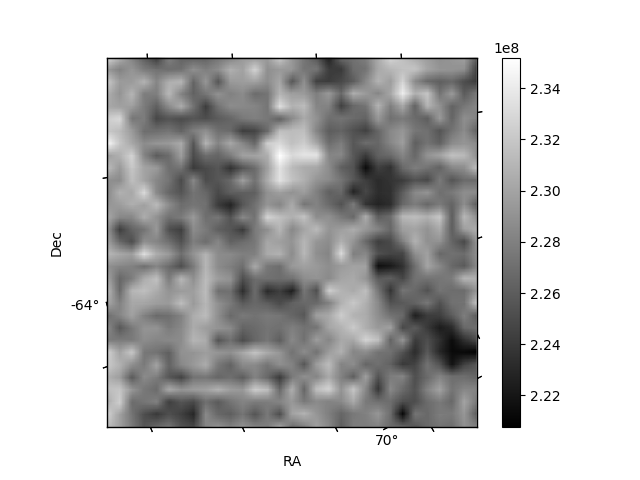
Histogram calculated using DETX and DETY for each event in the final _common_clean file
| Quadrant A | 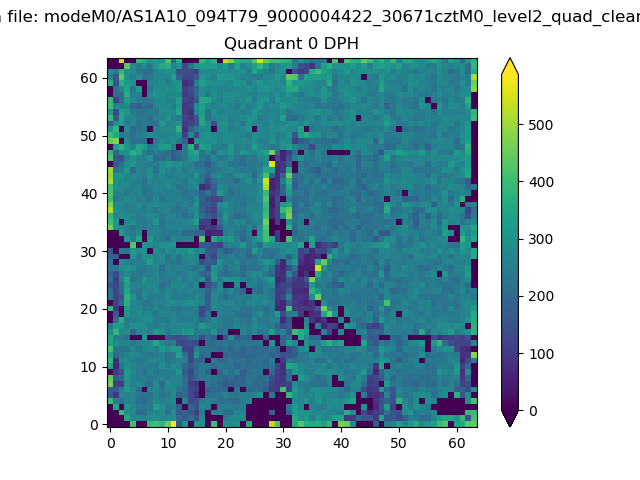 |
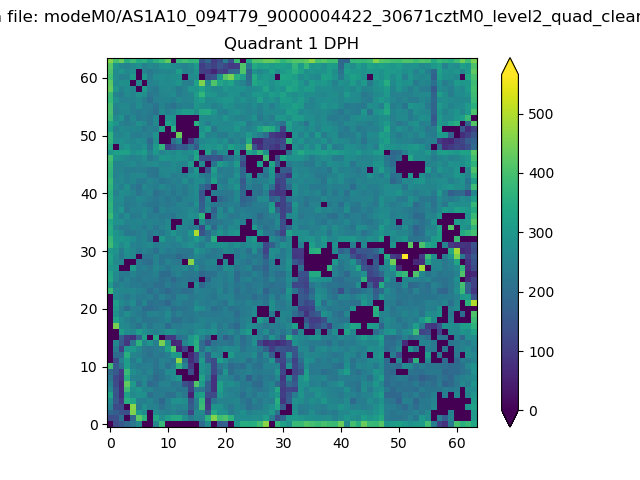 |
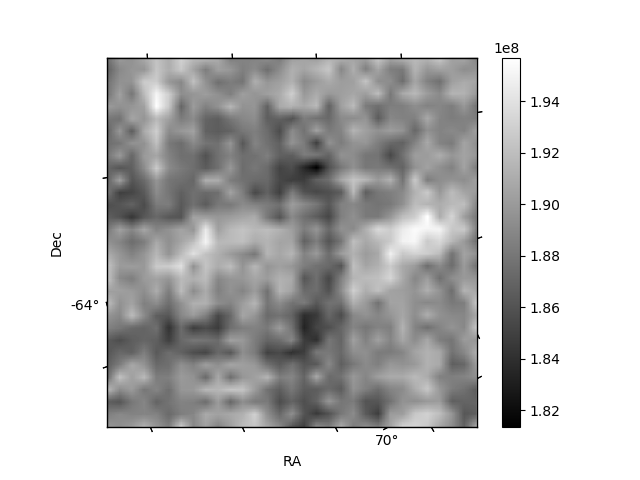
Quadrant B |
|---|---|---|---|
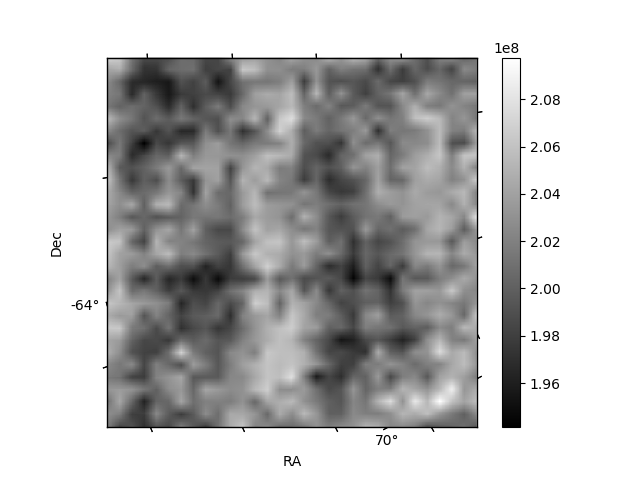
| Quadrant D | 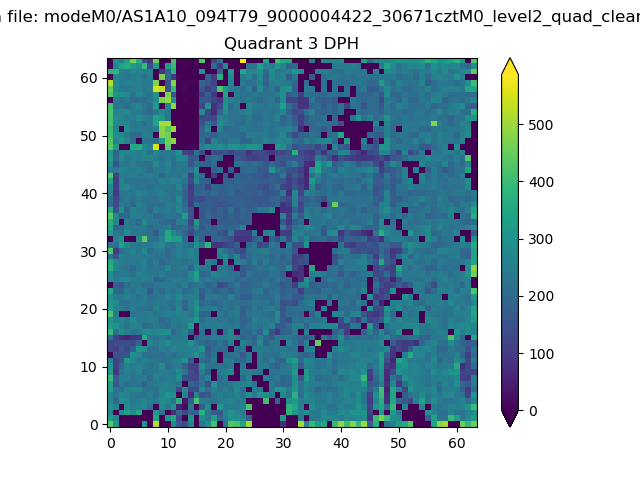 |
 |
Quadrant C |
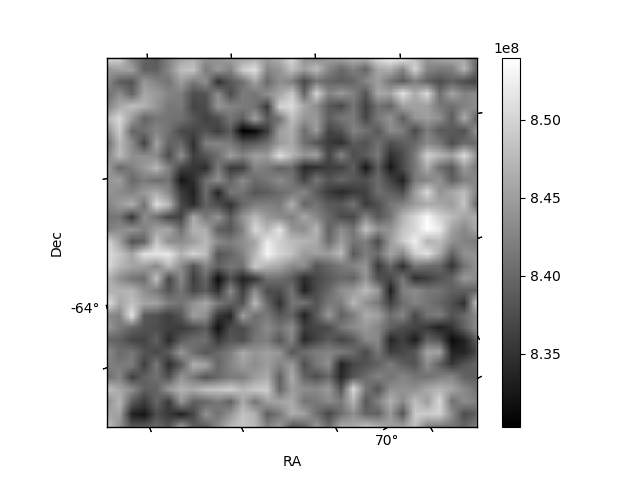
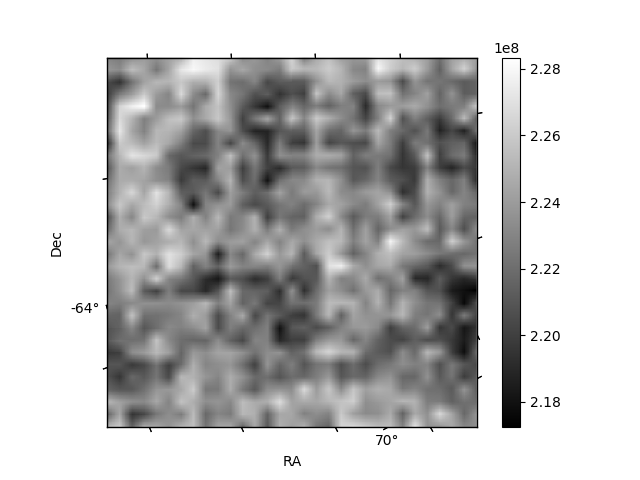
| Plot type | Count rate plots | Images |
|---|---|---|
| Comparison with Poisson distribution Blue bars denote a histogram of data divided into 1 sec bins. Red curve is a Poisson curve with rate = median count rate of data. |
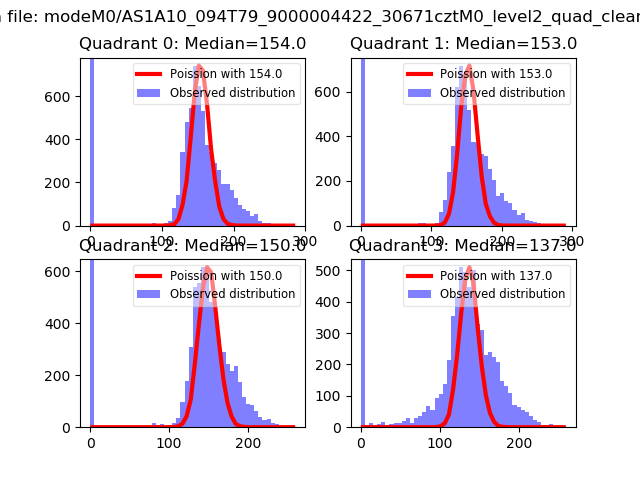 |
 |
| Quadrant-wise count rates Data is divided into 100 sec bins |
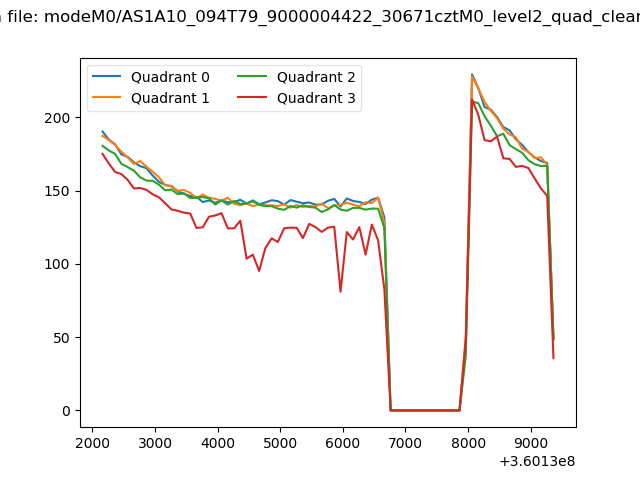 |
|
| Module-wise count rates for Quadrant A Data is divided into 100 sec bins |
 |
 |
| Module-wise count rates for Quadrant B Data is divided into 100 sec bins |
 |
 |
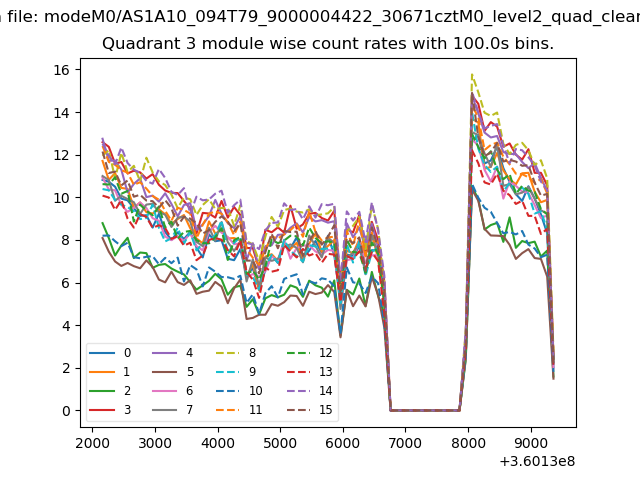
| Module-wise count rates for Quadrant C Data is divided into 100 sec bins |
 |
 |
| Module-wise count rates for Quadrant D Data is divided into 100 sec bins |
 |
 |
| Parameter | Plot |
|---|---|
| CZT HV Monitor |  |
| D_VDD | 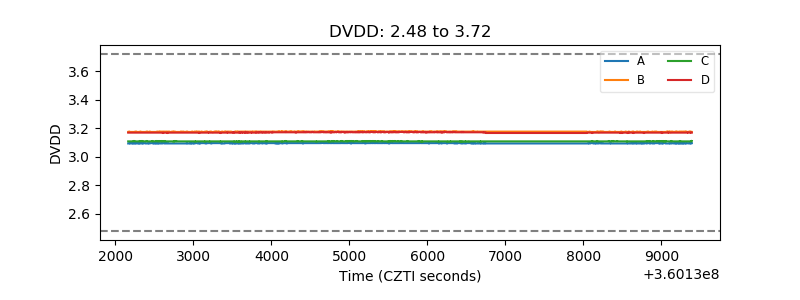 |
| Temperature 1 | 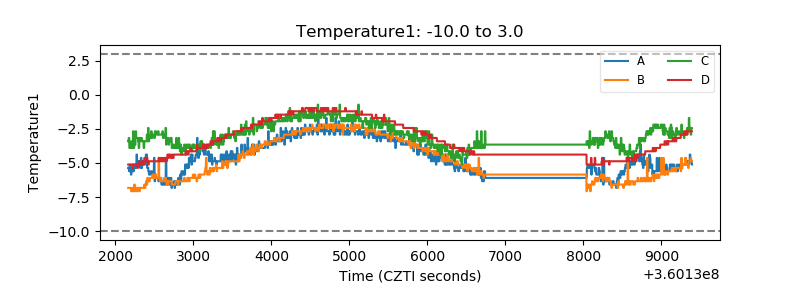 |
| Veto HV Monitor | 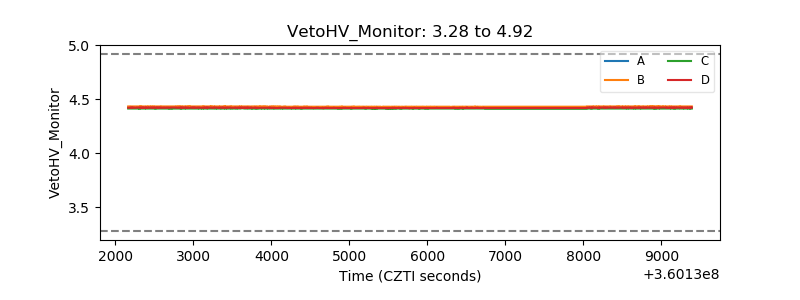 |
| Veto LLD | 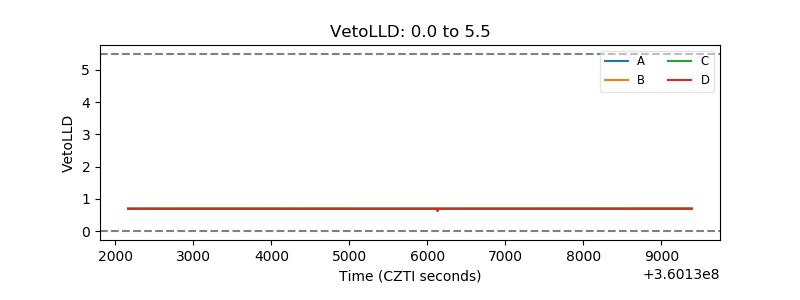 |
| Alpha Counter | 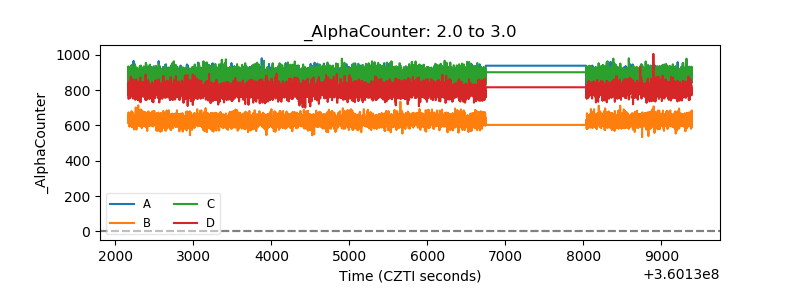 |
| _CPM_Rate | 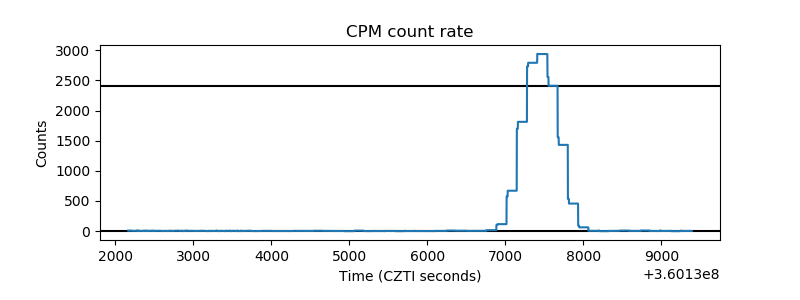 |
| CZT Counter | 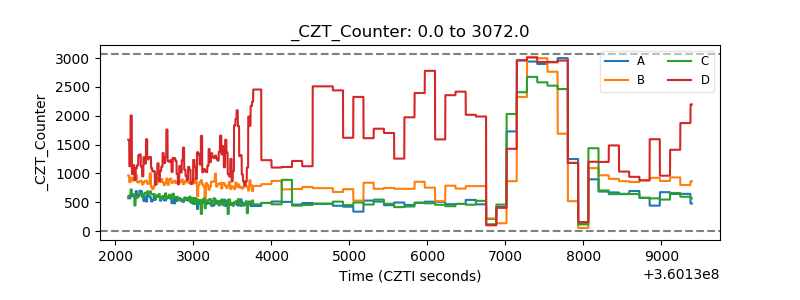 |
| +2.5 Volts monitor |  |
| +5 Volts monitor |  |
| _ROLL_ROT | 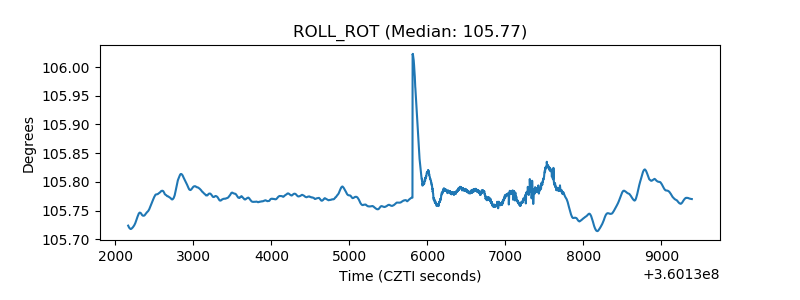 |
| _Roll_DEC | 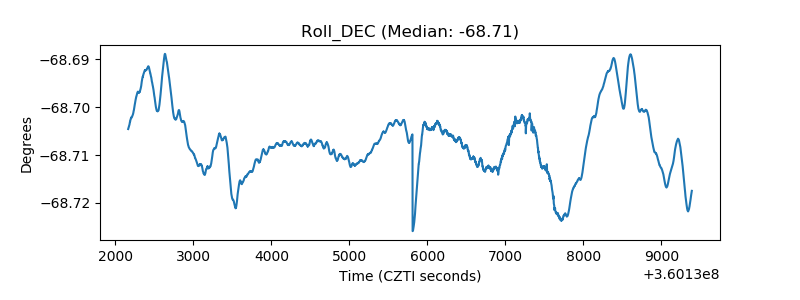 |
| _Roll_RA | 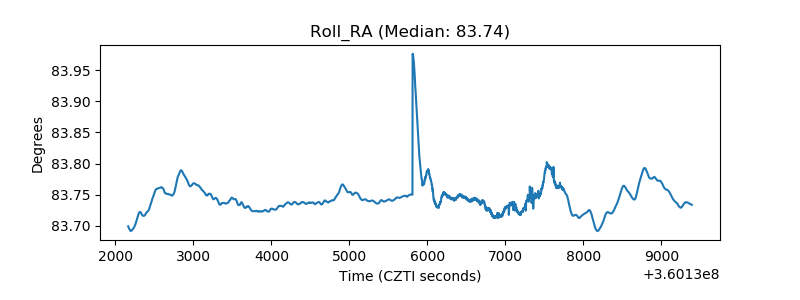 |
| Veto Counter | 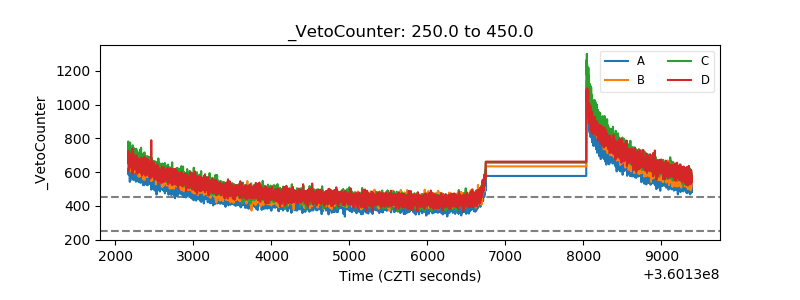 |