| Param | Original file | Final file |
|---|---|---|
| Filename | modeM0/AS1A10_094T79_9000004422_30672cztM0_level2.evt | modeM0/AS1A10_094T79_9000004422_30672cztM0_level2_quad_clean.evt |
| Size (bytes) | 471,758,400 | 88,323,840 |
| Size | 449.9 MB | 84.2 MB |
| Events in quadrant A | 2,153,341 | 626,499 |
| Events in quadrant B | 3,125,742 | 624,378 |
| Events in quadrant C | 2,176,871 | 607,898 |
| Events in quadrant D | 6,572,872 | 545,868 |
| Mode M0 | |||
|---|---|---|---|
| Quadrant | BADHDUFLAG | Total packets | Discarded packets |
| A | 0 | 8795 | 0 |
| B | 0 | 11884 | 0 |
| C | 0 | 8910 | 0 |
| D | 0 | 22182 | 0 |
| Mode SS | |||
|---|---|---|---|
| Quadrant | BADHDUFLAG | Total packets | Discarded packets |
| A | 0 | 76 | 0 |
| B | 0 | 76 | 0 |
| C | 0 | 76 | 0 |
| D | 0 | 76 | 0 |
| Quadrant | Total seconds | Saturated seconds | Saturation percentage |
|---|---|---|---|
| A | 3822 | 18 | 0.470958% |
| B | 3823 | 21 | 0.549307% |
| C | 3823 | 108 | 2.825007% |
| D | 3823 | 948 | 24.797280% |
Noise dominated data is calculated using 1-second bins in cleaned event files. If a bin has >2000 counts, and if more than 50% of those come from <1% of pixels, then it is considered to be noise-dominated and hence unusable.
| Quadrant | # 1 sec bins | Bins with >0 counts | Bins with >2000 counts | High rate bins dominated by noise | Noise dominated (total time) | Noise dominated (detector-on time) | Marked lightcurve |
|---|---|---|---|---|---|---|---|
| A | 3822 | 3822 | 16 | 16 | 0.42% | 0.42% | 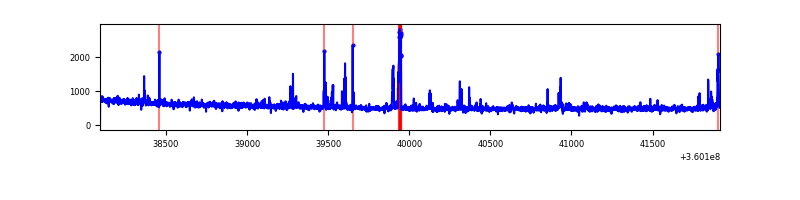 |
| B | 3823 | 3823 | 4 | 4 | 0.10% | 0.10% | 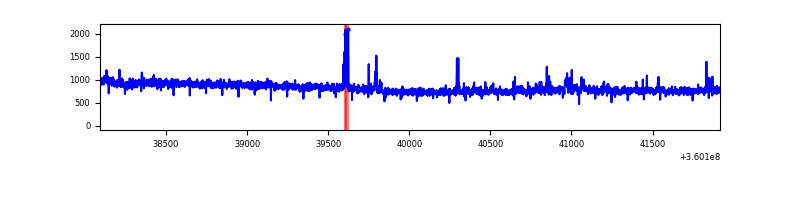 |
| C | 3823 | 3823 | 0 | 0 | 0.00% | 0.00% | 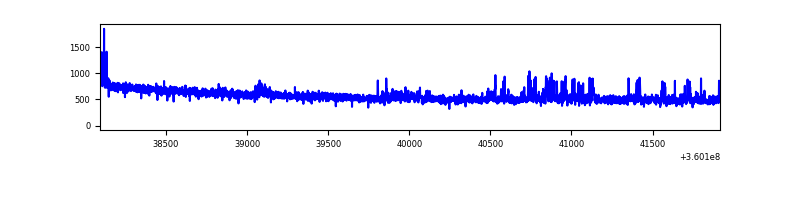 |
| D | 3823 | 3823 | 1264 | 1264 | 33.06% | 33.06% | 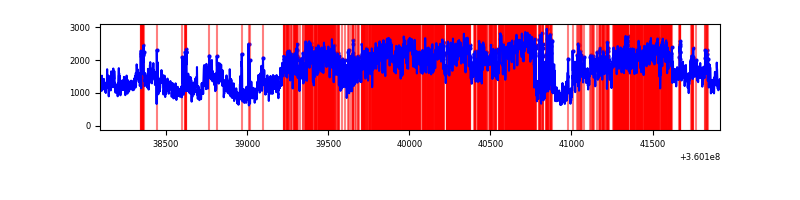 |
Top three noisy pixels from each quadrant. If the there are fewer than three noisy pixels in the level2.evt file, extra rows are filled as -1
| Pixel properties | Quadrant properties | ||||||
|---|---|---|---|---|---|---|---|
| Quadrant | DetID | PixID | Counts | Sigma | Mean | Median | Sigma |
| A | 0 | 13 | 126891 | 1209.79 | 524 | 517 | 104.5 |
| A | 13 | 254 | 6767 | 59.83 | 524 | 517 | 104.5 |
| A | 0 | 226 | 4613 | 39.21 | 524 | 517 | 104.5 |
| B | 6 | 159 | 1063294 | 11354.36 | 509 | 499 | 93.6 |
| B | 4 | 81 | 40202 | 424.17 | 509 | 499 | 93.6 |
| B | 0 | 229 | 20464 | 213.3 | 509 | 499 | 93.6 |
| C | 14 | 238 | 120450 | 1041.1 | 501 | 506 | 115.2 |
| C | 14 | 254 | 53375 | 458.9 | 501 | 506 | 115.2 |
| C | 3 | 233 | 29053 | 247.79 | 501 | 506 | 115.2 |
| D | 8 | 195 | 3794993 | 33153.46 | 490 | 480 | 114.5 |
| D | 12 | 218 | 421882 | 3681.88 | 490 | 480 | 114.5 |
| D | 12 | 79 | 263082 | 2294.41 | 490 | 480 | 114.5 |
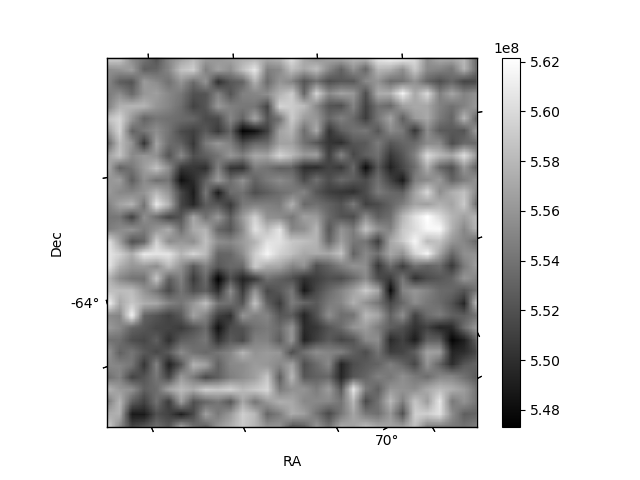
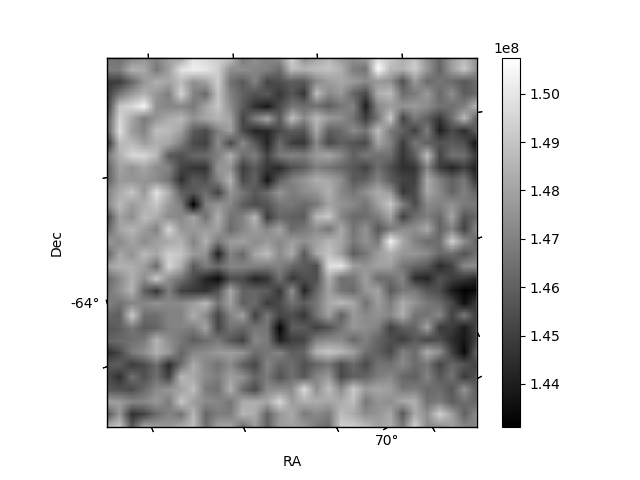
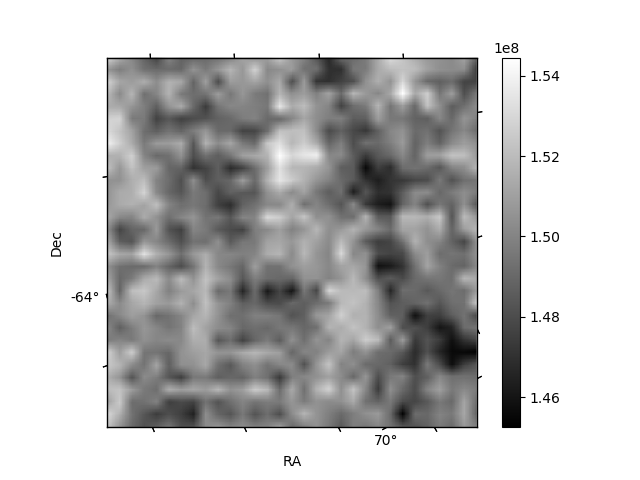
Histogram calculated using DETX and DETY for each event in the final _common_clean file
| Quadrant A | 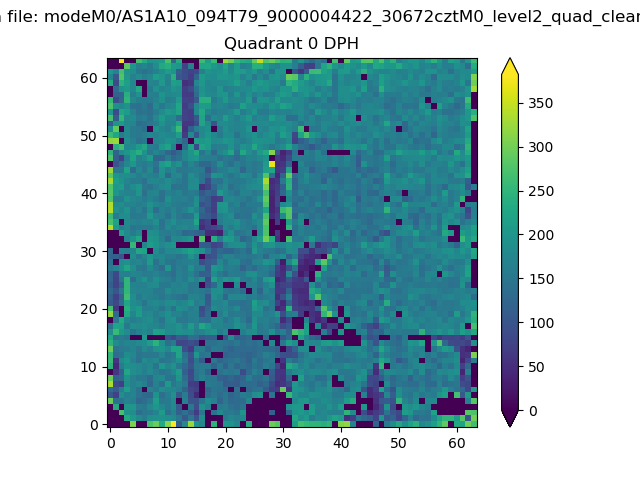 |
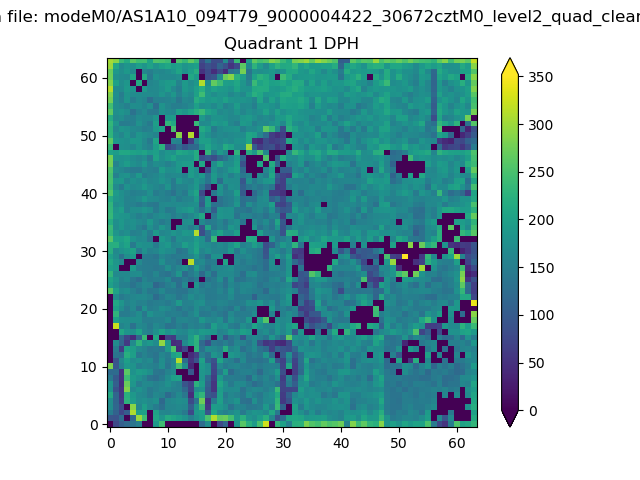 |
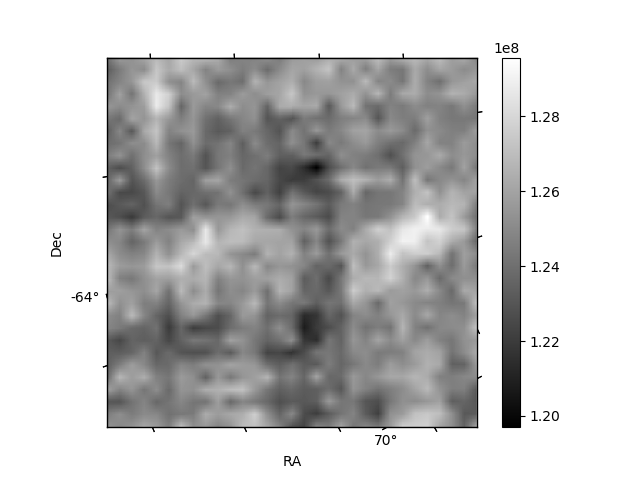
Quadrant B |
|---|---|---|---|
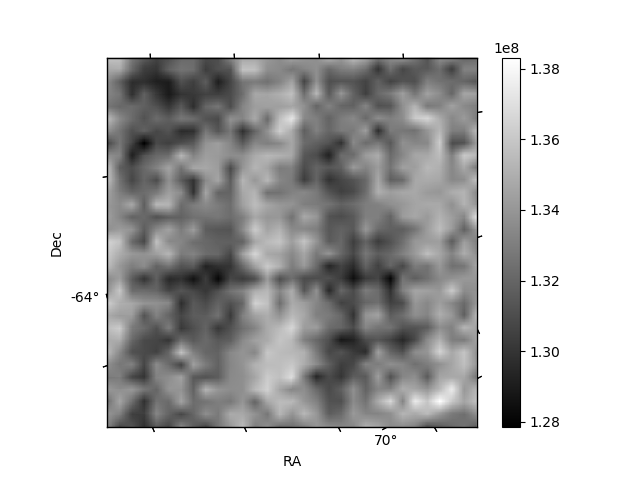
| Quadrant D | 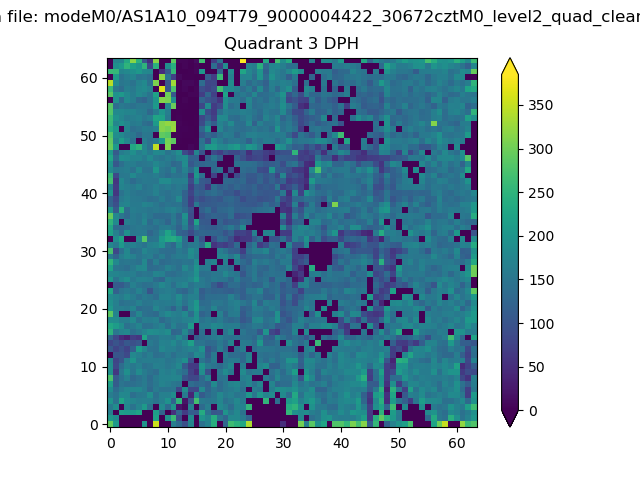 |
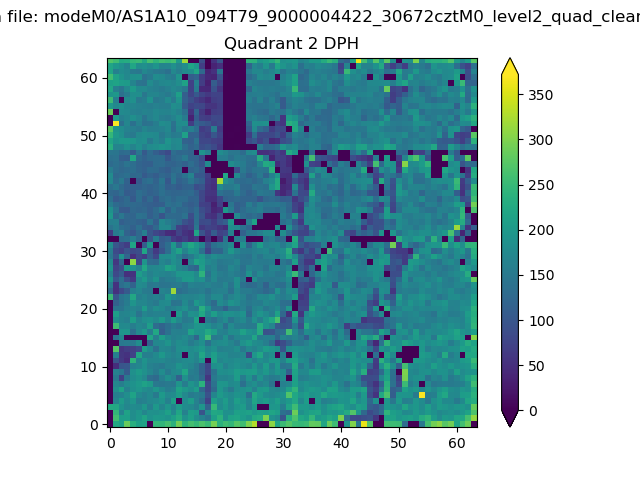 |
Quadrant C |
| Plot type | Count rate plots | Images |
|---|---|---|
| Comparison with Poisson distribution Blue bars denote a histogram of data divided into 1 sec bins. Red curve is a Poisson curve with rate = median count rate of data. |
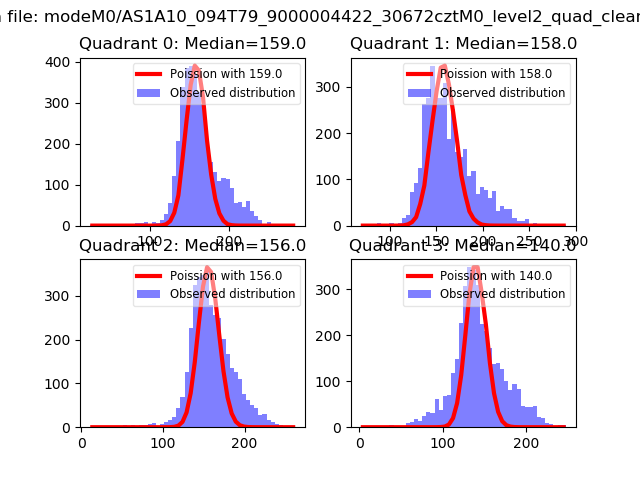 |
 |
| Quadrant-wise count rates Data is divided into 100 sec bins |
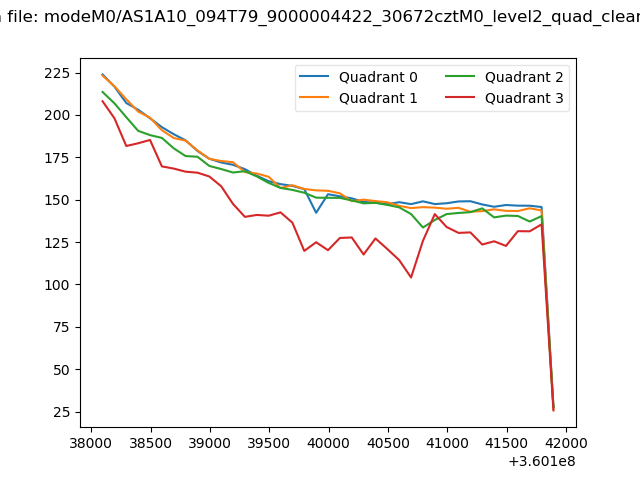 |
|
| Module-wise count rates for Quadrant A Data is divided into 100 sec bins |
 |
 |
| Module-wise count rates for Quadrant B Data is divided into 100 sec bins |
 |
 |
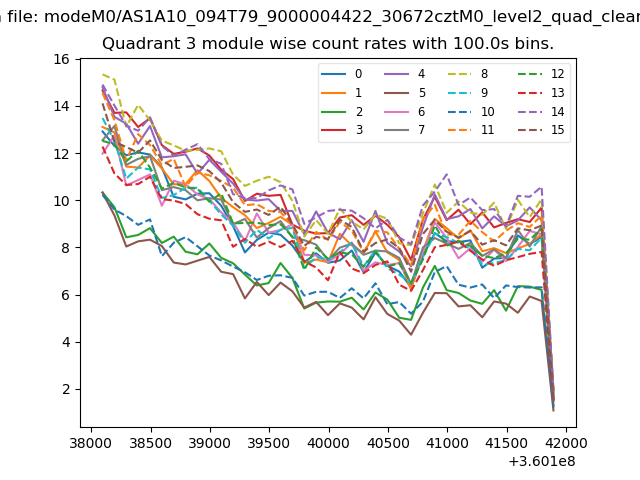
| Module-wise count rates for Quadrant C Data is divided into 100 sec bins |
 |
 |
| Module-wise count rates for Quadrant D Data is divided into 100 sec bins |
 |
 |
| Parameter | Plot |
|---|---|
| CZT HV Monitor | 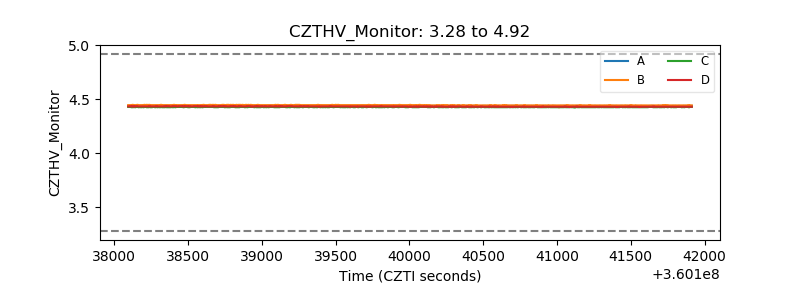 |
| D_VDD | 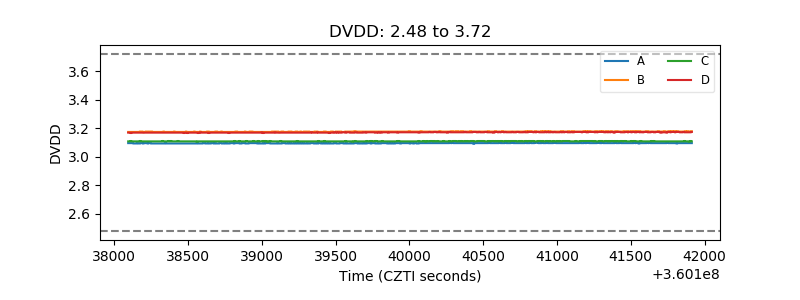 |
| Temperature 1 | 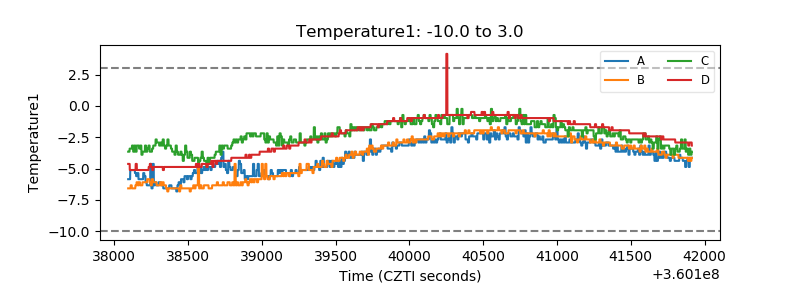 |
| Veto HV Monitor | 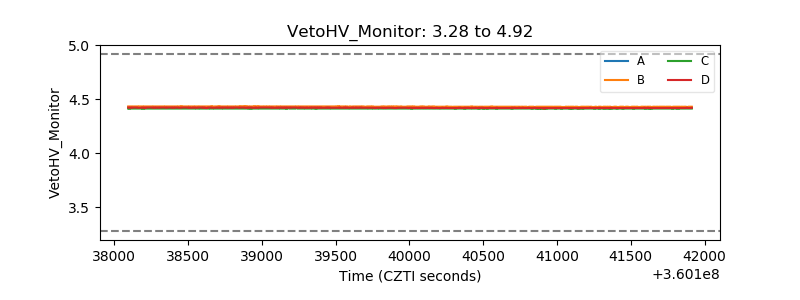 |
| Veto LLD | 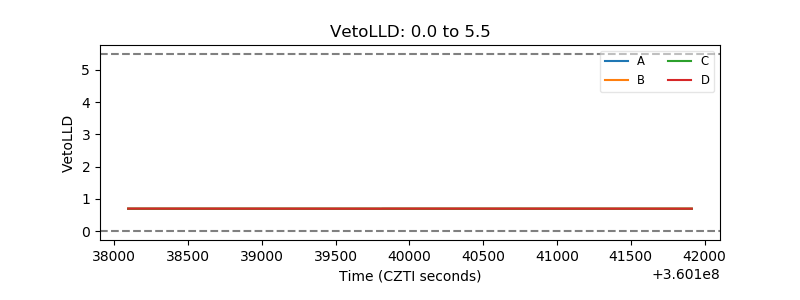 |
| Alpha Counter | 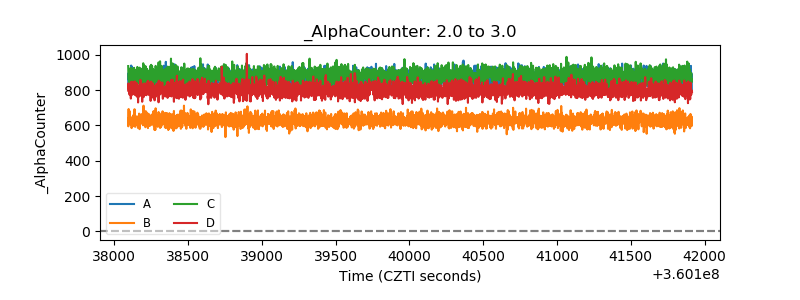 |
| _CPM_Rate | 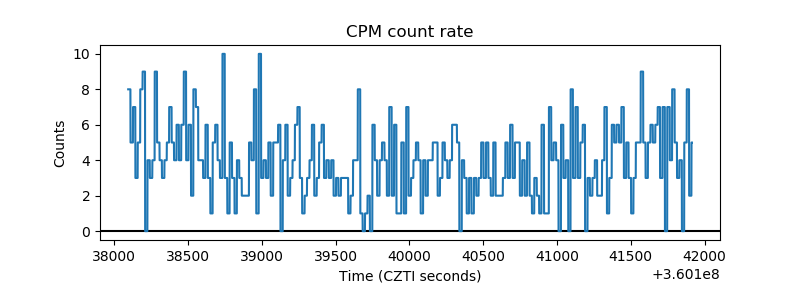 |
| CZT Counter | 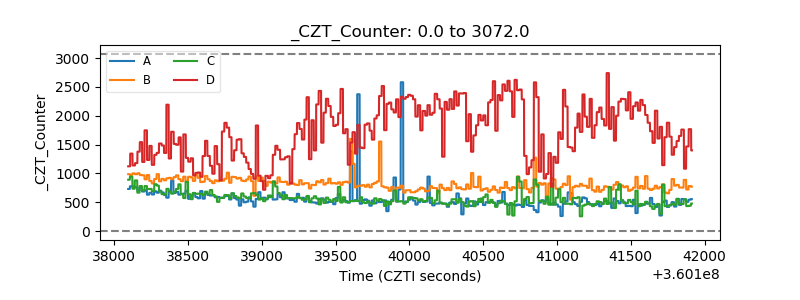 |
| +2.5 Volts monitor |  |
| +5 Volts monitor |  |
| _ROLL_ROT | 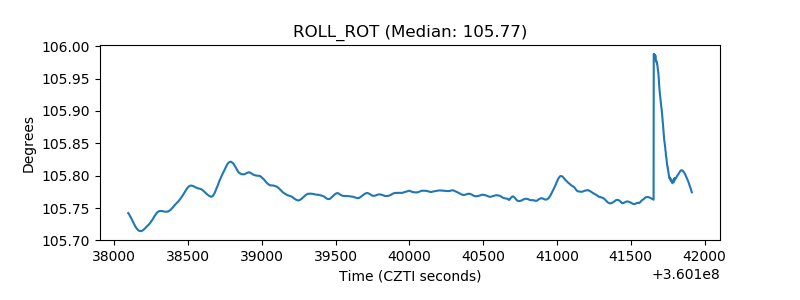 |
| _Roll_DEC |  |
| _Roll_RA | 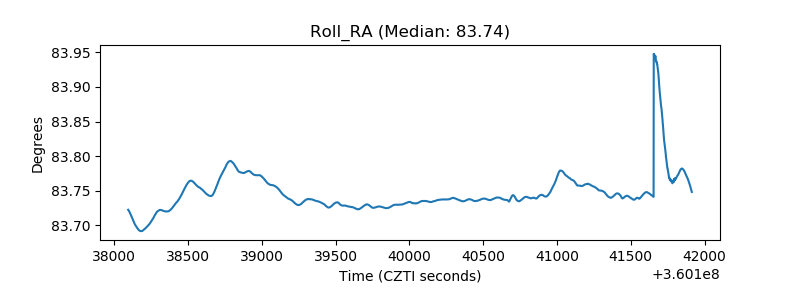 |
| Veto Counter |  |