| Param | Original file | Final file |
|---|---|---|
| Filename | modeM0/AS1A10_094T80_9000004424cztM0_level2.fits | modeM0/AS1A10_094T80_9000004424cztM0_level2_quad_clean.evt |
| Size (bytes) | 245,312,640 | 229,017,600 |
| Size | 233.9 MB | 218.4 MB |
| Events in quadrant A | 1,593,698 | 1,466,670 |
| Events in quadrant B | 1,461,670 | 1,422,194 |
| Events in quadrant C | 1,504,532 | 1,377,340 |
| Events in quadrant D | 1,242,254 | 1,042,830 |
| Mode M9 | |||
|---|---|---|---|
| Quadrant | BADHDUFLAG | Total packets | Discarded packets |
| A | 0 | 54 | 0 |
| B | 0 | 54 | 0 |
| C | 0 | 54 | 0 |
| D | 0 | 54 | 0 |
| Mode SS | |||
|---|---|---|---|
| Quadrant | BADHDUFLAG | Total packets | Discarded packets |
| A | 0 | 480 | 0 |
| B | 0 | 480 | 0 |
| C | 0 | 480 | 0 |
| D | 0 | 480 | 0 |
| Mode M0 | |||
|---|---|---|---|
| Quadrant | BADHDUFLAG | Total packets | Discarded packets |
| A | 0 | 52790 | 0 |
| B | 0 | 73049 | 0 |
| C | 0 | 54303 | 0 |
| D | 0 | 109685 | 0 |
| Quadrant | Total seconds | Saturated seconds | Saturation percentage |
|---|---|---|---|
| A | 23627 | 530 | 2.243196% |
| B | 23627 | 743 | 3.144707% |
| C | 23627 | 717 | 3.034664% |
| D | 23627 | 4092 | 17.319169% |
Noise dominated data is calculated using 1-second bins in cleaned event files. If a bin has >2000 counts, and if more than 50% of those come from <1% of pixels, then it is considered to be noise-dominated and hence unusable.
| Quadrant | # 1 sec bins | Bins with >0 counts | Bins with >2000 counts | High rate bins dominated by noise | Noise dominated (total time) | Noise dominated (detector-on time) | Marked lightcurve |
|---|---|---|---|---|---|---|---|
| A | 28947 | 23625 | 0 | 0 | 0.00% | 0.00% |  |
| B | 28947 | 23625 | 0 | 0 | 0.00% | 0.00% |  |
| C | 28947 | 23623 | 0 | 0 | 0.00% | 0.00% |  |
| D | 28946 | 23594 | 0 | 0 | 0.00% | 0.00% |  |
Top three noisy pixels from each quadrant. If the there are fewer than three noisy pixels in the level2.evt file, extra rows are filled as -1
| Pixel properties | Quadrant properties | ||||||
|---|---|---|---|---|---|---|---|
| Quadrant | DetID | PixID | Counts | Sigma | Mean | Median | Sigma |
| A | 0 | 29 | 1340 | 9.42 | 415 | 396 | 100.2 |
| A | 7 | 110 | 1263 | 8.65 | 415 | 396 | 100.2 |
| A | 9 | 19 | 1188 | 7.91 | 415 | 396 | 100.2 |
| B | 2 | 9 | 1220 | 11.08 | 387 | 374 | 76.4 |
| B | 2 | 8 | 1040 | 8.72 | 387 | 374 | 76.4 |
| B | 5 | 128 | 1021 | 8.47 | 387 | 374 | 76.4 |
| C | 12 | 241 | 1062 | 6.8 | 398 | 377 | 100.7 |
| C | 3 | 126 | 1048 | 6.66 | 398 | 377 | 100.7 |
| C | 3 | 187 | 1041 | 6.59 | 398 | 377 | 100.7 |
| D | 15 | 46 | 964 | 6.65 | 355 | 327 | 95.8 |
| D | 10 | 189 | 920 | 6.19 | 355 | 327 | 95.8 |
| D | 10 | 113 | 894 | 5.92 | 355 | 327 | 95.8 |
Histogram calculated using DETX and DETY for each event in the final _common_clean file
| Quadrant A |  |
 |
Quadrant B |
|---|---|---|---|
| Quadrant D | 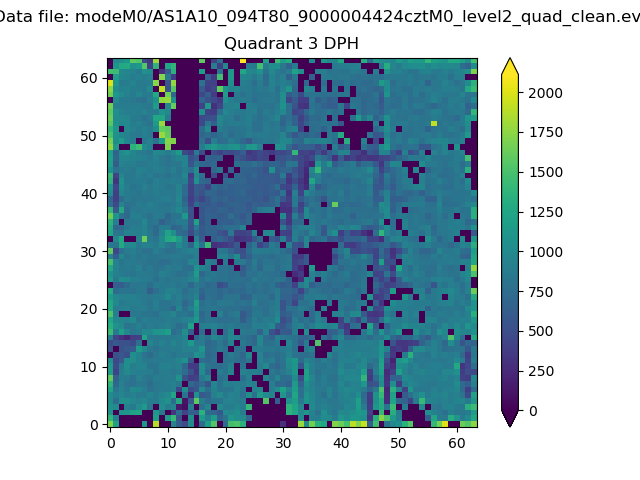 |
 |
Quadrant C |
| Plot type | Count rate plots | Images |
|---|---|---|
| Comparison with Poisson distribution Blue bars denote a histogram of data divided into 1 sec bins. Red curve is a Poisson curve with rate = median count rate of data. |
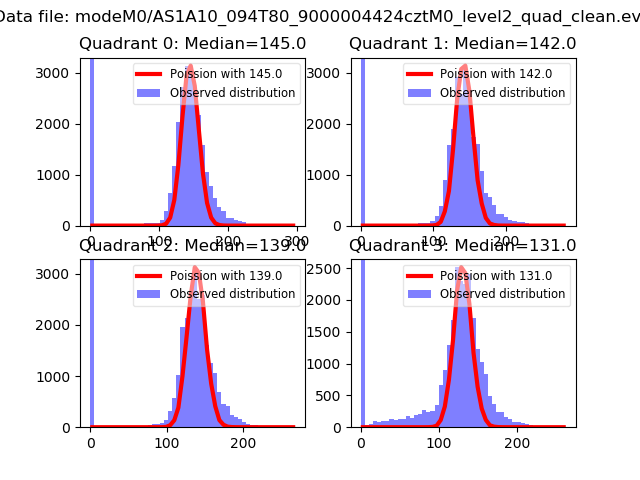 |
 |
| Quadrant-wise count rates Data is divided into 100 sec bins |
 |
|
| Module-wise count rates for Quadrant A Data is divided into 100 sec bins |
 |
 |
| Module-wise count rates for Quadrant B Data is divided into 100 sec bins |
 |
 |
| Module-wise count rates for Quadrant C Data is divided into 100 sec bins |
 |
 |
| Module-wise count rates for Quadrant D Data is divided into 100 sec bins |
 |
 |
| Parameter | Plot |
|---|---|
| CZT HV Monitor |  |
| D_VDD |  |
| Temperature 1 |  |
| Veto HV Monitor |  |
| Veto LLD |  |
| Alpha Counter |  |
| _CPM_Rate |  |
| CZT Counter |  |
| +2.5 Volts monitor |  |
| +5 Volts monitor | 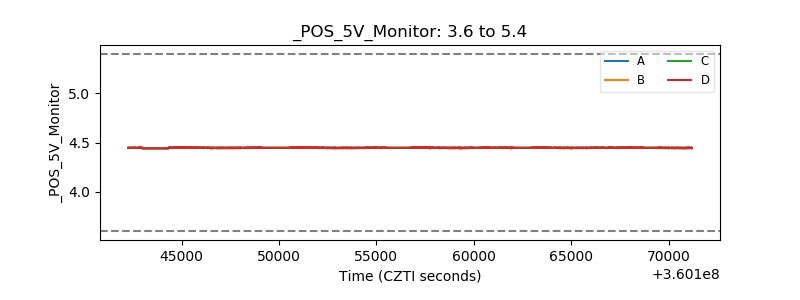 |
| _ROLL_ROT |  |
| _Roll_DEC |  |
| _Roll_RA |  |
| Veto Counter |  |