| Param | Original file | Final file |
|---|---|---|
| Filename | modeM0/AS1A10_094T80_9000004424_30672cztM0_level2.evt | modeM0/AS1A10_094T80_9000004424_30672cztM0_level2_quad_clean.evt |
| Size (bytes) | 225,774,720 | 49,965,120 |
| Size | 215.3 MB | 47.7 MB |
| Events in quadrant A | 1,390,744 | 354,393 |
| Events in quadrant B | 1,818,575 | 349,304 |
| Events in quadrant C | 1,306,711 | 335,303 |
| Events in quadrant D | 2,182,626 | 326,710 |
| Mode M9 | |||
|---|---|---|---|
| Quadrant | BADHDUFLAG | Total packets | Discarded packets |
| A | 0 | 13 | 0 |
| B | 0 | 13 | 0 |
| C | 0 | 13 | 0 |
| D | 0 | 13 | 0 |
| Mode SS | |||
|---|---|---|---|
| Quadrant | BADHDUFLAG | Total packets | Discarded packets |
| A | 0 | 42 | 0 |
| B | 0 | 42 | 0 |
| C | 0 | 42 | 0 |
| D | 0 | 42 | 0 |
| Mode M0 | |||
|---|---|---|---|
| Quadrant | BADHDUFLAG | Total packets | Discarded packets |
| A | 0 | 5509 | 1 |
| B | 0 | 6629 | 1 |
| C | 0 | 5325 | 1 |
| D | 0 | 7996 | 2 |
| Quadrant | Total seconds | Saturated seconds | Saturation percentage |
|---|---|---|---|
| A | 2029 | 85 | 4.189256% |
| B | 2029 | 125 | 6.160670% |
| C | 2029 | 139 | 6.850665% |
| D | 2028 | 160 | 7.889546% |
Noise dominated data is calculated using 1-second bins in cleaned event files. If a bin has >2000 counts, and if more than 50% of those come from <1% of pixels, then it is considered to be noise-dominated and hence unusable.
| Quadrant | # 1 sec bins | Bins with >0 counts | Bins with >2000 counts | High rate bins dominated by noise | Noise dominated (total time) | Noise dominated (detector-on time) | Marked lightcurve |
|---|---|---|---|---|---|---|---|
| A | 3374 | 2030 | 12 | 12 | 0.36% | 0.59% | 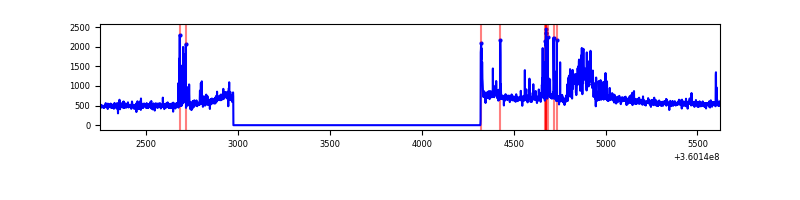 |
| B | 3374 | 2030 | 36 | 36 | 1.07% | 1.77% | 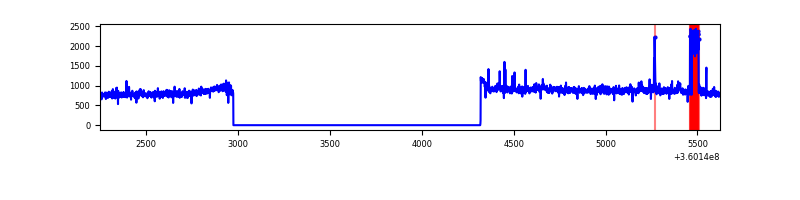 |
| C | 3374 | 2030 | 0 | 0 | 0.00% | 0.00% | 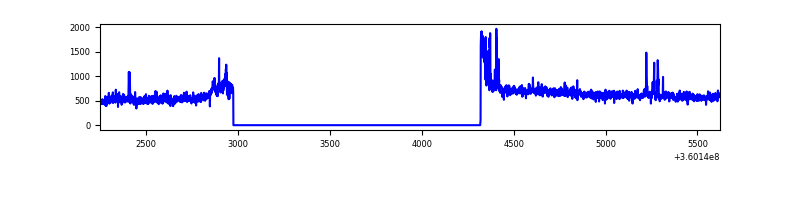 |
| D | 3373 | 2029 | 45 | 45 | 1.33% | 2.22% | 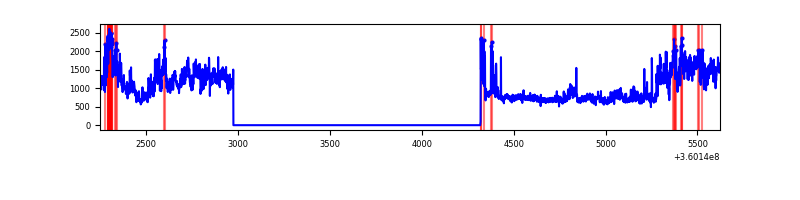 |
Top three noisy pixels from each quadrant. If the there are fewer than three noisy pixels in the level2.evt file, extra rows are filled as -1
| Pixel properties | Quadrant properties | ||||||
|---|---|---|---|---|---|---|---|
| Quadrant | DetID | PixID | Counts | Sigma | Mean | Median | Sigma |
| A | 15 | 174 | 125290 | 2042.7 | 305 | 300 | 61.2 |
| A | 0 | 13 | 77954 | 1269.09 | 305 | 300 | 61.2 |
| A | 8 | 192 | 9814 | 155.49 | 305 | 300 | 61.2 |
| B | 6 | 159 | 542162 | 9583.09 | 294 | 287 | 56.5 |
| B | 4 | 81 | 106401 | 1876.63 | 294 | 287 | 56.5 |
| B | 12 | 111 | 6299 | 106.32 | 294 | 287 | 56.5 |
| C | 14 | 238 | 49169 | 718.34 | 292 | 295 | 68.0 |
| C | 3 | 233 | 44233 | 645.79 | 292 | 295 | 68.0 |
| C | 0 | 10 | 41970 | 612.53 | 292 | 295 | 68.0 |
| D | 8 | 195 | 916806 | 13221.67 | 295 | 288 | 69.3 |
| D | 12 | 218 | 51773 | 742.72 | 295 | 288 | 69.3 |
| D | 2 | 250 | 27593 | 393.9 | 295 | 288 | 69.3 |
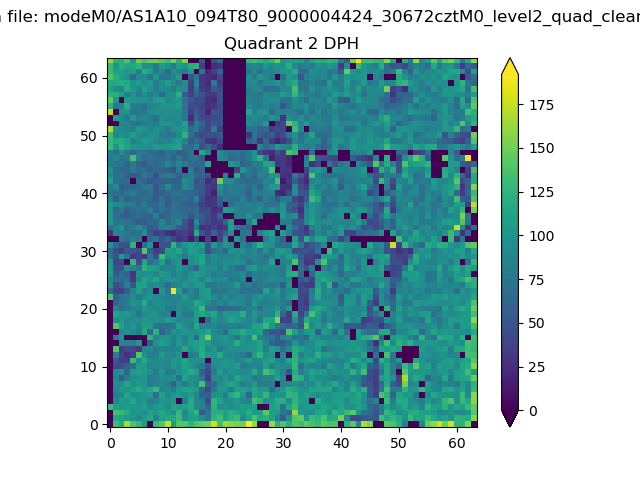
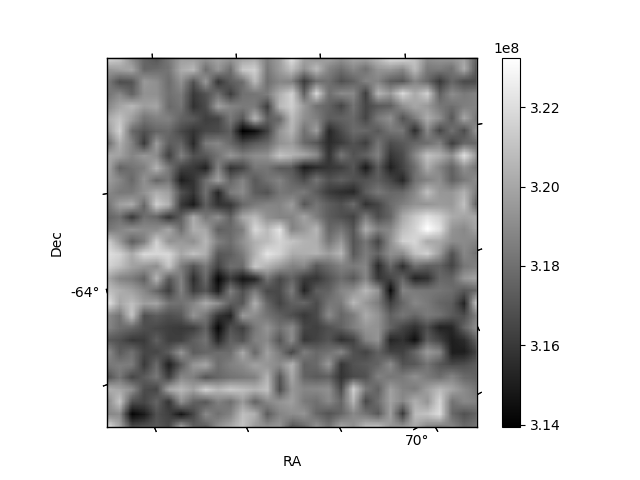
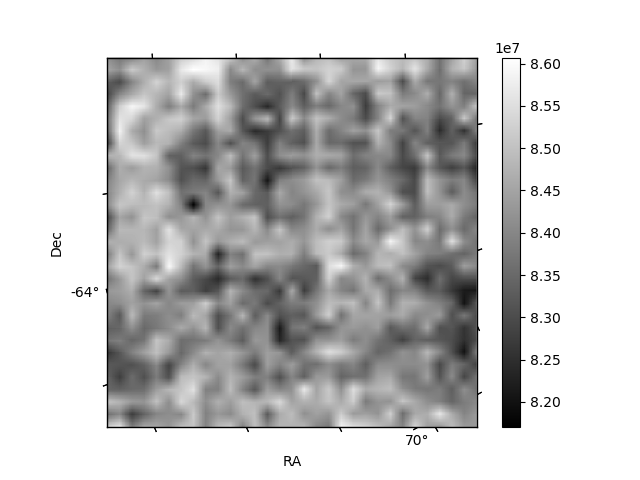
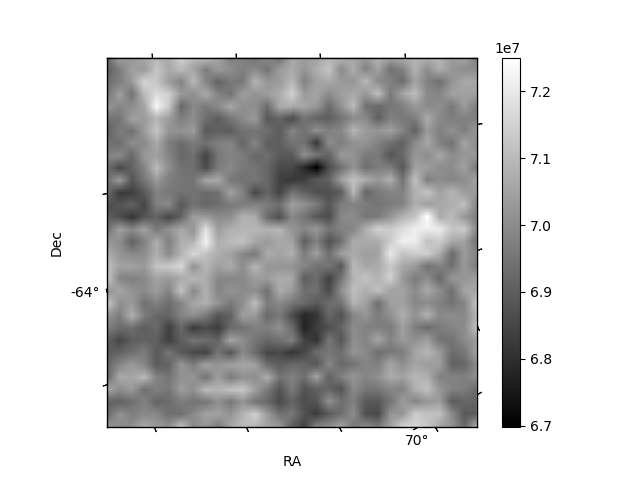
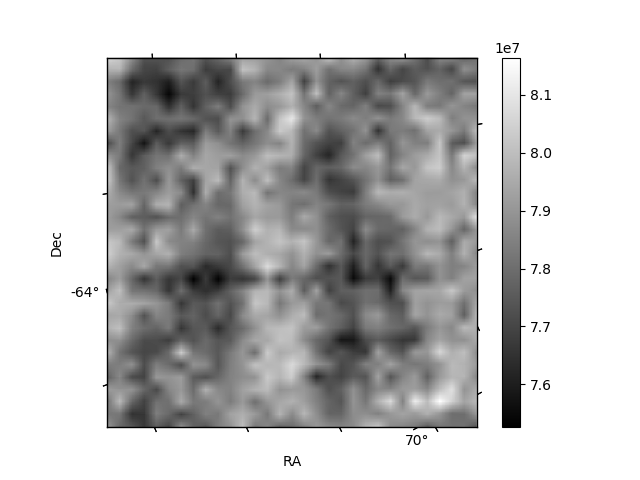
Histogram calculated using DETX and DETY for each event in the final _common_clean file
| Quadrant A | 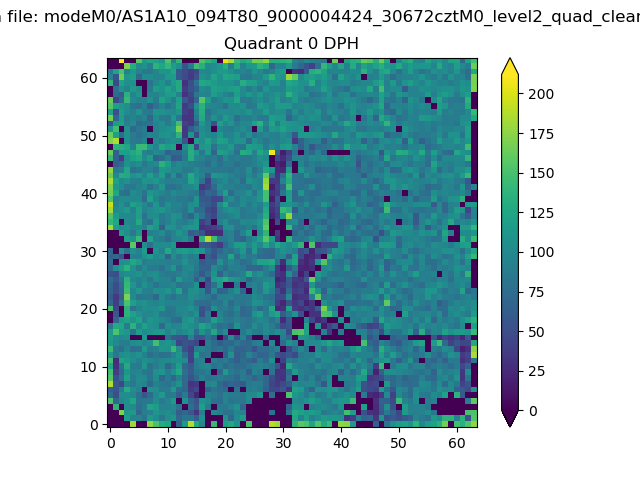 |
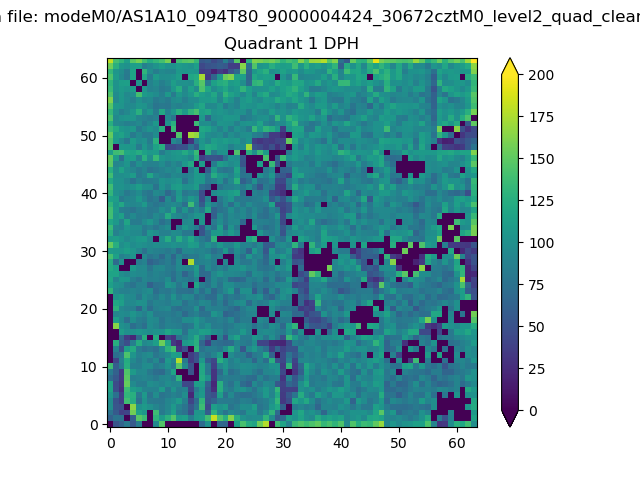 |
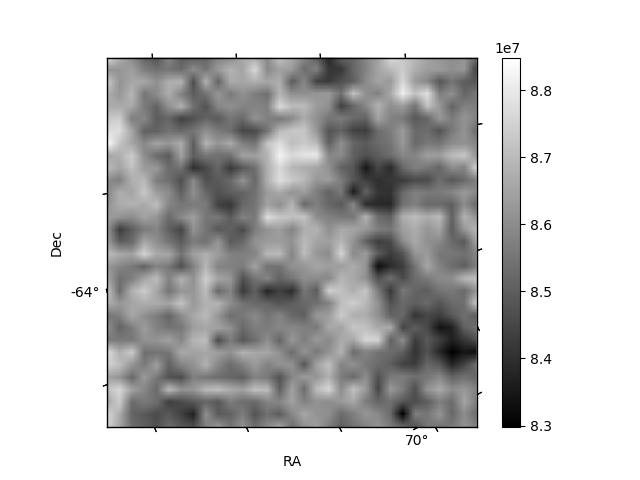
Quadrant B |
|---|---|---|---|
| Quadrant D | 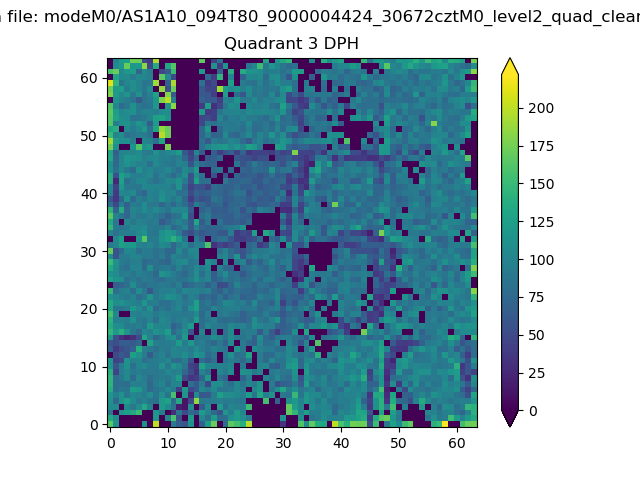 |
 |
Quadrant C |
| Plot type | Count rate plots | Images |
|---|---|---|
| Comparison with Poisson distribution Blue bars denote a histogram of data divided into 1 sec bins. Red curve is a Poisson curve with rate = median count rate of data. |
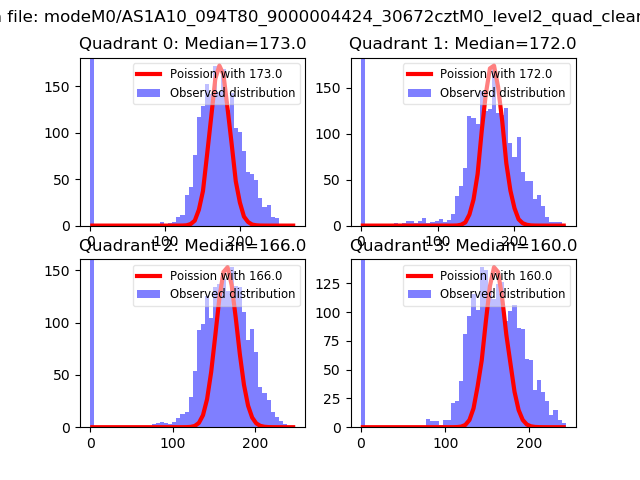 |
 |
| Quadrant-wise count rates Data is divided into 100 sec bins |
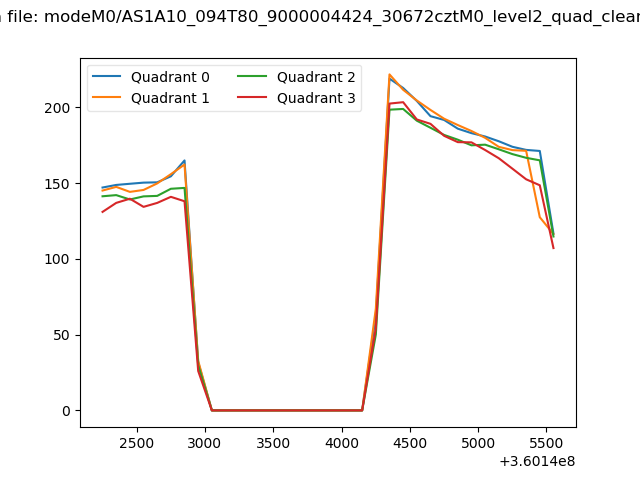 |
|
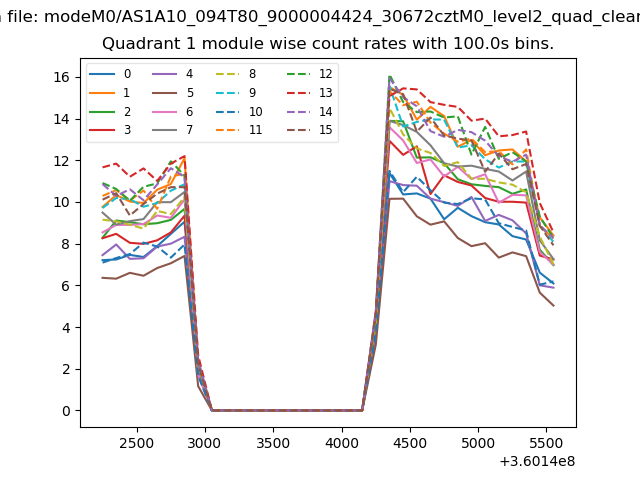
| Module-wise count rates for Quadrant A Data is divided into 100 sec bins |
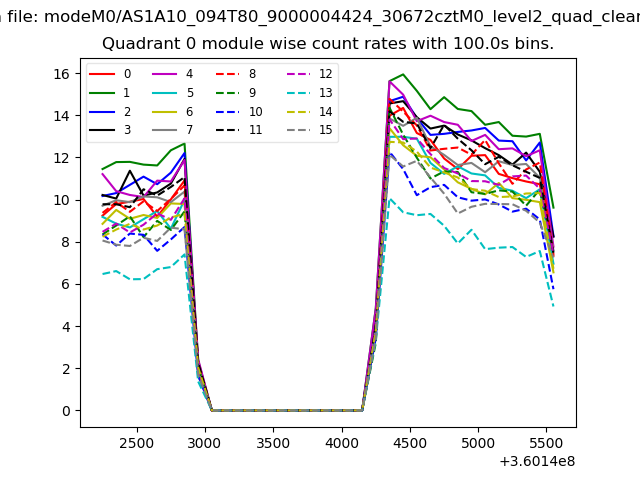 |
 |
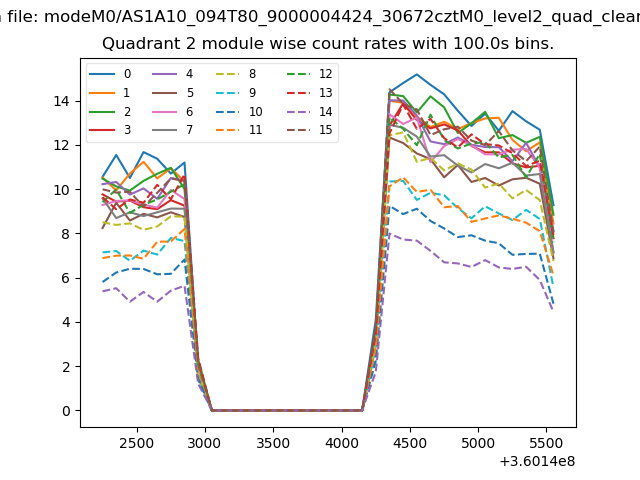
| Module-wise count rates for Quadrant B Data is divided into 100 sec bins |
 |
 |
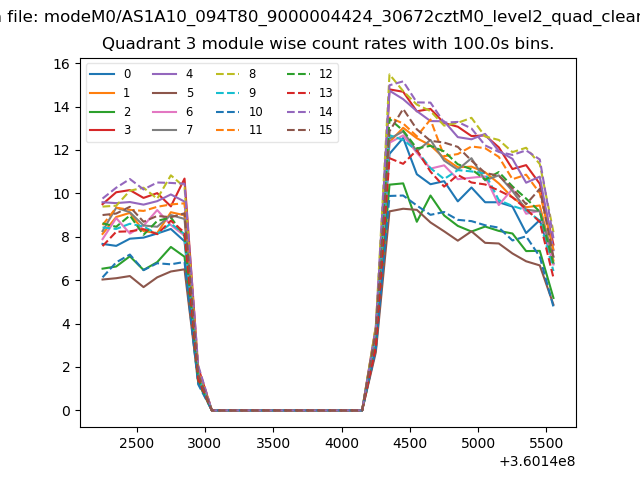
| Module-wise count rates for Quadrant C Data is divided into 100 sec bins |
 |
 |
| Module-wise count rates for Quadrant D Data is divided into 100 sec bins |
 |
 |
| Parameter | Plot |
|---|---|
| CZT HV Monitor | 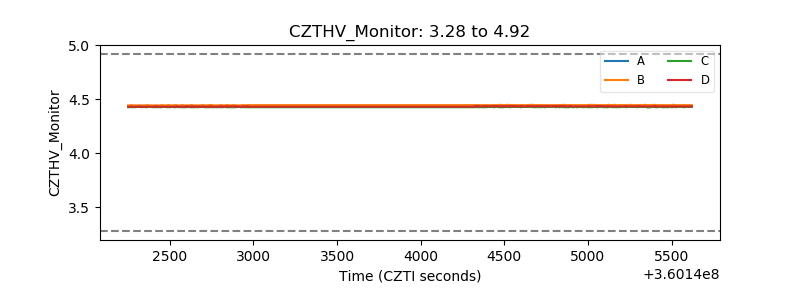 |
| D_VDD | 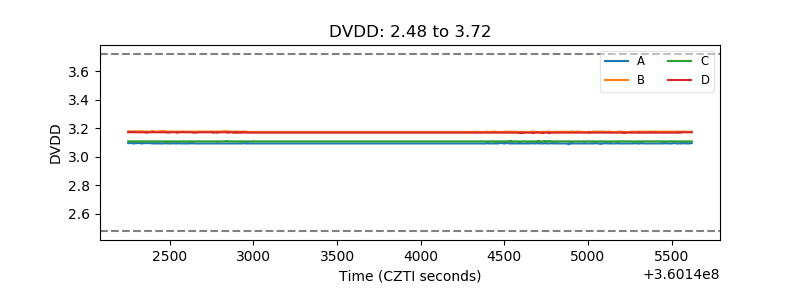 |
| Temperature 1 | 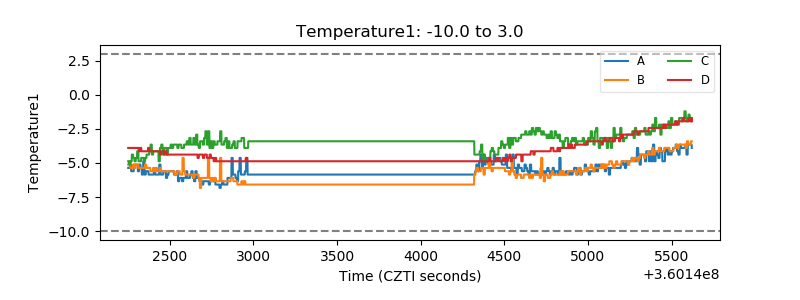 |
| Veto HV Monitor | 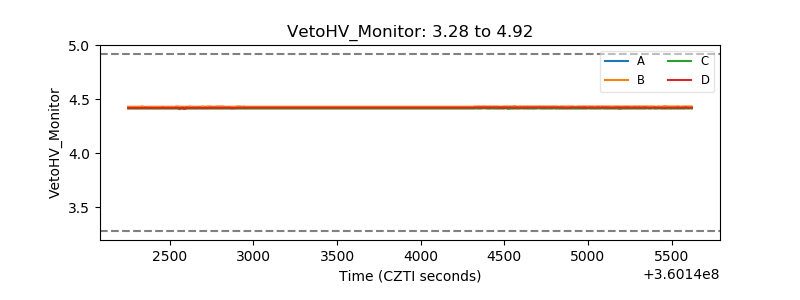 |
| Veto LLD | 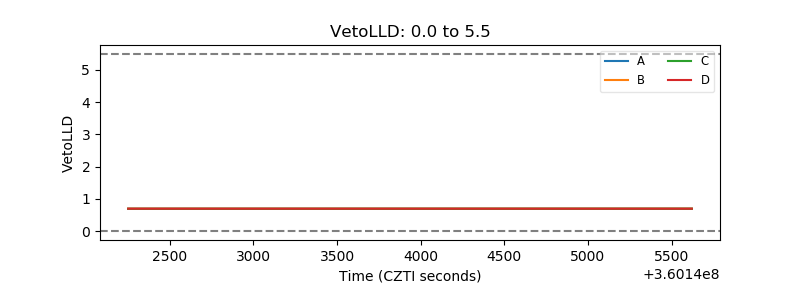 |
| Alpha Counter | 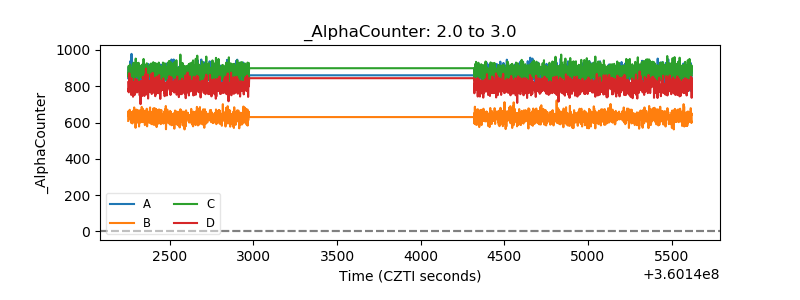 |
| _CPM_Rate | 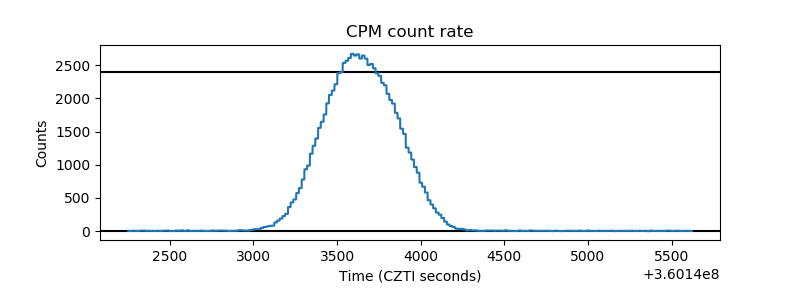 |
| CZT Counter | 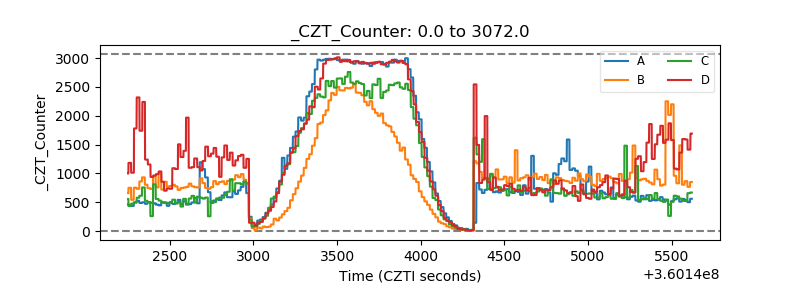 |
| +2.5 Volts monitor |  |
| +5 Volts monitor |  |
| _ROLL_ROT | 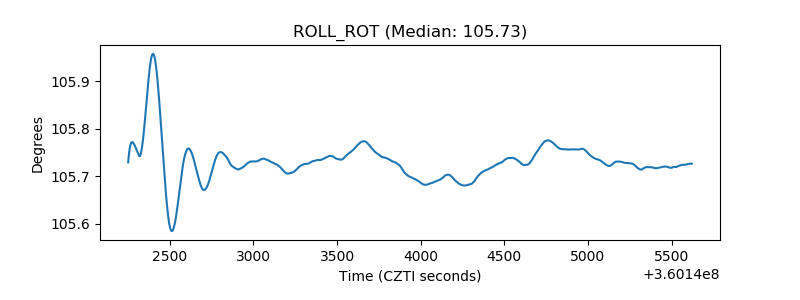 |
| _Roll_DEC | 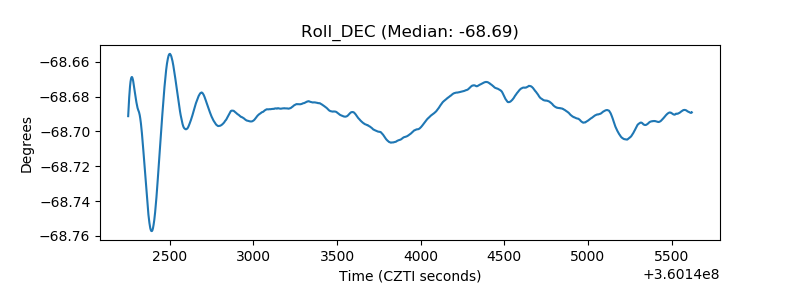 |
| _Roll_RA | 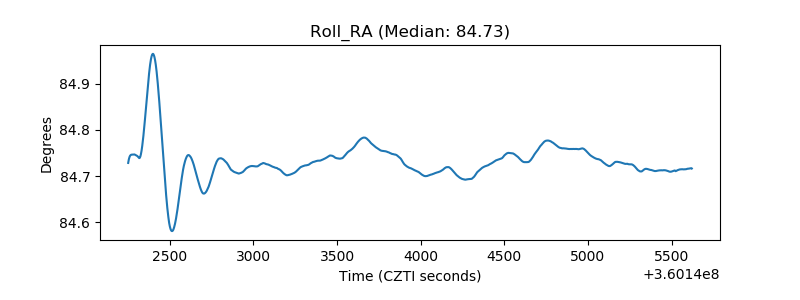 |
| Veto Counter | 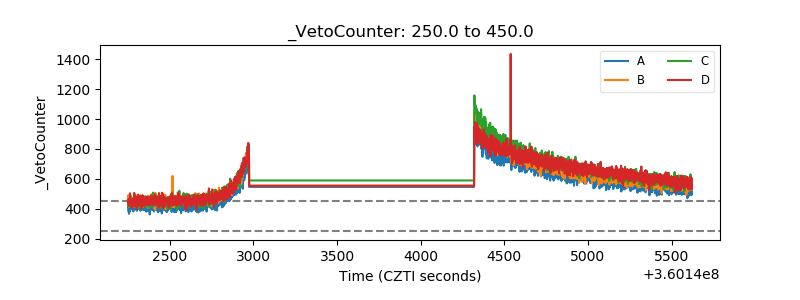 |