| Param | Original file | Final file |
|---|---|---|
| Filename | modeM0/AS1A10_094T80_9000004424_30673cztM0_level2.evt | modeM0/AS1A10_094T80_9000004424_30673cztM0_level2_quad_clean.evt |
| Size (bytes) | 674,009,280 | 137,050,560 |
| Size | 642.8 MB | 130.7 MB |
| Events in quadrant A | 3,528,073 | 974,764 |
| Events in quadrant B | 5,060,929 | 954,821 |
| Events in quadrant C | 3,333,180 | 937,854 |
| Events in quadrant D | 8,080,243 | 858,540 |
| Mode M9 | |||
|---|---|---|---|
| Quadrant | BADHDUFLAG | Total packets | Discarded packets |
| A | 0 | 13 | 0 |
| B | 0 | 13 | 0 |
| C | 0 | 13 | 0 |
| D | 0 | 13 | 0 |
| Mode SS | |||
|---|---|---|---|
| Quadrant | BADHDUFLAG | Total packets | Discarded packets |
| A | 0 | 124 | 0 |
| B | 0 | 124 | 0 |
| C | 0 | 124 | 0 |
| D | 0 | 124 | 0 |
| Mode M0 | |||
|---|---|---|---|
| Quadrant | BADHDUFLAG | Total packets | Discarded packets |
| A | 0 | 14191 | 1 |
| B | 0 | 19151 | 1 |
| C | 0 | 13619 | 1 |
| D | 0 | 28350 | 1 |
| Quadrant | Total seconds | Saturated seconds | Saturation percentage |
|---|---|---|---|
| A | 6078 | 138 | 2.270484% |
| B | 6079 | 214 | 3.520316% |
| C | 6079 | 185 | 3.043264% |
| D | 6079 | 970 | 15.956572% |
Noise dominated data is calculated using 1-second bins in cleaned event files. If a bin has >2000 counts, and if more than 50% of those come from <1% of pixels, then it is considered to be noise-dominated and hence unusable.
| Quadrant | # 1 sec bins | Bins with >0 counts | Bins with >2000 counts | High rate bins dominated by noise | Noise dominated (total time) | Noise dominated (detector-on time) | Marked lightcurve |
|---|---|---|---|---|---|---|---|
| A | 7383 | 6079 | 23 | 23 | 0.31% | 0.38% | 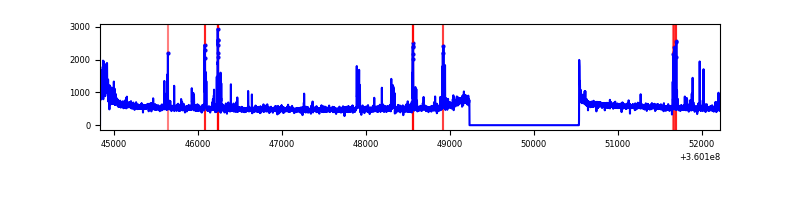 |
| B | 7384 | 6080 | 40 | 40 | 0.54% | 0.66% | 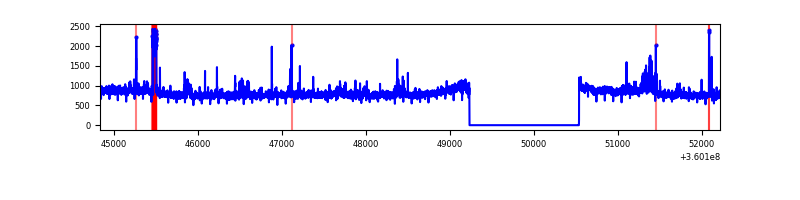 |
| C | 7384 | 6080 | 3 | 3 | 0.04% | 0.05% | 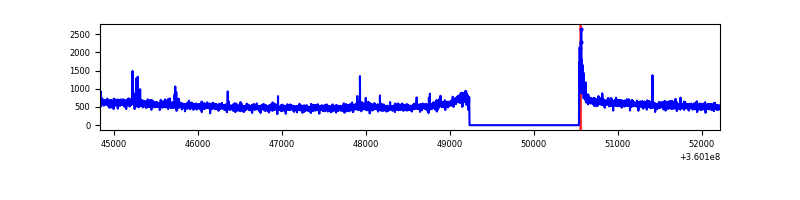 |
| D | 7384 | 6080 | 867 | 867 | 11.74% | 14.26% | 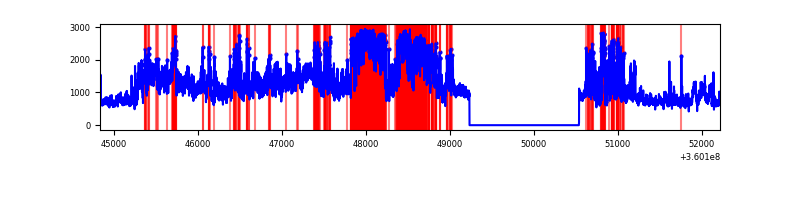 |
Top three noisy pixels from each quadrant. If the there are fewer than three noisy pixels in the level2.evt file, extra rows are filled as -1
| Pixel properties | Quadrant properties | ||||||
|---|---|---|---|---|---|---|---|
| Quadrant | DetID | PixID | Counts | Sigma | Mean | Median | Sigma |
| A | 0 | 13 | 225367 | 1370.97 | 830 | 817 | 163.8 |
| A | 15 | 174 | 91992 | 556.66 | 830 | 817 | 163.8 |
| A | 13 | 254 | 11441 | 64.86 | 830 | 817 | 163.8 |
| B | 6 | 159 | 1654967 | 11192.87 | 797 | 778 | 147.8 |
| B | 4 | 81 | 188934 | 1273.13 | 797 | 778 | 147.8 |
| B | 0 | 190 | 50939 | 339.41 | 797 | 778 | 147.8 |
| C | 14 | 238 | 130488 | 723.8 | 785 | 789 | 179.2 |
| C | 3 | 233 | 51951 | 285.51 | 785 | 789 | 179.2 |
| C | 0 | 10 | 45619 | 250.18 | 785 | 789 | 179.2 |
| D | 8 | 195 | 2856054 | 16065.21 | 775 | 756 | 177.7 |
| D | 1 | 52 | 796437 | 4476.86 | 775 | 756 | 177.7 |
| D | 12 | 227 | 793050 | 4457.81 | 775 | 756 | 177.7 |
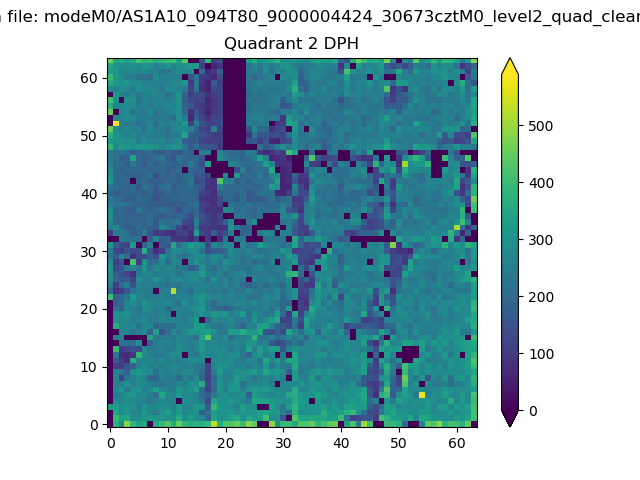
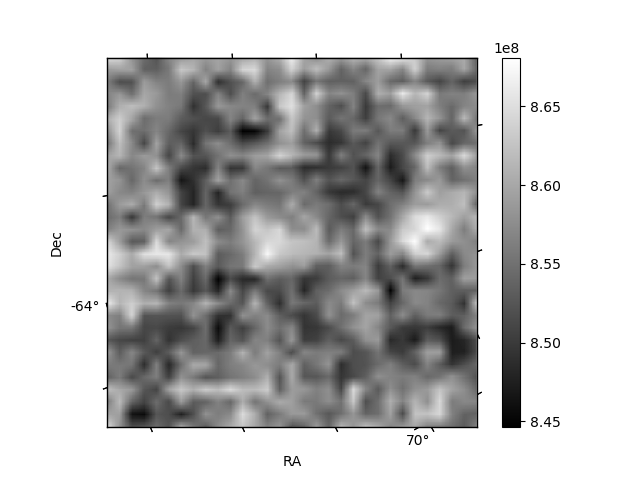
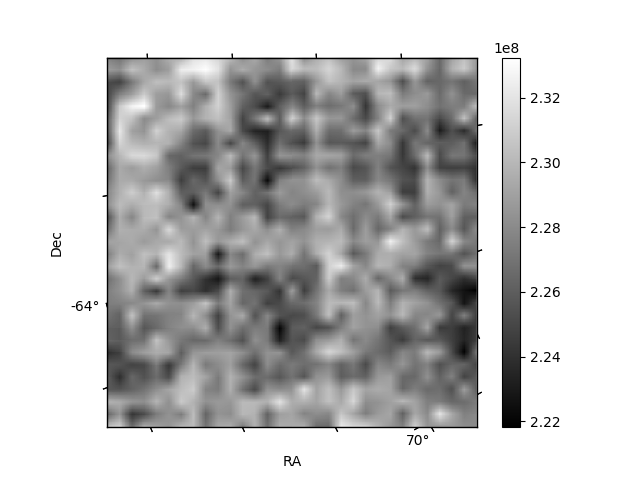
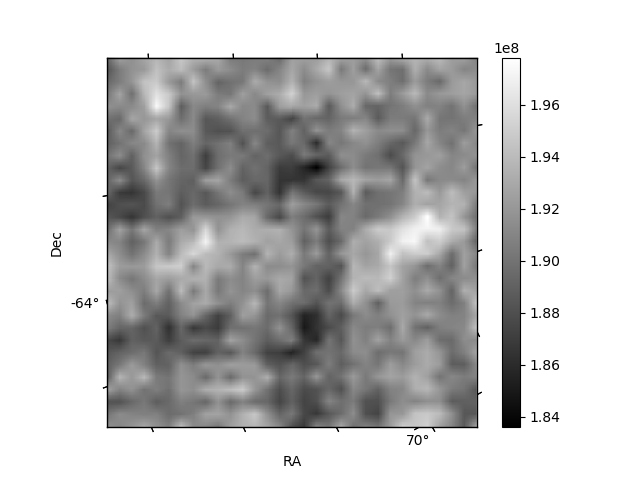
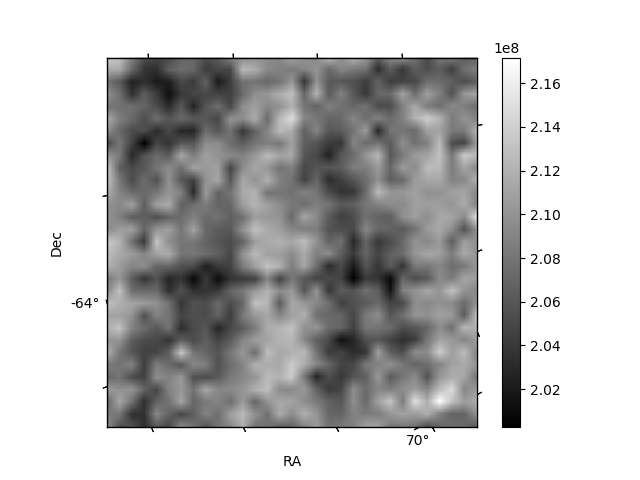
Histogram calculated using DETX and DETY for each event in the final _common_clean file
| Quadrant A | 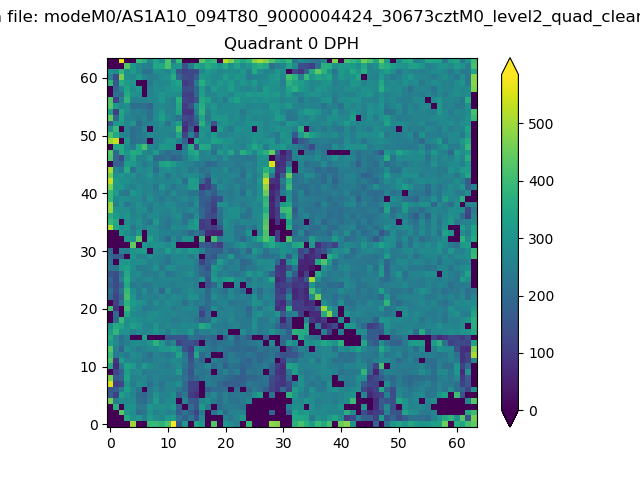 |
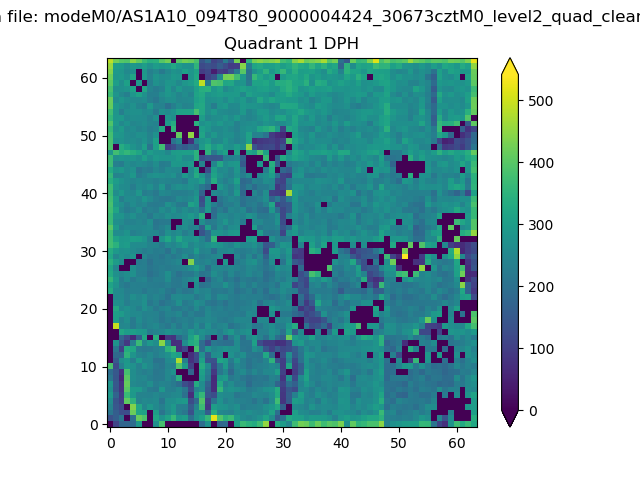 |
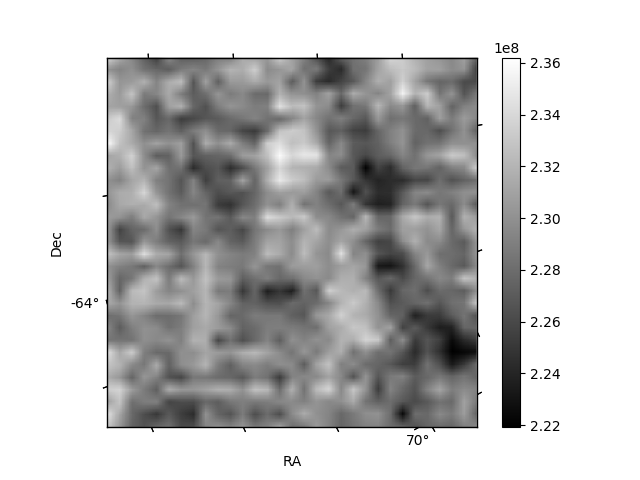
Quadrant B |
|---|---|---|---|
| Quadrant D | 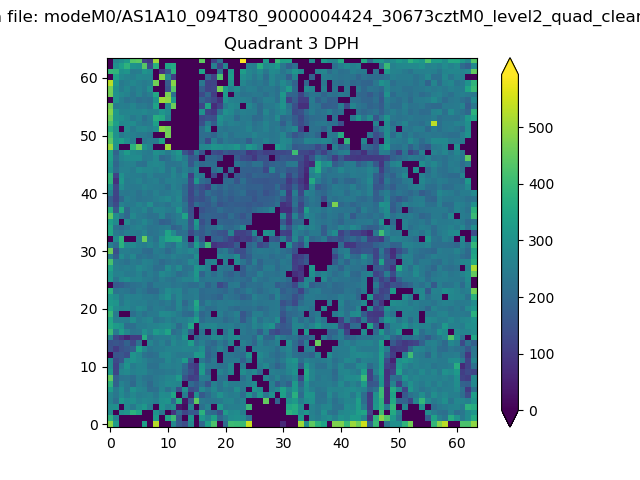 |
 |
Quadrant C |
| Plot type | Count rate plots | Images |
|---|---|---|
| Comparison with Poisson distribution Blue bars denote a histogram of data divided into 1 sec bins. Red curve is a Poisson curve with rate = median count rate of data. |
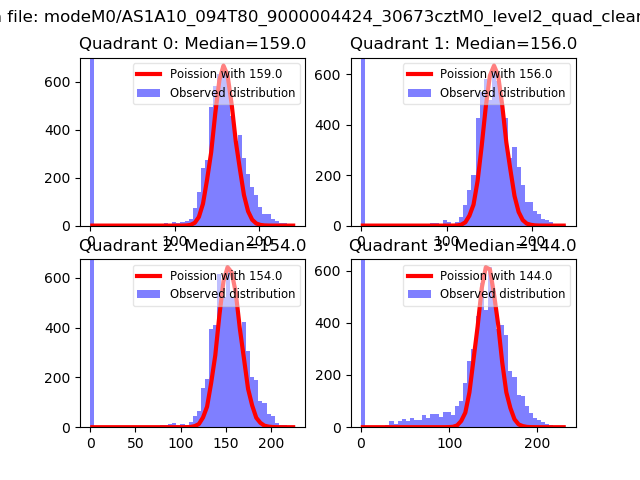 |
 |
| Quadrant-wise count rates Data is divided into 100 sec bins |
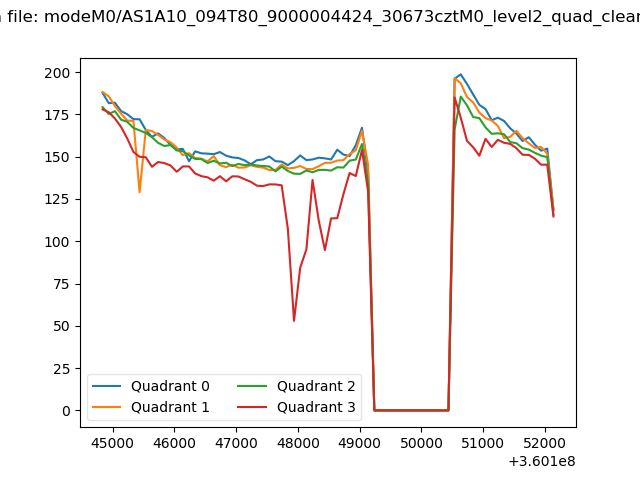 |
|
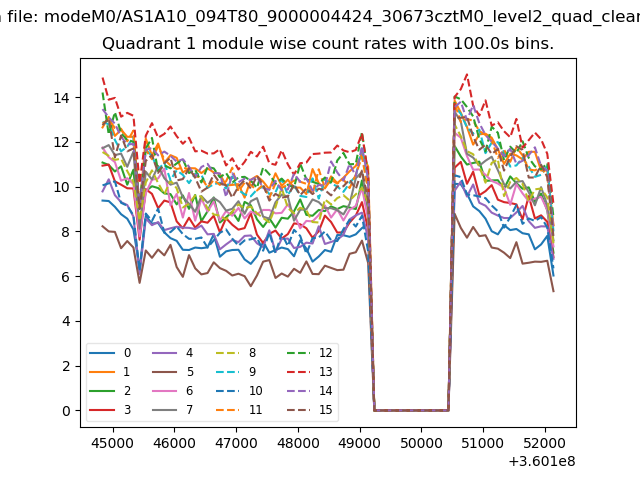
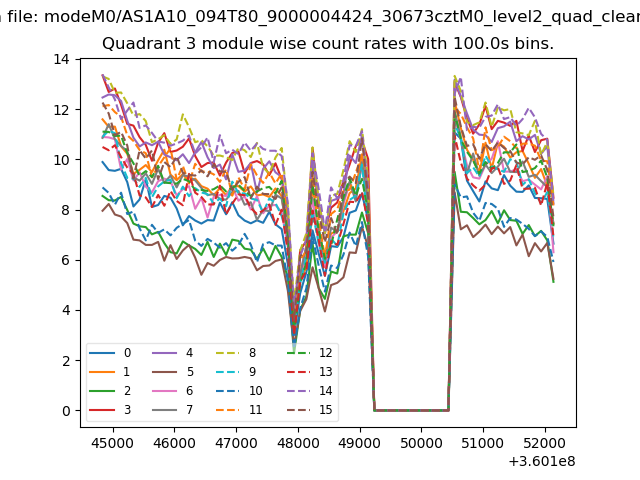
| Module-wise count rates for Quadrant A Data is divided into 100 sec bins |
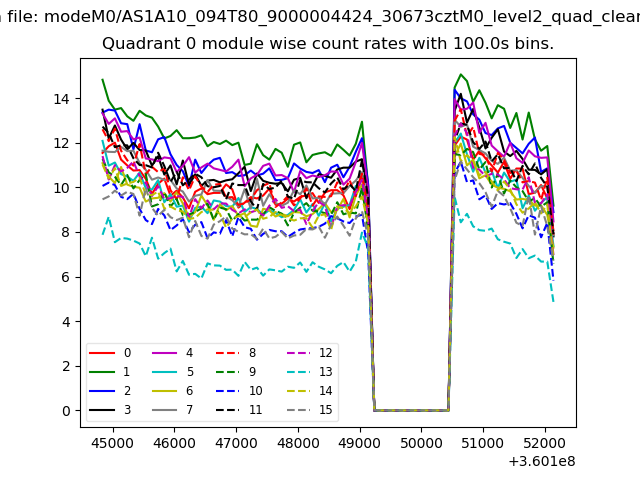 |
 |
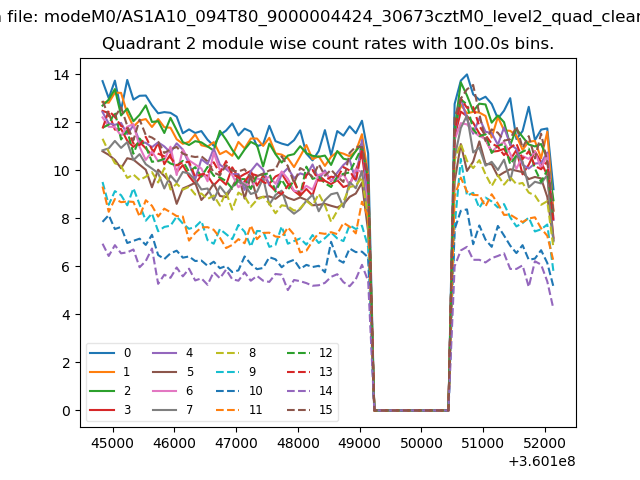
| Module-wise count rates for Quadrant B Data is divided into 100 sec bins |
 |
 |
| Module-wise count rates for Quadrant C Data is divided into 100 sec bins |
 |
 |
| Module-wise count rates for Quadrant D Data is divided into 100 sec bins |
 |
 |
| Parameter | Plot |
|---|---|
| CZT HV Monitor | 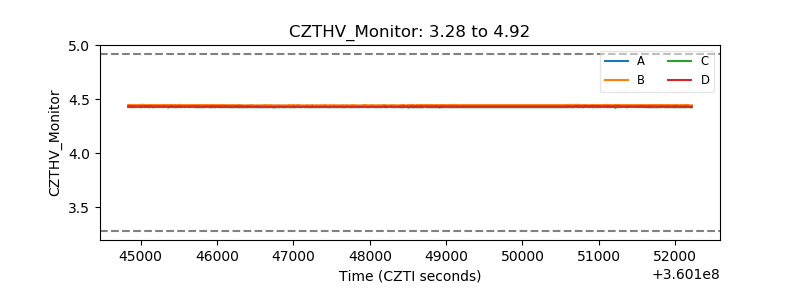 |
| D_VDD | 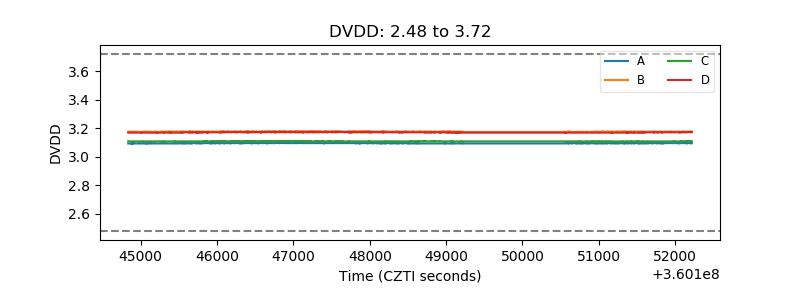 |
| Temperature 1 | 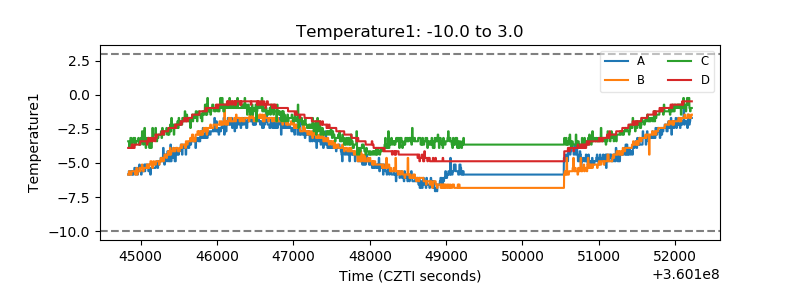 |
| Veto HV Monitor | 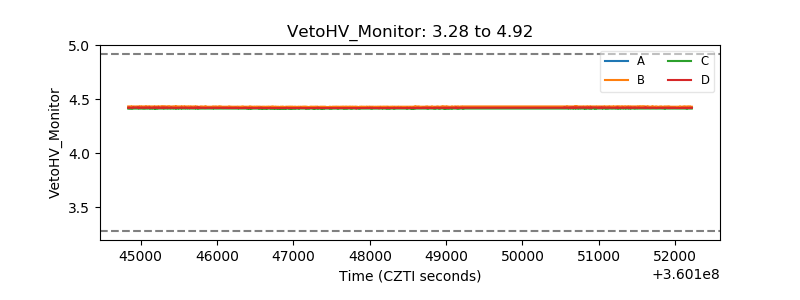 |
| Veto LLD | 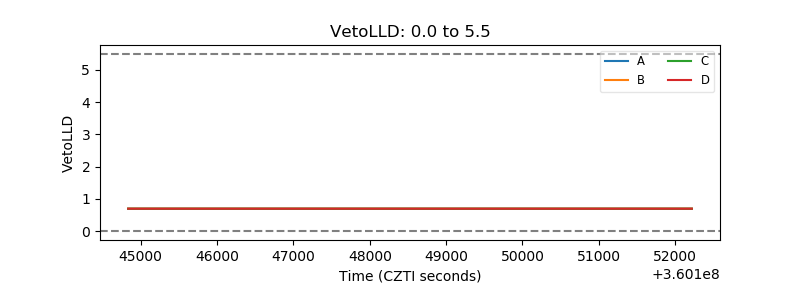 |
| Alpha Counter | 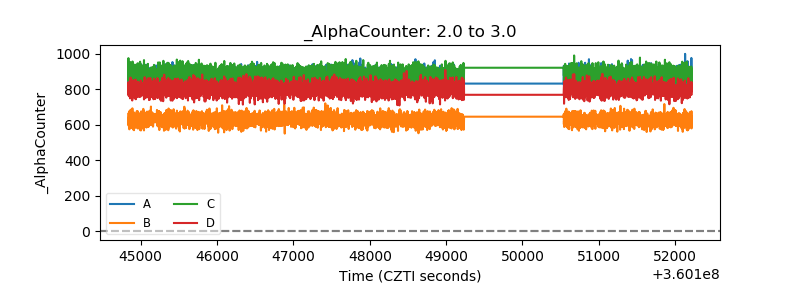 |
| _CPM_Rate | 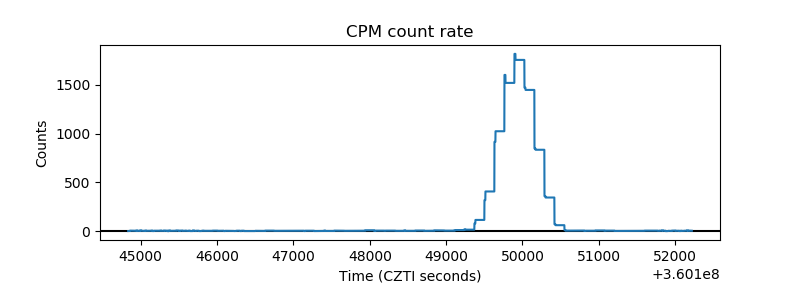 |
| CZT Counter | 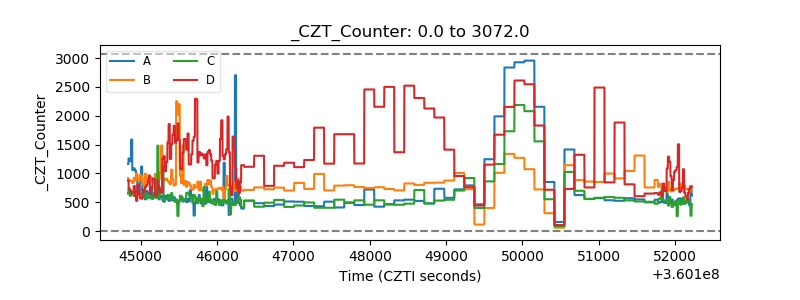 |
| +2.5 Volts monitor | 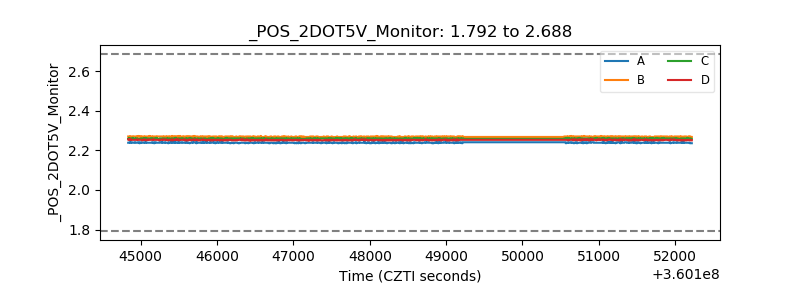 |
| +5 Volts monitor | 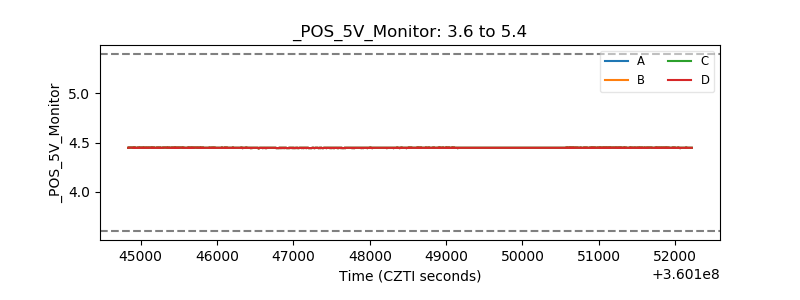 |
| _ROLL_ROT | 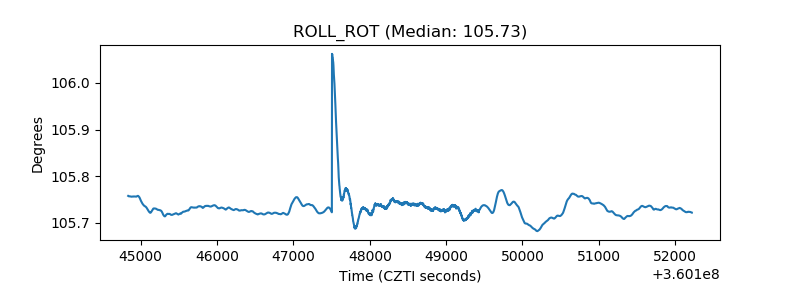 |
| _Roll_DEC | 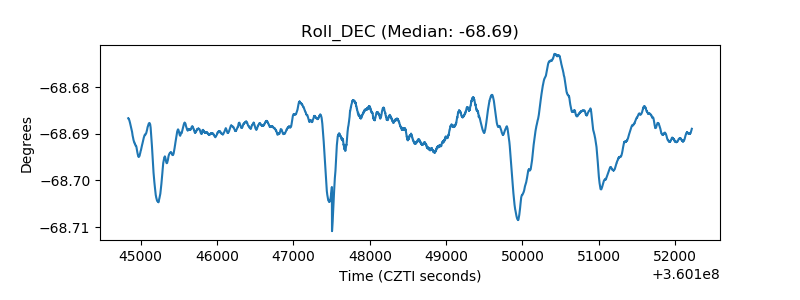 |
| _Roll_RA | 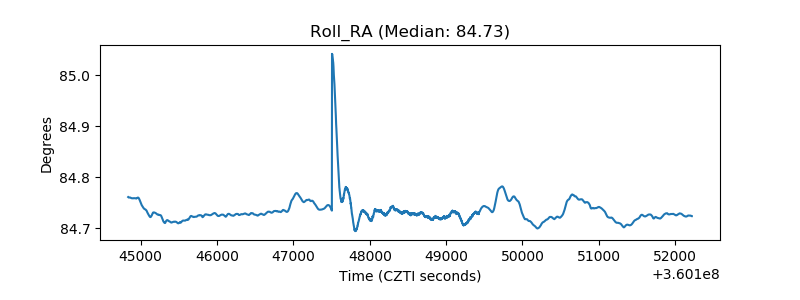 |
| Veto Counter | 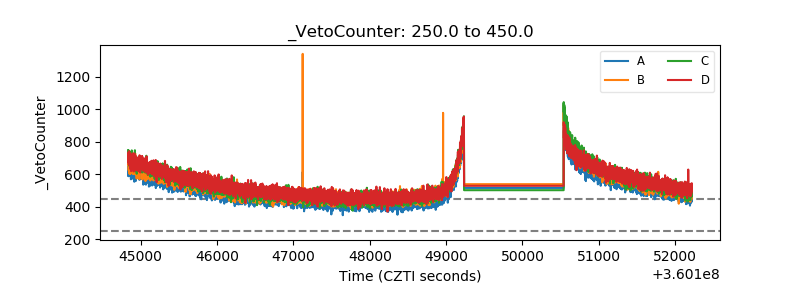 |