| Param | Original file | Final file |
|---|---|---|
| Filename | modeM0/AS1A10_094T80_9000004424_30675cztM0_level2.evt | modeM0/AS1A10_094T80_9000004424_30675cztM0_level2_quad_clean.evt |
| Size (bytes) | 641,306,880 | 122,771,520 |
| Size | 611.6 MB | 117.1 MB |
| Events in quadrant A | 3,007,835 | 861,127 |
| Events in quadrant B | 4,634,016 | 847,430 |
| Events in quadrant C | 3,272,970 | 821,532 |
| Events in quadrant D | 8,096,304 | 762,732 |
| Mode M9 | |||
|---|---|---|---|
| Quadrant | BADHDUFLAG | Total packets | Discarded packets |
| A | 0 | 10 | 0 |
| B | 0 | 10 | 0 |
| C | 0 | 10 | 0 |
| D | 0 | 10 | 0 |
| Mode SS | |||
|---|---|---|---|
| Quadrant | BADHDUFLAG | Total packets | Discarded packets |
| A | 0 | 122 | 0 |
| B | 0 | 122 | 0 |
| C | 0 | 122 | 0 |
| D | 0 | 122 | 0 |
| Mode M0 | |||
|---|---|---|---|
| Quadrant | BADHDUFLAG | Total packets | Discarded packets |
| A | 0 | 12708 | 1 |
| B | 0 | 18502 | 1 |
| C | 0 | 13426 | 1 |
| D | 0 | 28384 | 2 |
| Quadrant | Total seconds | Saturated seconds | Saturation percentage |
|---|---|---|---|
| A | 6096 | 62 | 1.017060% |
| B | 6097 | 126 | 2.066590% |
| C | 6097 | 114 | 1.869772% |
| D | 6096 | 686 | 11.253281% |
Noise dominated data is calculated using 1-second bins in cleaned event files. If a bin has >2000 counts, and if more than 50% of those come from <1% of pixels, then it is considered to be noise-dominated and hence unusable.
| Quadrant | # 1 sec bins | Bins with >0 counts | Bins with >2000 counts | High rate bins dominated by noise | Noise dominated (total time) | Noise dominated (detector-on time) | Marked lightcurve |
|---|---|---|---|---|---|---|---|
| A | 7041 | 6097 | 5 | 5 | 0.07% | 0.08% | 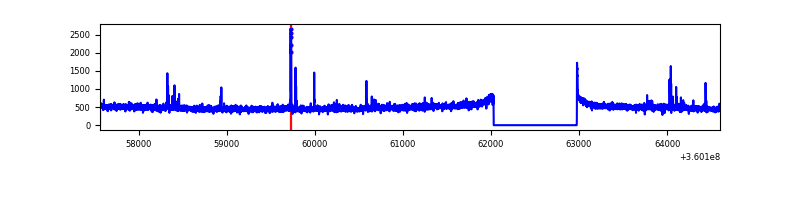 |
| B | 7042 | 6098 | 2 | 2 | 0.03% | 0.03% | 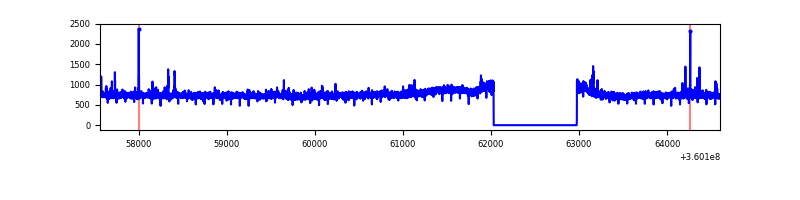 |
| C | 7042 | 6098 | 2 | 2 | 0.03% | 0.03% | 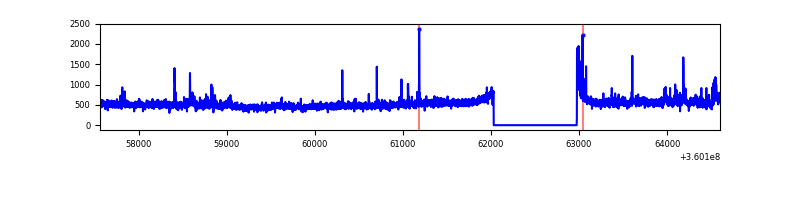 |
| D | 7041 | 6097 | 628 | 628 | 8.92% | 10.30% | 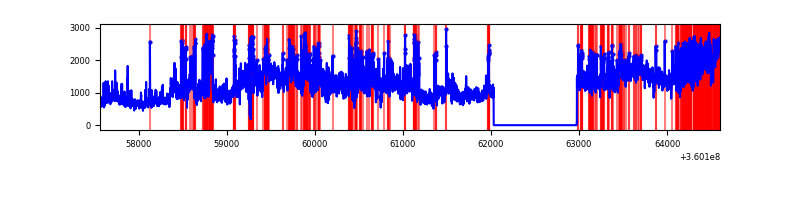 |
Top three noisy pixels from each quadrant. If the there are fewer than three noisy pixels in the level2.evt file, extra rows are filled as -1
| Pixel properties | Quadrant properties | ||||||
|---|---|---|---|---|---|---|---|
| Quadrant | DetID | PixID | Counts | Sigma | Mean | Median | Sigma |
| A | 0 | 13 | 59863 | 388.74 | 762 | 746 | 152.1 |
| A | 13 | 254 | 11172 | 68.56 | 762 | 746 | 152.1 |
| A | 8 | 192 | 9478 | 57.42 | 762 | 746 | 152.1 |
| B | 6 | 159 | 1650111 | 11768.42 | 742 | 723 | 140.2 |
| B | 4 | 81 | 32532 | 226.95 | 742 | 723 | 140.2 |
| B | 0 | 190 | 25795 | 178.89 | 742 | 723 | 140.2 |
| C | 3 | 233 | 293154 | 1770.4 | 715 | 719 | 165.2 |
| C | 14 | 238 | 118635 | 713.86 | 715 | 719 | 165.2 |
| C | 0 | 10 | 44796 | 266.84 | 715 | 719 | 165.2 |
| D | 8 | 195 | 4020256 | 24122.99 | 709 | 690 | 166.6 |
| D | 13 | 249 | 433948 | 2600.15 | 709 | 690 | 166.6 |
| D | 1 | 52 | 428886 | 2569.77 | 709 | 690 | 166.6 |
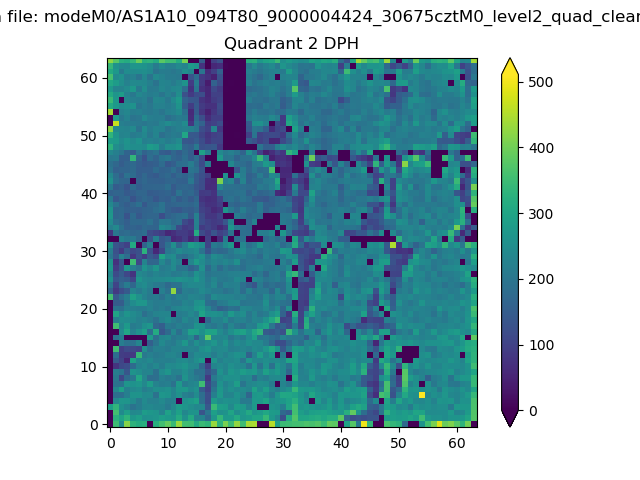
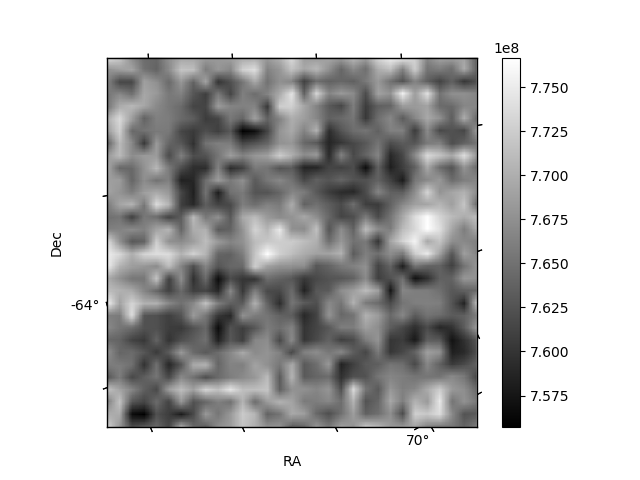
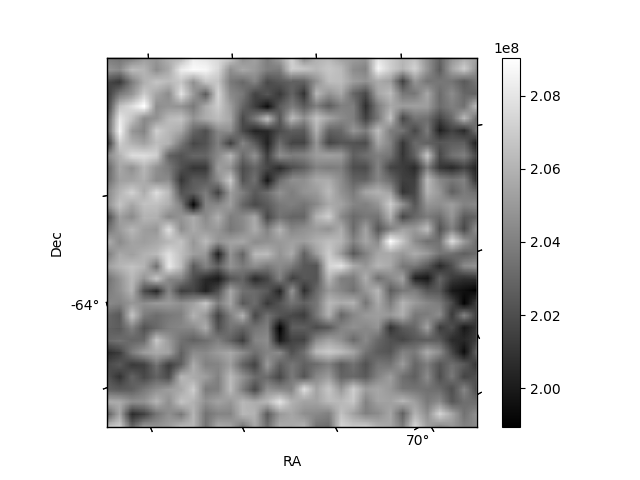
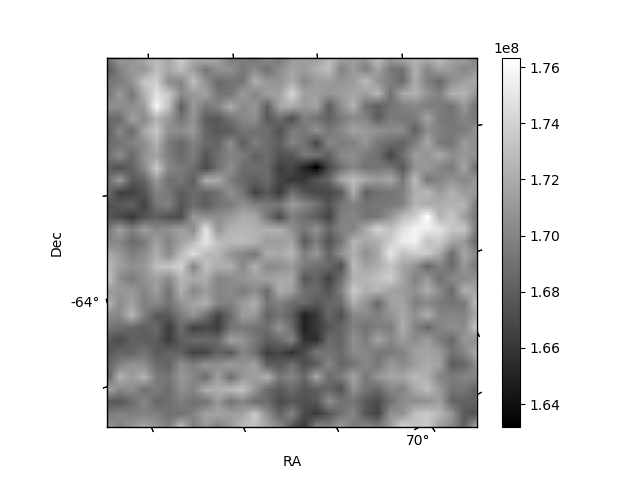
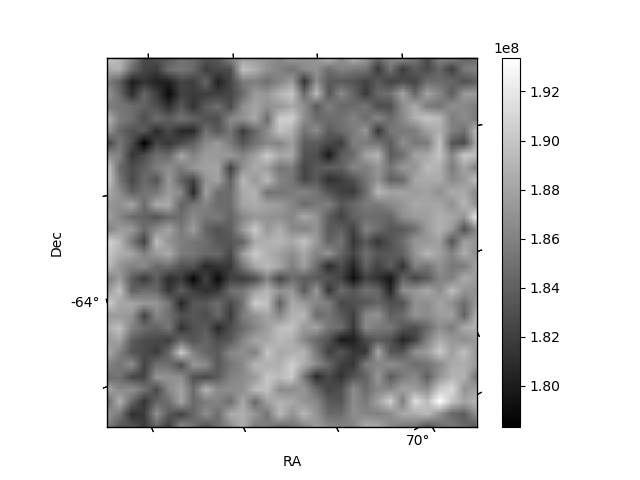
Histogram calculated using DETX and DETY for each event in the final _common_clean file
| Quadrant A | 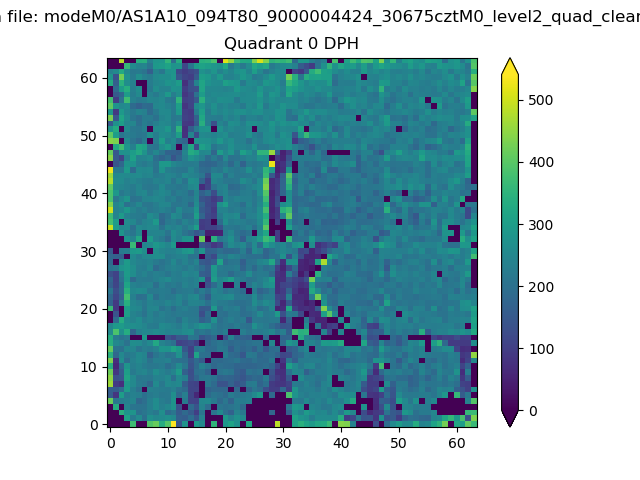 |
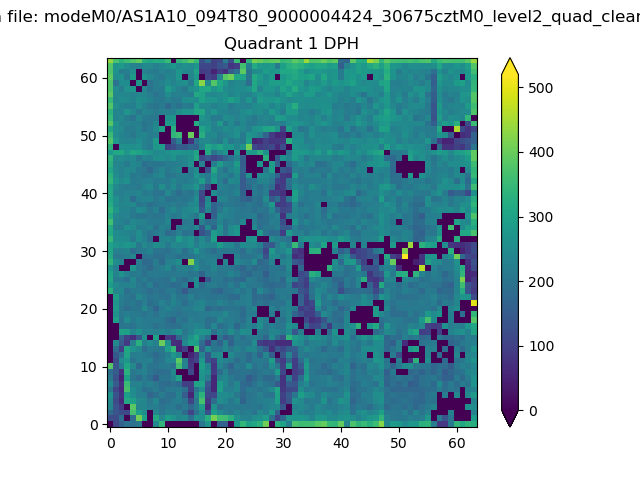 |
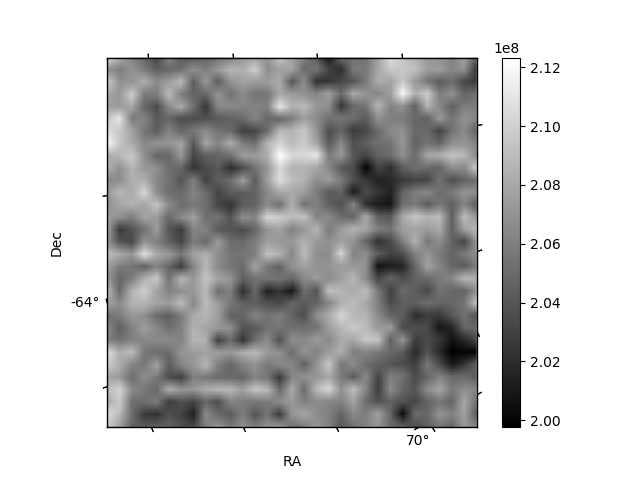
Quadrant B |
|---|---|---|---|
| Quadrant D | 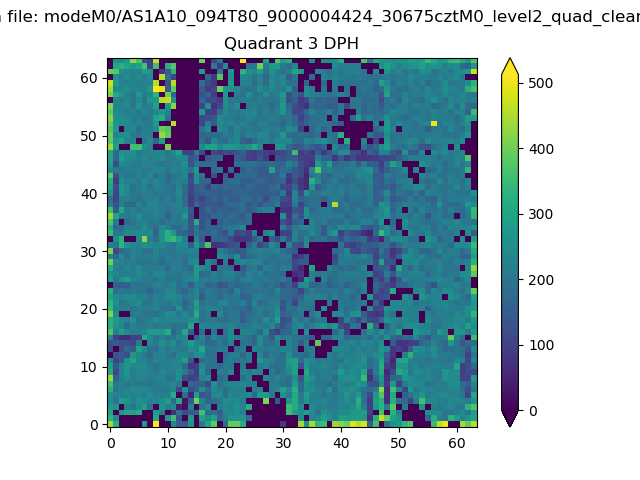 |
 |
Quadrant C |
| Plot type | Count rate plots | Images |
|---|---|---|
| Comparison with Poisson distribution Blue bars denote a histogram of data divided into 1 sec bins. Red curve is a Poisson curve with rate = median count rate of data. |
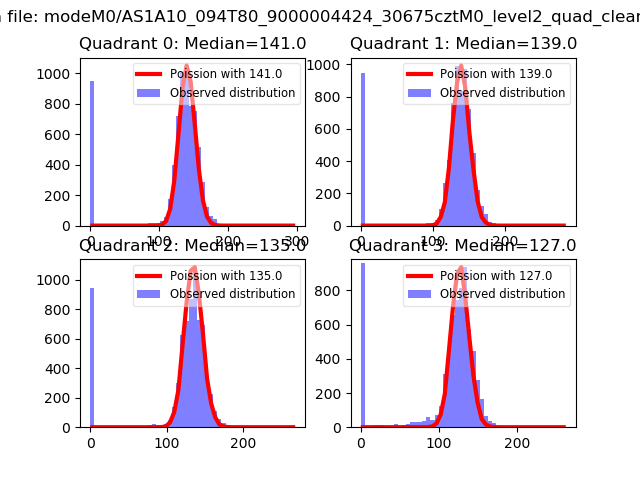 |
 |
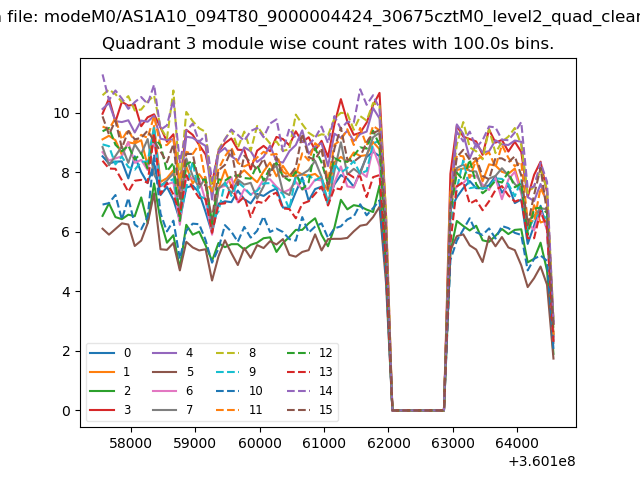
| Quadrant-wise count rates Data is divided into 100 sec bins |
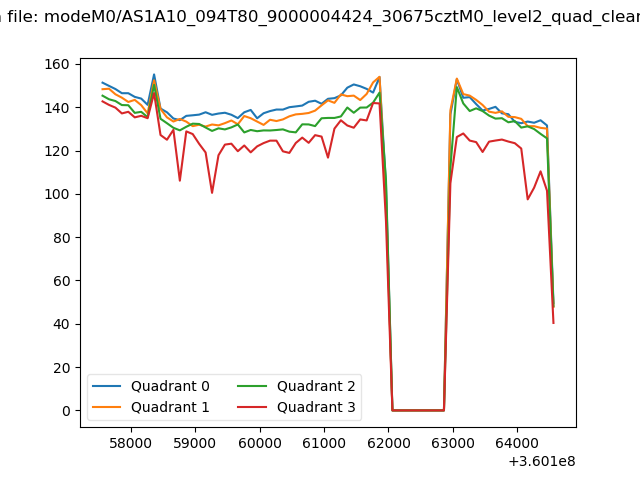 |
|
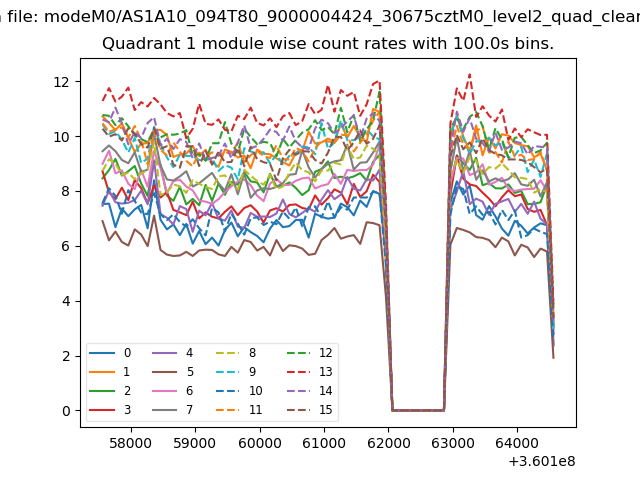
| Module-wise count rates for Quadrant A Data is divided into 100 sec bins |
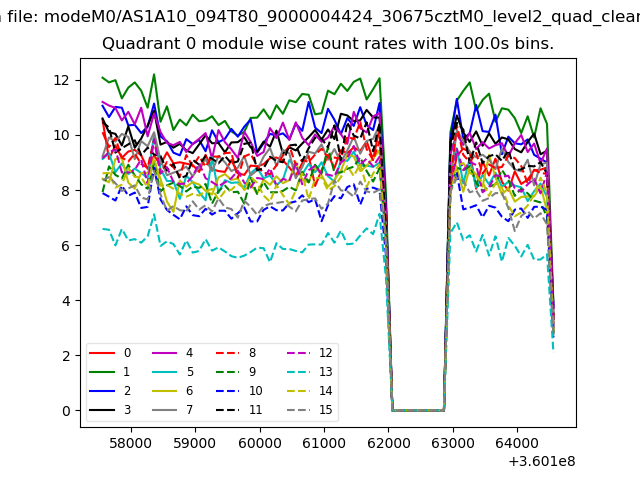 |
 |
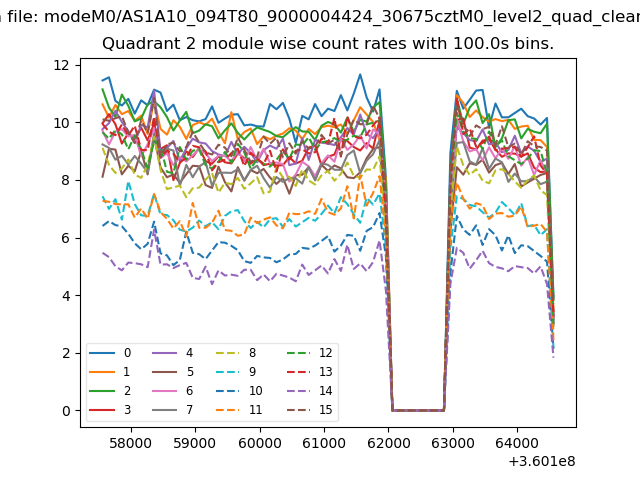
| Module-wise count rates for Quadrant B Data is divided into 100 sec bins |
 |
 |
| Module-wise count rates for Quadrant C Data is divided into 100 sec bins |
 |
 |
| Module-wise count rates for Quadrant D Data is divided into 100 sec bins |
 |
 |
| Parameter | Plot |
|---|---|
| CZT HV Monitor | 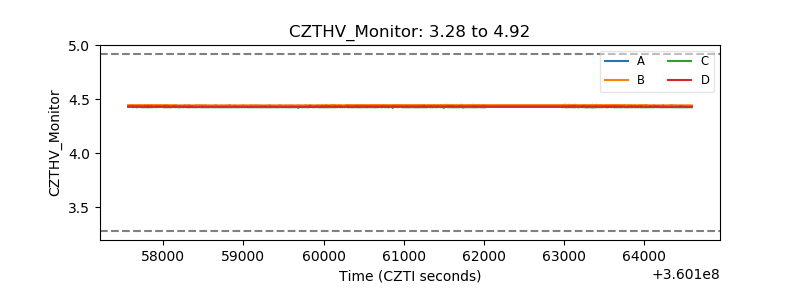 |
| D_VDD | 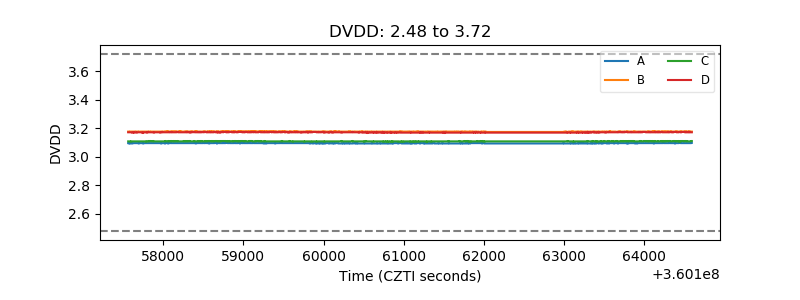 |
| Temperature 1 | 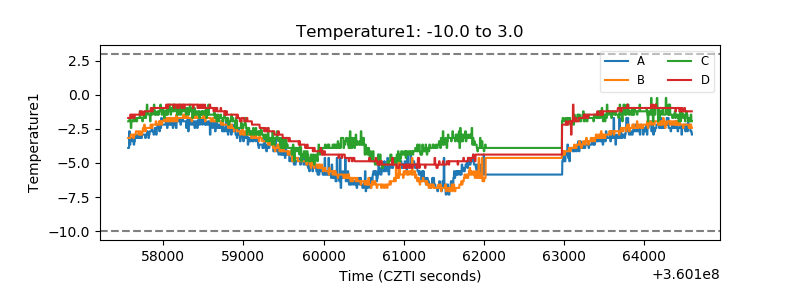 |
| Veto HV Monitor | 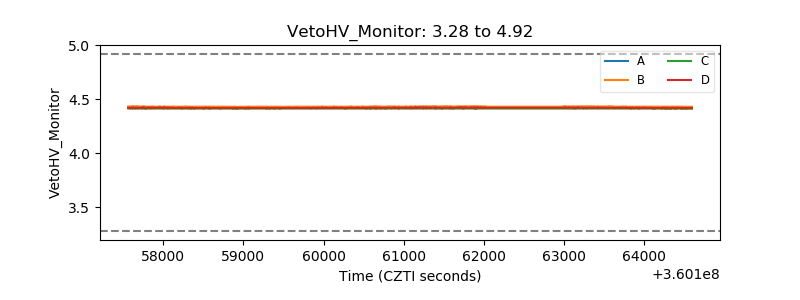 |
| Veto LLD | 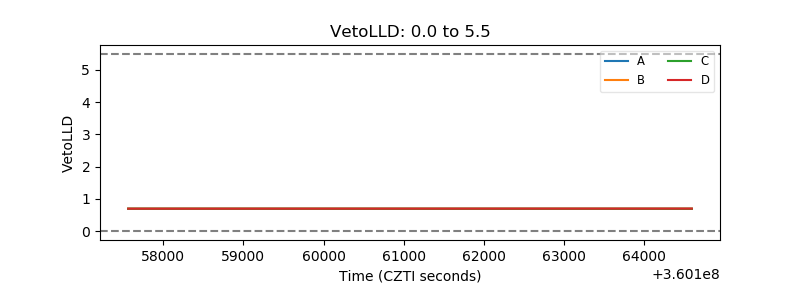 |
| Alpha Counter | 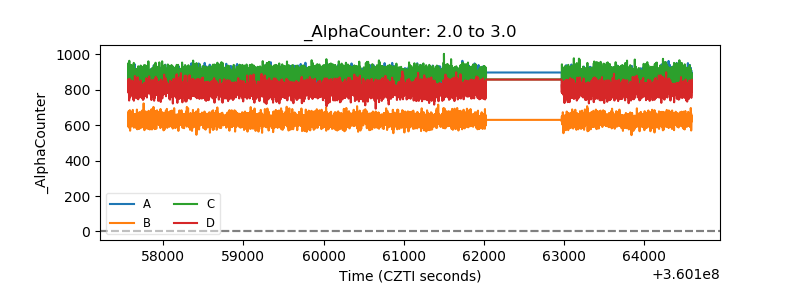 |
| _CPM_Rate | 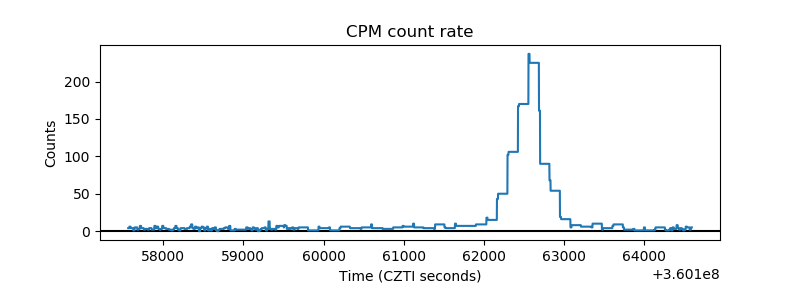 |
| CZT Counter | 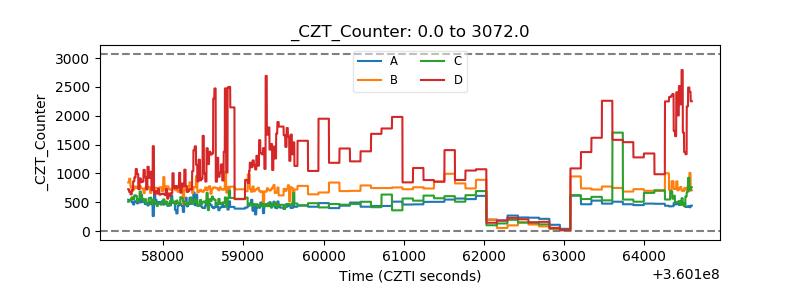 |
| +2.5 Volts monitor |  |
| +5 Volts monitor | 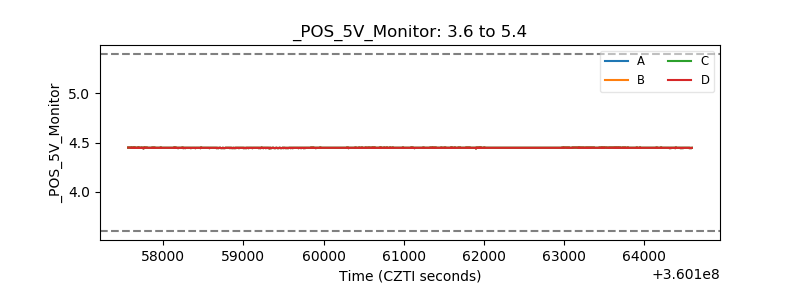 |
| _ROLL_ROT | 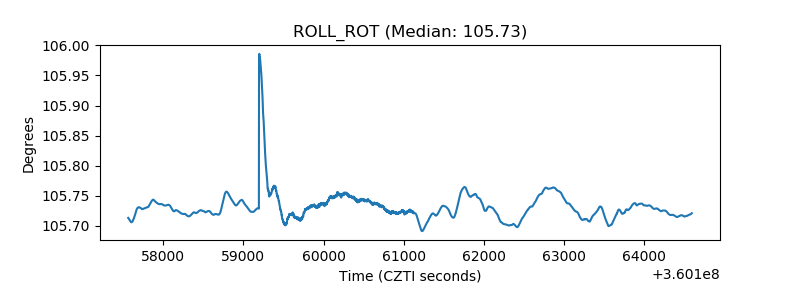 |
| _Roll_DEC |  |
| _Roll_RA | 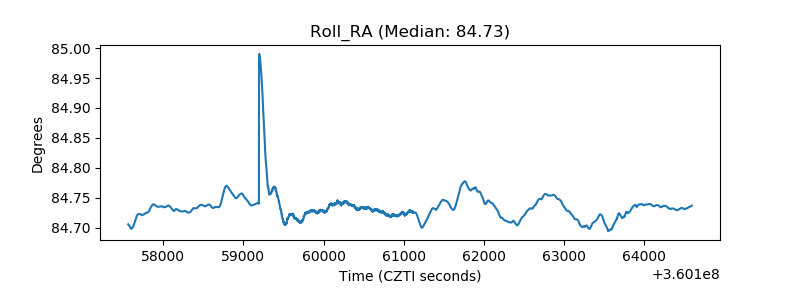 |
| Veto Counter | 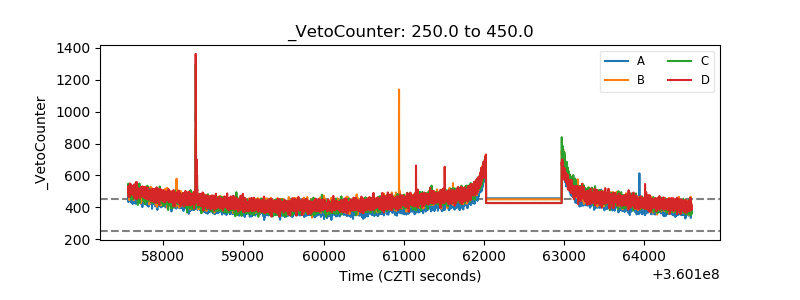 |