| Param | Original file | Final file |
|---|---|---|
| Filename | modeM0/AS1A10_094T80_9000004424_30677cztM0_level2.evt | modeM0/AS1A10_094T80_9000004424_30677cztM0_level2_quad_clean.evt |
| Size (bytes) | 134,081,280 | 21,697,920 |
| Size | 127.9 MB | 20.7 MB |
| Events in quadrant A | 532,774 | 151,193 |
| Events in quadrant B | 863,496 | 147,940 |
| Events in quadrant C | 563,249 | 146,432 |
| Events in quadrant D | 2,018,259 | 121,349 |
| Mode SS | |||
|---|---|---|---|
| Quadrant | BADHDUFLAG | Total packets | Discarded packets |
| A | 0 | 24 | 0 |
| B | 0 | 24 | 0 |
| C | 0 | 24 | 0 |
| D | 0 | 24 | 0 |
| Mode M0 | |||
|---|---|---|---|
| Quadrant | BADHDUFLAG | Total packets | Discarded packets |
| A | 0 | 2391 | 0 |
| B | 0 | 3549 | 0 |
| C | 0 | 2461 | 0 |
| D | 0 | 6820 | 0 |
| Quadrant | Total seconds | Saturated seconds | Saturation percentage |
|---|---|---|---|
| A | 1180 | 0 | 0.000000% |
| B | 1181 | 5 | 0.423370% |
| C | 1181 | 4 | 0.338696% |
| D | 1181 | 405 | 34.292972% |
Noise dominated data is calculated using 1-second bins in cleaned event files. If a bin has >2000 counts, and if more than 50% of those come from <1% of pixels, then it is considered to be noise-dominated and hence unusable.
| Quadrant | # 1 sec bins | Bins with >0 counts | Bins with >2000 counts | High rate bins dominated by noise | Noise dominated (total time) | Noise dominated (detector-on time) | Marked lightcurve |
|---|---|---|---|---|---|---|---|
| A | 1180 | 1180 | 0 | 0 | 0.00% | 0.00% | 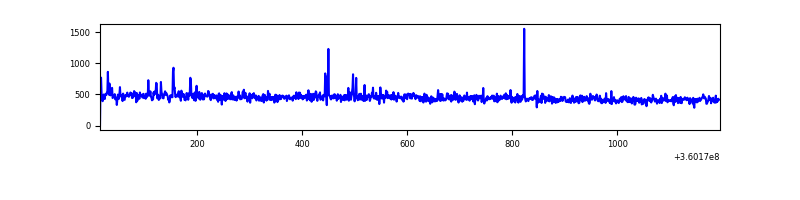 |
| B | 1181 | 1181 | 0 | 0 | 0.00% | 0.00% | 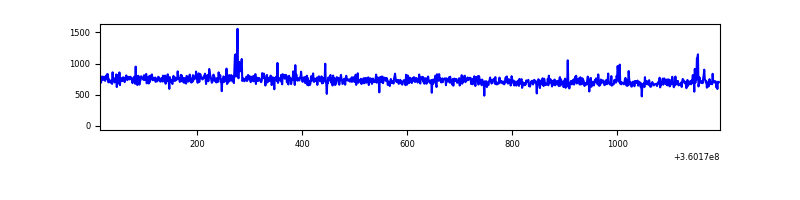 |
| C | 1181 | 1181 | 1 | 1 | 0.08% | 0.08% | 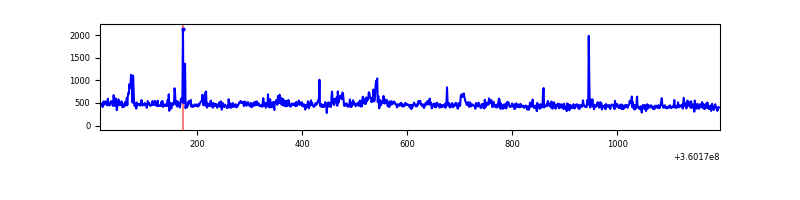 |
| D | 1181 | 1181 | 443 | 443 | 37.51% | 37.51% | 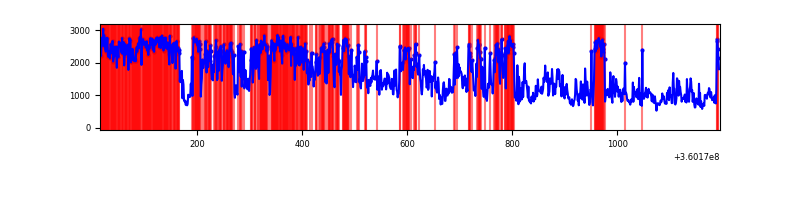 |
Top three noisy pixels from each quadrant. If the there are fewer than three noisy pixels in the level2.evt file, extra rows are filled as -1
| Pixel properties | Quadrant properties | ||||||
|---|---|---|---|---|---|---|---|
| Quadrant | DetID | PixID | Counts | Sigma | Mean | Median | Sigma |
| A | 0 | 13 | 12241 | 418.12 | 134 | 131 | 29.0 |
| A | 13 | 254 | 2280 | 74.2 | 134 | 131 | 29.0 |
| A | 3 | 137 | 1313 | 40.81 | 134 | 131 | 29.0 |
| B | 6 | 159 | 337277 | 12607.0 | 130 | 127 | 26.7 |
| B | 4 | 81 | 14106 | 522.71 | 130 | 127 | 26.7 |
| B | 12 | 111 | 3005 | 107.62 | 130 | 127 | 26.7 |
| C | 3 | 233 | 58244 | 1877.43 | 123 | 124 | 31.0 |
| C | 14 | 238 | 20194 | 648.31 | 123 | 124 | 31.0 |
| C | 2 | 114 | 2715 | 83.7 | 123 | 124 | 31.0 |
| D | 12 | 233 | 735484 | 26197.81 | 111 | 107 | 28.1 |
| D | 8 | 195 | 487387 | 17359.35 | 111 | 107 | 28.1 |
| D | 1 | 52 | 163939 | 5836.51 | 111 | 107 | 28.1 |
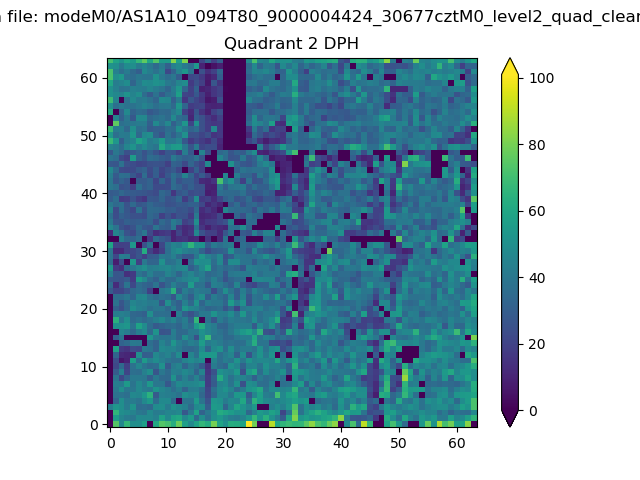
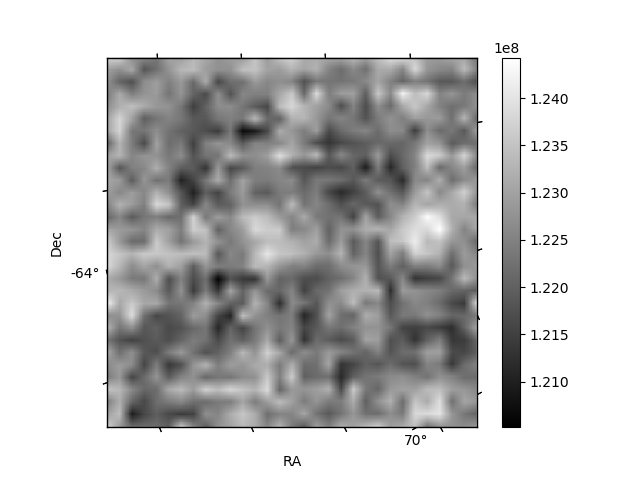
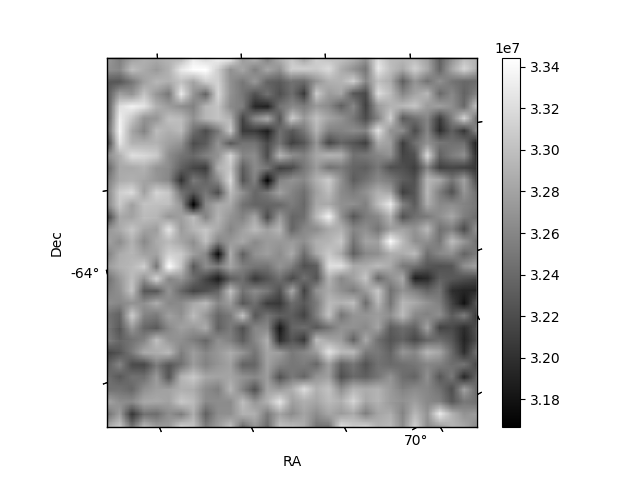
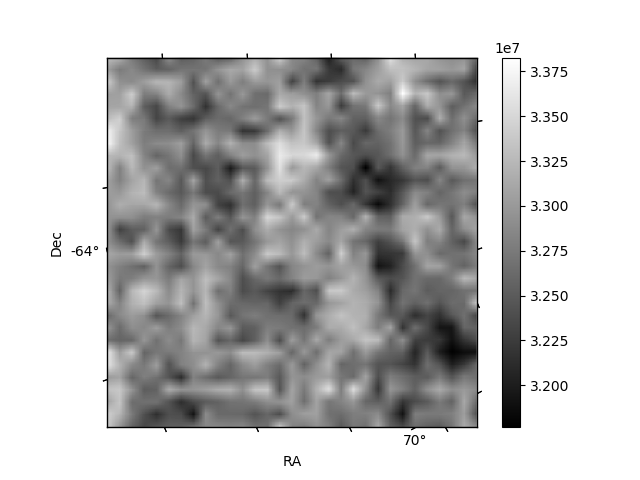
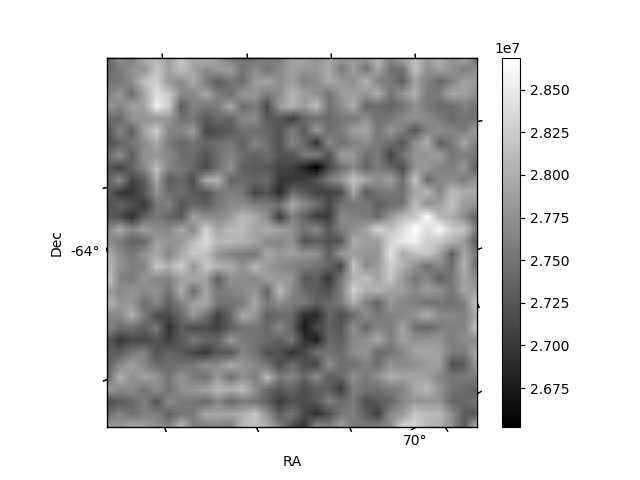
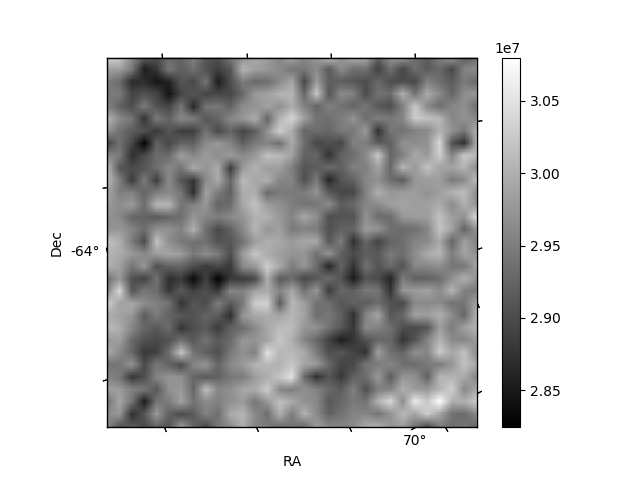
Histogram calculated using DETX and DETY for each event in the final _common_clean file
| Quadrant A | 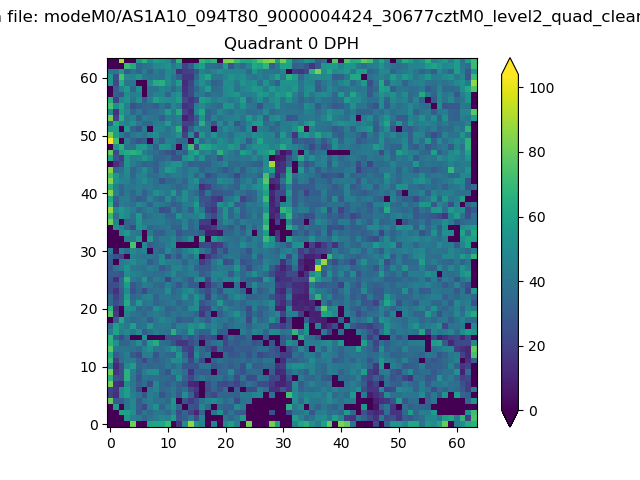 |
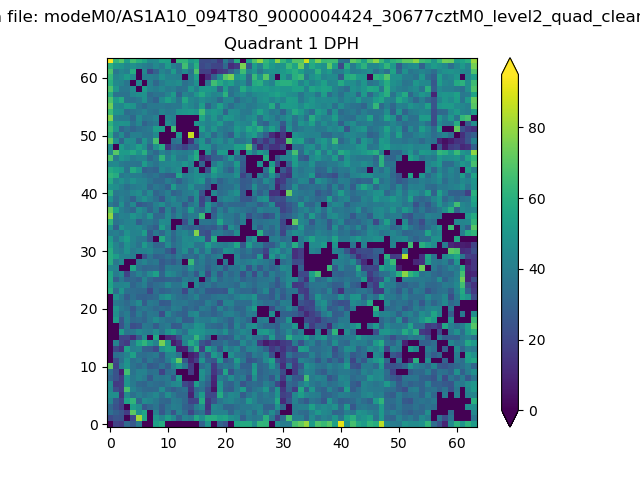 |
Quadrant B |
|---|---|---|---|
| Quadrant D | 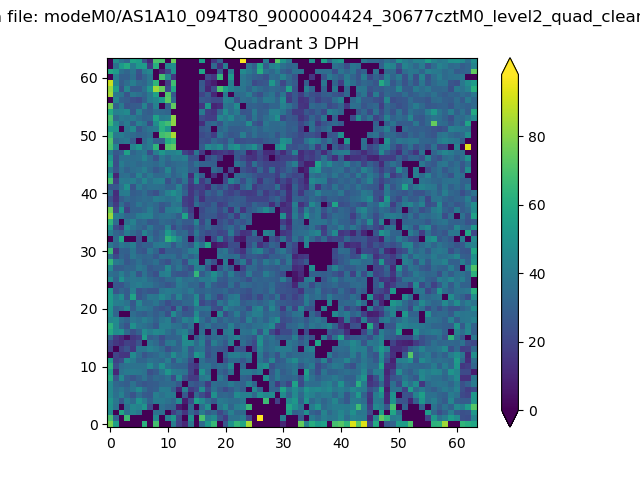 |
 |
Quadrant C |
| Plot type | Count rate plots | Images |
|---|---|---|
| Comparison with Poisson distribution Blue bars denote a histogram of data divided into 1 sec bins. Red curve is a Poisson curve with rate = median count rate of data. |
 |
 |
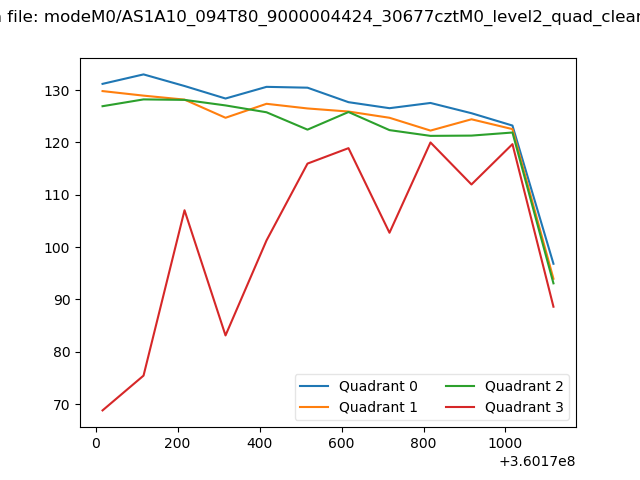
| Quadrant-wise count rates Data is divided into 100 sec bins |
 |
|
| Module-wise count rates for Quadrant A Data is divided into 100 sec bins |
 |
 |
| Module-wise count rates for Quadrant B Data is divided into 100 sec bins |
 |
 |
| Module-wise count rates for Quadrant C Data is divided into 100 sec bins |
 |
 |
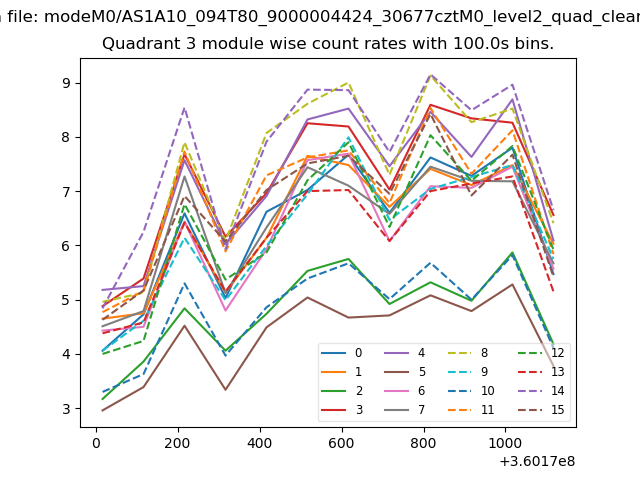
| Module-wise count rates for Quadrant D Data is divided into 100 sec bins |
 |
 |
| Parameter | Plot |
|---|---|
| CZT HV Monitor |  |
| D_VDD | 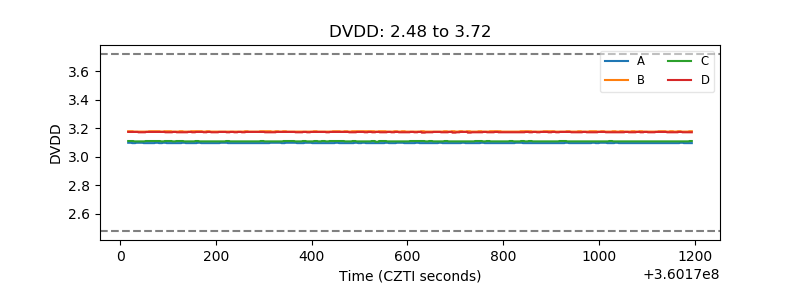 |
| Temperature 1 | 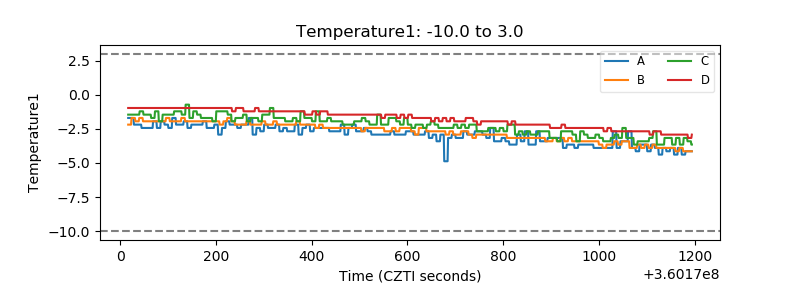 |
| Veto HV Monitor |  |
| Veto LLD | 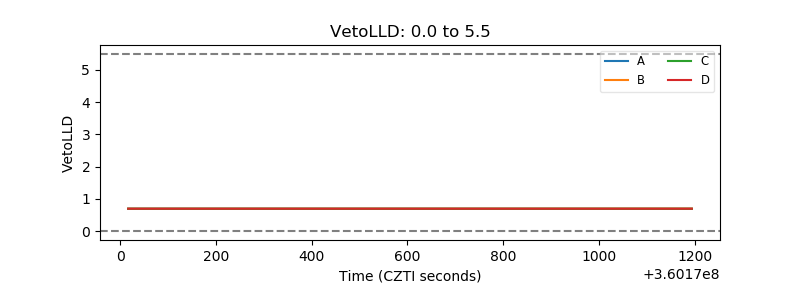 |
| Alpha Counter | 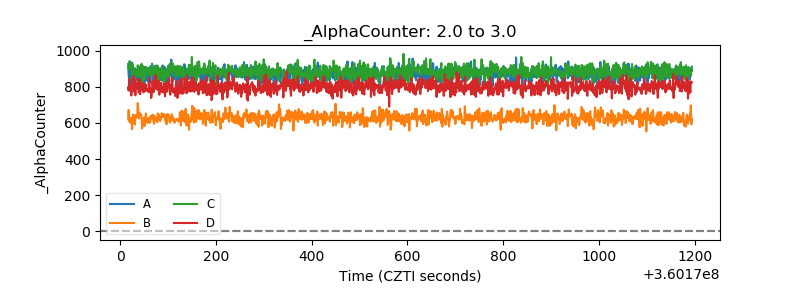 |
| _CPM_Rate | 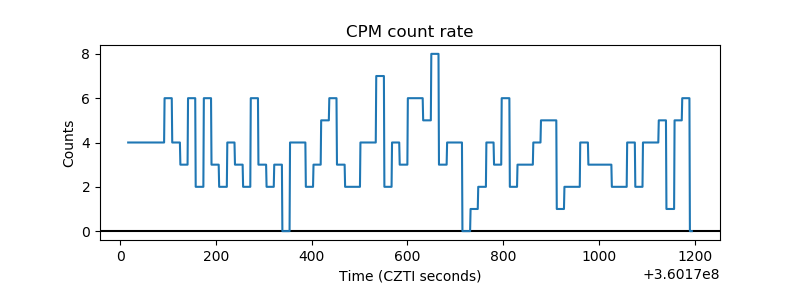 |
| CZT Counter | 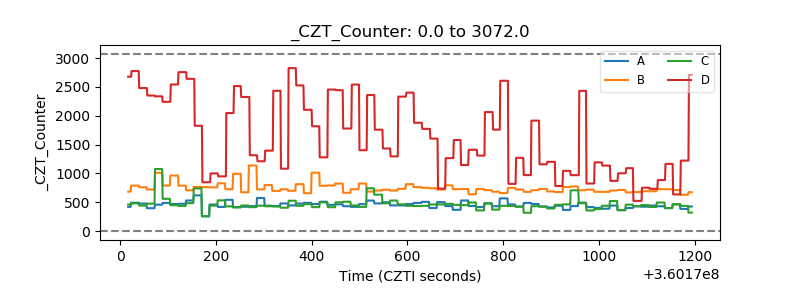 |
| +2.5 Volts monitor |  |
| +5 Volts monitor |  |
| _ROLL_ROT | 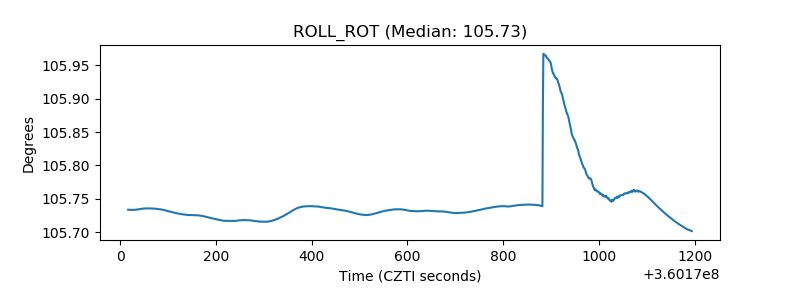 |
| _Roll_DEC | 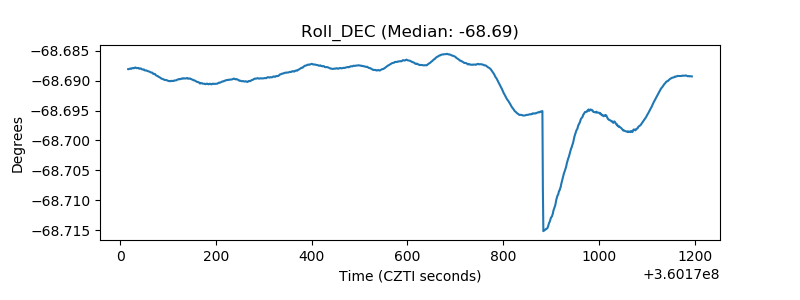 |
| _Roll_RA | 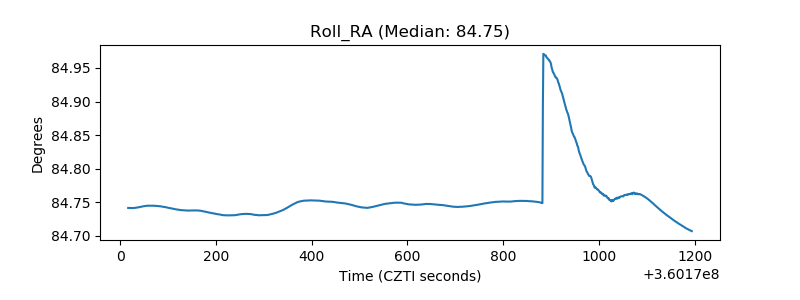 |
| Veto Counter | 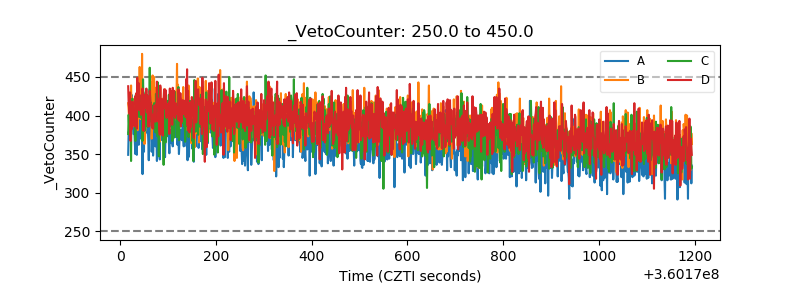 |