| Param | Original file | Final file |
|---|---|---|
| Filename | modeM0/AS1A10_094T81_9000004426cztM0_level2.fits | modeM0/AS1A10_094T81_9000004426cztM0_level2_quad_clean.evt |
| Size (bytes) | 447,477,120 | 558,408,960 |
| Size | 426.7 MB | 532.5 MB |
| Events in quadrant A | 2,839,738 | 3,888,864 |
| Events in quadrant B | 2,660,176 | 3,818,444 |
| Events in quadrant C | 2,756,630 | 3,660,809 |
| Events in quadrant D | 2,083,640 | 2,339,590 |
| Mode M9 | |||
|---|---|---|---|
| Quadrant | BADHDUFLAG | Total packets | Discarded packets |
| A | 0 | 57 | 0 |
| B | 0 | 57 | 0 |
| C | 0 | 57 | 0 |
| D | 0 | 57 | 0 |
| Mode M0 | |||
|---|---|---|---|
| Quadrant | BADHDUFLAG | Total packets | Discarded packets |
| A | 0 | 102026 | 0 |
| B | 0 | 141792 | 0 |
| C | 0 | 103729 | 0 |
| D | 0 | 259750 | 0 |
| Mode SS | |||
|---|---|---|---|
| Quadrant | BADHDUFLAG | Total packets | Discarded packets |
| A | 0 | 948 | 0 |
| B | 0 | 948 | 0 |
| C | 0 | 948 | 0 |
| D | 0 | 948 | 0 |
| Quadrant | Total seconds | Saturated seconds | Saturation percentage |
|---|---|---|---|
| A | 46689 | 849 | 1.818415% |
| B | 46689 | 847 | 1.814132% |
| C | 46689 | 993 | 2.126839% |
| D | 46689 | 15669 | 33.560368% |
Noise dominated data is calculated using 1-second bins in cleaned event files. If a bin has >2000 counts, and if more than 50% of those come from <1% of pixels, then it is considered to be noise-dominated and hence unusable.
| Quadrant | # 1 sec bins | Bins with >0 counts | Bins with >2000 counts | High rate bins dominated by noise | Noise dominated (total time) | Noise dominated (detector-on time) | Marked lightcurve |
|---|---|---|---|---|---|---|---|
| A | 52288 | 46685 | 0 | 0 | 0.00% | 0.00% | 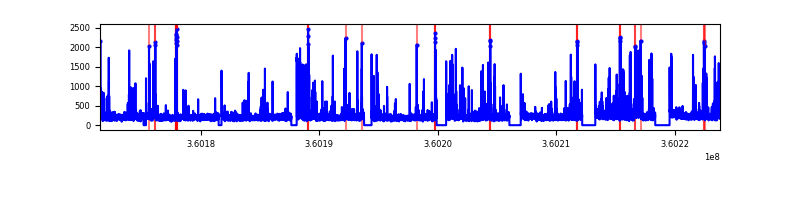 |
| B | 52289 | 46682 | 0 | 0 | 0.00% | 0.00% | 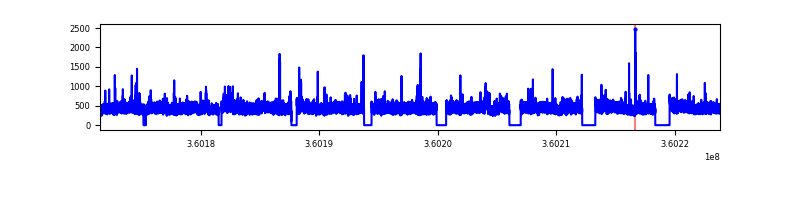 |
| C | 52289 | 46683 | 0 | 0 | 0.00% | 0.00% |  |
| D | 52289 | 46618 | 0 | 0 | 0.00% | 0.00% |  |
Top three noisy pixels from each quadrant. If the there are fewer than three noisy pixels in the level2.evt file, extra rows are filled as -1
| Pixel properties | Quadrant properties | ||||||
|---|---|---|---|---|---|---|---|
| Quadrant | DetID | PixID | Counts | Sigma | Mean | Median | Sigma |
| A | 0 | 29 | 2265 | 8.6 | 741 | 699 | 182.1 |
| A | 7 | 110 | 2242 | 8.47 | 741 | 699 | 182.1 |
| A | 9 | 19 | 2132 | 7.87 | 741 | 699 | 182.1 |
| B | 2 | 9 | 2099 | 10.32 | 704 | 675 | 138.0 |
| B | 3 | 80 | 1837 | 8.42 | 704 | 675 | 138.0 |
| B | 2 | 8 | 1798 | 8.14 | 704 | 675 | 138.0 |
| C | 3 | 187 | 1904 | 6.74 | 728 | 686 | 180.7 |
| C | 3 | 126 | 1899 | 6.71 | 728 | 686 | 180.7 |
| C | 12 | 241 | 1878 | 6.6 | 728 | 686 | 180.7 |
| D | 15 | 46 | 1630 | 6.79 | 596 | 545 | 159.8 |
| D | 10 | 189 | 1481 | 5.86 | 596 | 545 | 159.8 |
| D | 3 | 14 | 1475 | 5.82 | 596 | 545 | 159.8 |
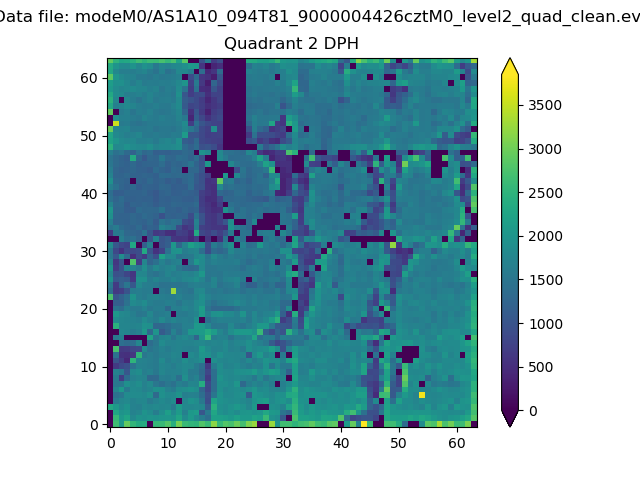
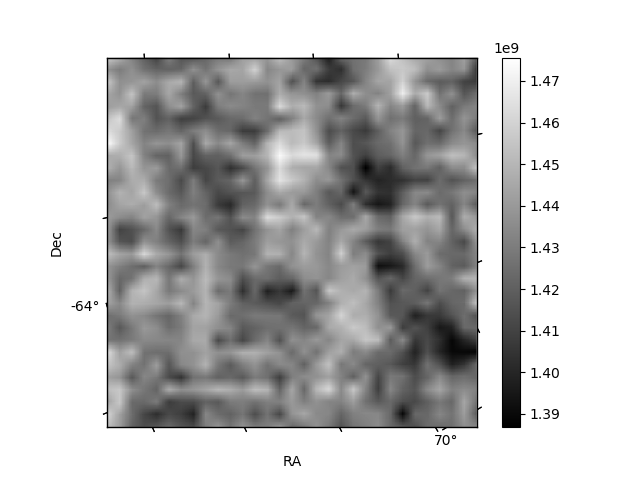
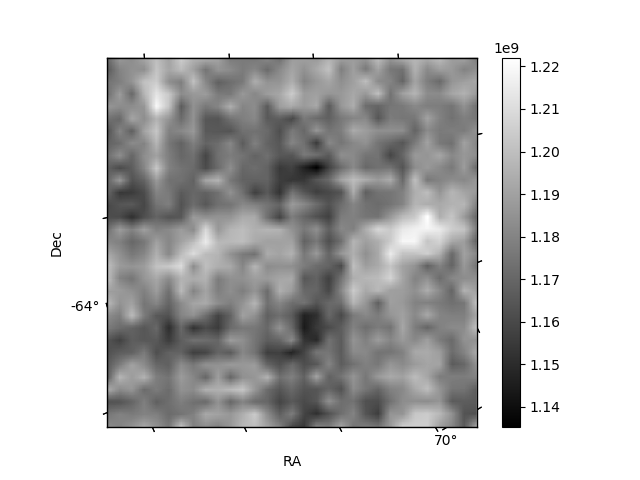
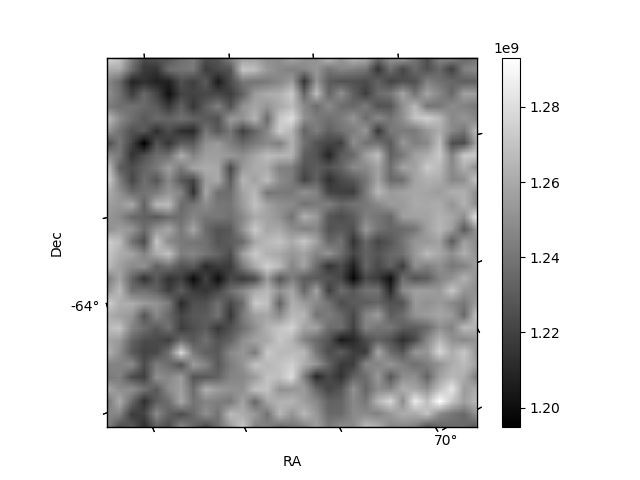
Histogram calculated using DETX and DETY for each event in the final _common_clean file
| Quadrant A | 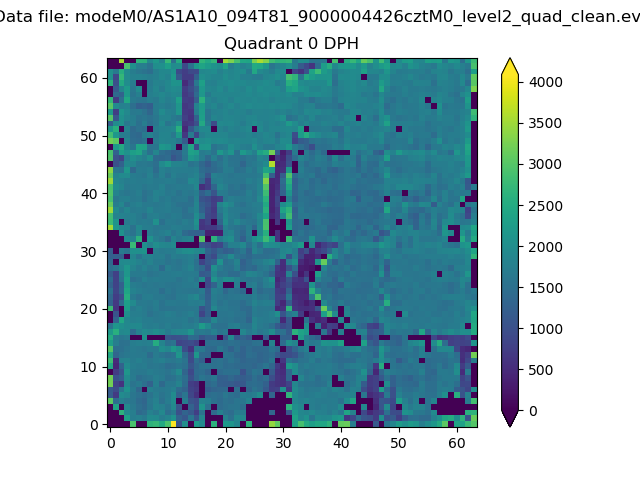 |
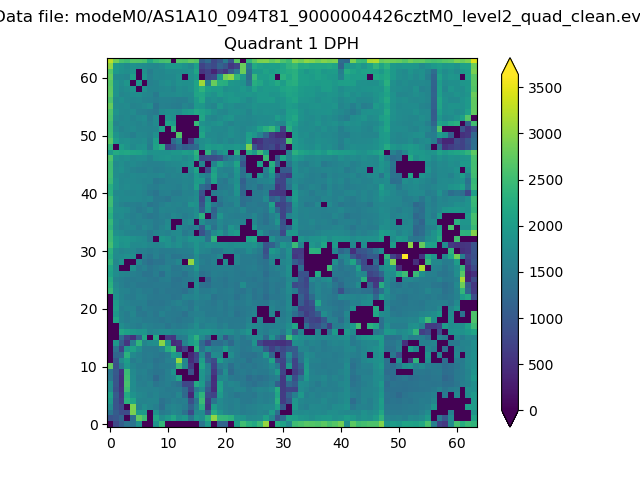 |
Quadrant B |
|---|---|---|---|
| Quadrant D | 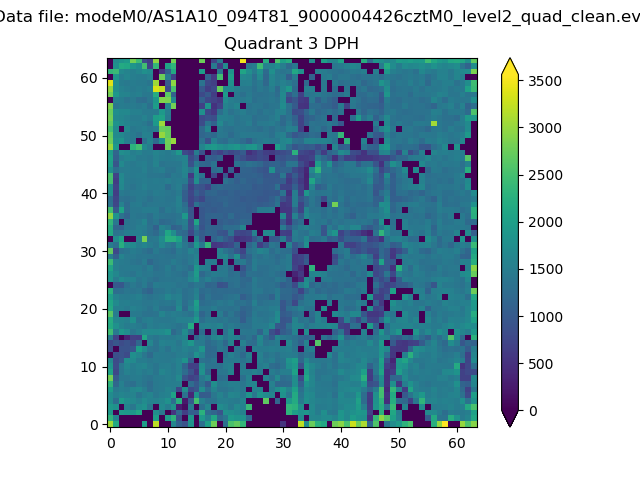 |
 |
Quadrant C |
| Plot type | Count rate plots | Images |
|---|---|---|
| Comparison with Poisson distribution Blue bars denote a histogram of data divided into 1 sec bins. Red curve is a Poisson curve with rate = median count rate of data. |
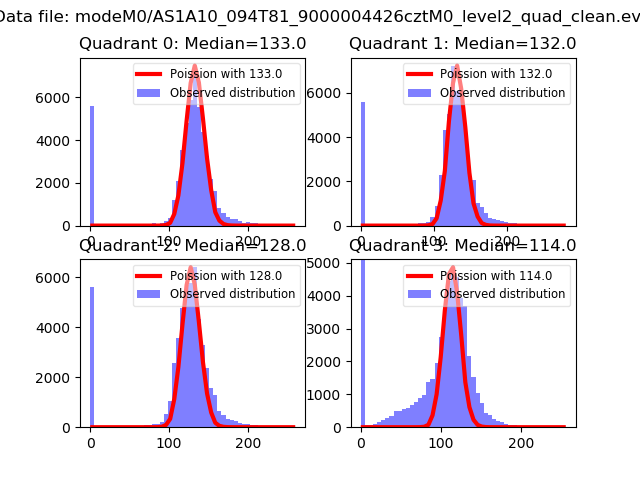 |
 |
| Quadrant-wise count rates Data is divided into 100 sec bins |
 |
|
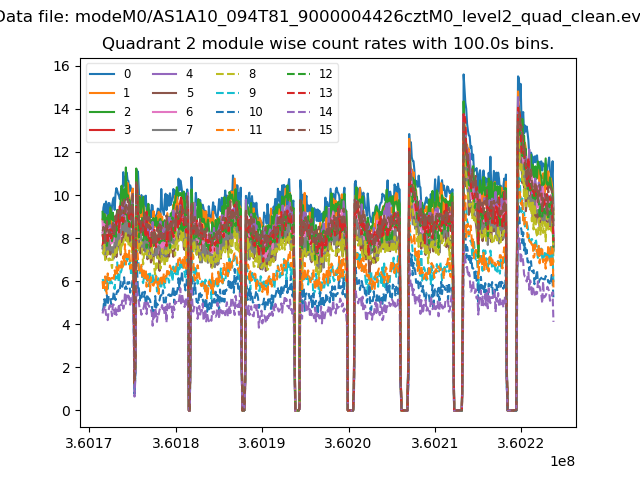
| Module-wise count rates for Quadrant A Data is divided into 100 sec bins |
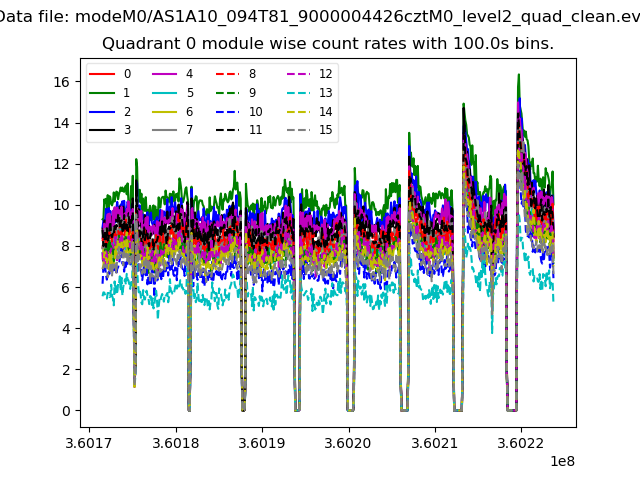 |
 |
| Module-wise count rates for Quadrant B Data is divided into 100 sec bins |
 |
 |
| Module-wise count rates for Quadrant C Data is divided into 100 sec bins |
 |
 |
| Module-wise count rates for Quadrant D Data is divided into 100 sec bins |
 |
 |
| Parameter | Plot |
|---|---|
| CZT HV Monitor |  |
| D_VDD | 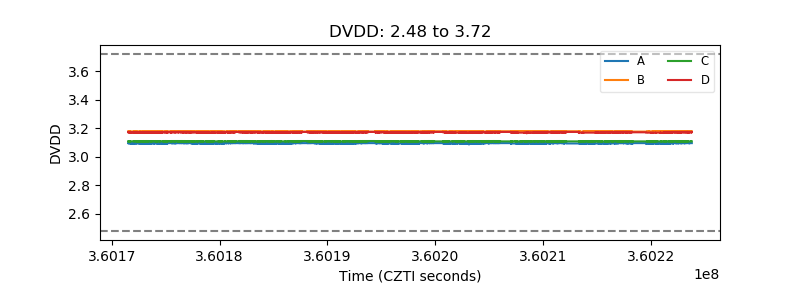 |
| Temperature 1 | 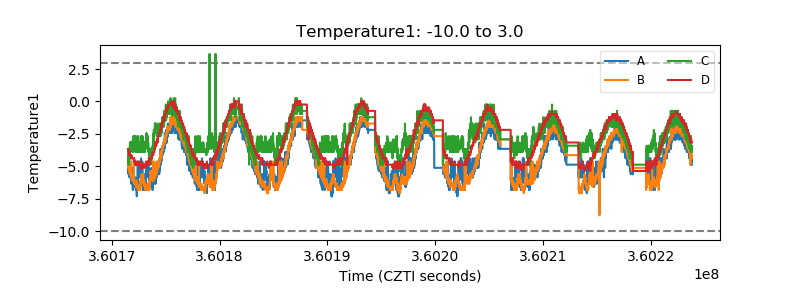 |
| Veto HV Monitor | 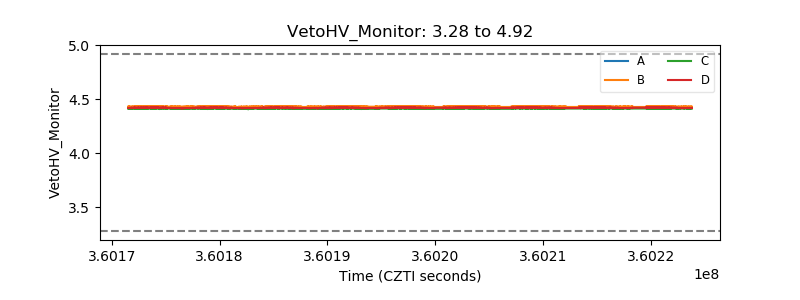 |
| Veto LLD | 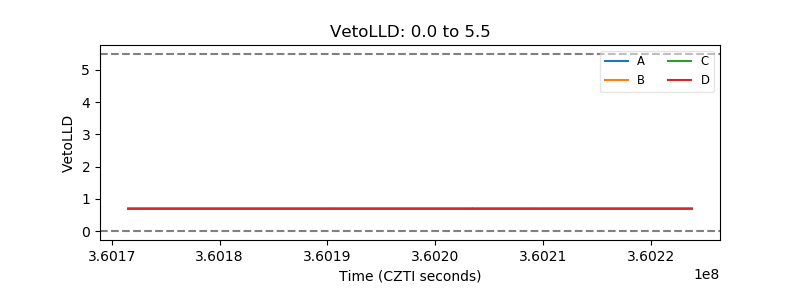 |
| Alpha Counter | 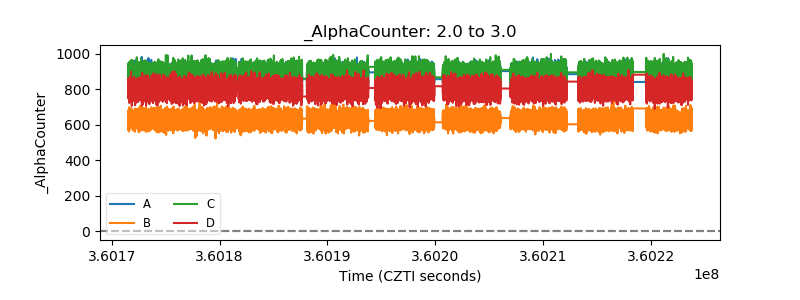 |
| _CPM_Rate |  |
| CZT Counter | 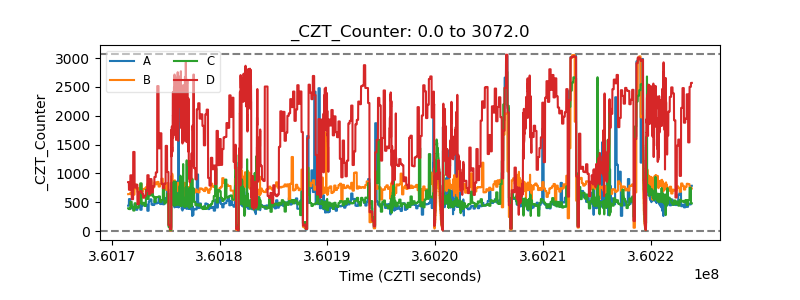 |
| +2.5 Volts monitor |  |
| +5 Volts monitor | 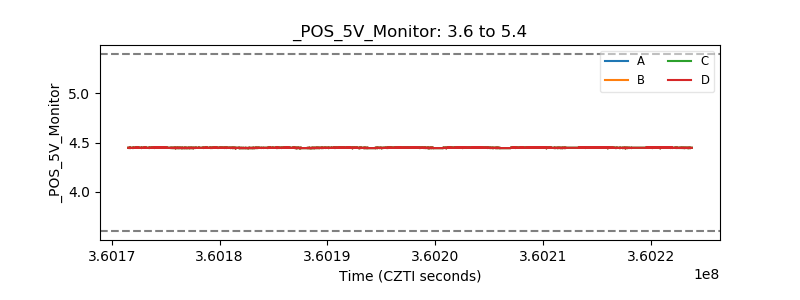 |
| _ROLL_ROT | 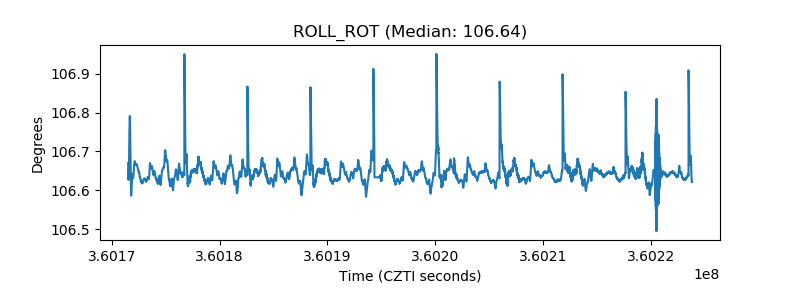 |
| _Roll_DEC | 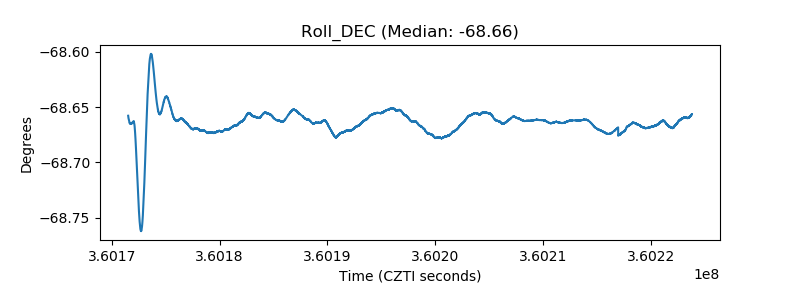 |
| _Roll_RA | 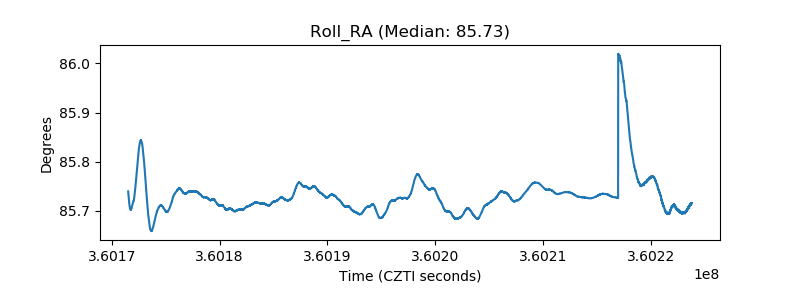 |
| Veto Counter | 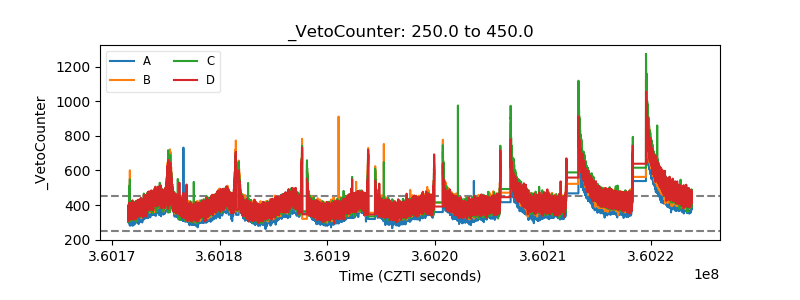 |