| Param | Original file | Final file |
|---|---|---|
| Filename | modeM0/AS1A10_094T81_9000004426_30678cztM0_level2.evt | modeM0/AS1A10_094T81_9000004426_30678cztM0_level2_quad_clean.evt |
| Size (bytes) | 837,740,160 | 127,748,160 |
| Size | 798.9 MB | 121.8 MB |
| Events in quadrant A | 3,360,211 | 904,395 |
| Events in quadrant B | 5,340,543 | 891,239 |
| Events in quadrant C | 4,051,094 | 862,934 |
| Events in quadrant D | 12,149,765 | 724,028 |
| Mode M9 | |||
|---|---|---|---|
| Quadrant | BADHDUFLAG | Total packets | Discarded packets |
| A | 0 | 3 | 0 |
| B | 0 | 3 | 0 |
| C | 0 | 3 | 0 |
| D | 0 | 3 | 0 |
| Mode M0 | |||
|---|---|---|---|
| Quadrant | BADHDUFLAG | Total packets | Discarded packets |
| A | 0 | 14583 | 1 |
| B | 0 | 21227 | 1 |
| C | 0 | 16602 | 1 |
| D | 0 | 40948 | 1 |
| Mode SS | |||
|---|---|---|---|
| Quadrant | BADHDUFLAG | Total packets | Discarded packets |
| A | 0 | 140 | 0 |
| B | 0 | 140 | 0 |
| C | 0 | 140 | 0 |
| D | 0 | 140 | 0 |
| Quadrant | Total seconds | Saturated seconds | Saturation percentage |
|---|---|---|---|
| A | 6970 | 142 | 2.037303% |
| B | 6971 | 157 | 2.252188% |
| C | 6971 | 171 | 2.453020% |
| D | 6971 | 2627 | 37.684694% |
Noise dominated data is calculated using 1-second bins in cleaned event files. If a bin has >2000 counts, and if more than 50% of those come from <1% of pixels, then it is considered to be noise-dominated and hence unusable.
| Quadrant | # 1 sec bins | Bins with >0 counts | Bins with >2000 counts | High rate bins dominated by noise | Noise dominated (total time) | Noise dominated (detector-on time) | Marked lightcurve |
|---|---|---|---|---|---|---|---|
| A | 7215 | 6971 | 32 | 32 | 0.44% | 0.46% | 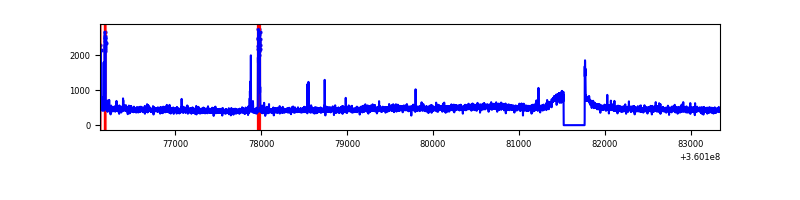 |
| B | 7216 | 6972 | 0 | 0 | 0.00% | 0.00% | 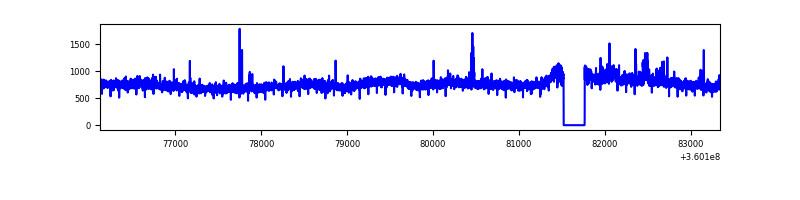 |
| C | 7216 | 6972 | 10 | 10 | 0.14% | 0.14% | 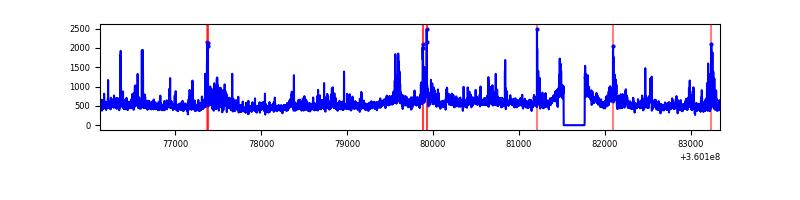 |
| D | 7216 | 6972 | 2698 | 2698 | 37.39% | 38.70% | 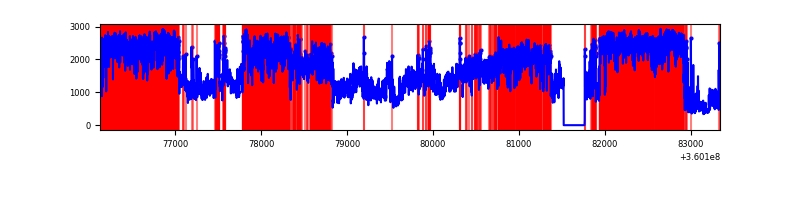 |
Top three noisy pixels from each quadrant. If the there are fewer than three noisy pixels in the level2.evt file, extra rows are filled as -1
| Pixel properties | Quadrant properties | ||||||
|---|---|---|---|---|---|---|---|
| Quadrant | DetID | PixID | Counts | Sigma | Mean | Median | Sigma |
| A | 0 | 13 | 115726 | 679.2 | 838 | 820 | 169.2 |
| A | 13 | 254 | 12376 | 68.31 | 838 | 820 | 169.2 |
| A | 8 | 192 | 11807 | 64.94 | 838 | 820 | 169.2 |
| B | 6 | 159 | 1999239 | 12801.81 | 820 | 801 | 156.1 |
| B | 0 | 230 | 39305 | 246.65 | 820 | 801 | 156.1 |
| B | 0 | 190 | 32474 | 202.89 | 820 | 801 | 156.1 |
| C | 3 | 233 | 671087 | 3631.99 | 791 | 795 | 184.6 |
| C | 14 | 238 | 129216 | 695.85 | 791 | 795 | 184.6 |
| C | 10 | 22 | 118725 | 639.01 | 791 | 795 | 184.6 |
| D | 8 | 195 | 5358895 | 31414.1 | 723 | 703 | 170.6 |
| D | 12 | 218 | 3008385 | 17633.49 | 723 | 703 | 170.6 |
| D | 12 | 233 | 376737 | 2204.62 | 723 | 703 | 170.6 |
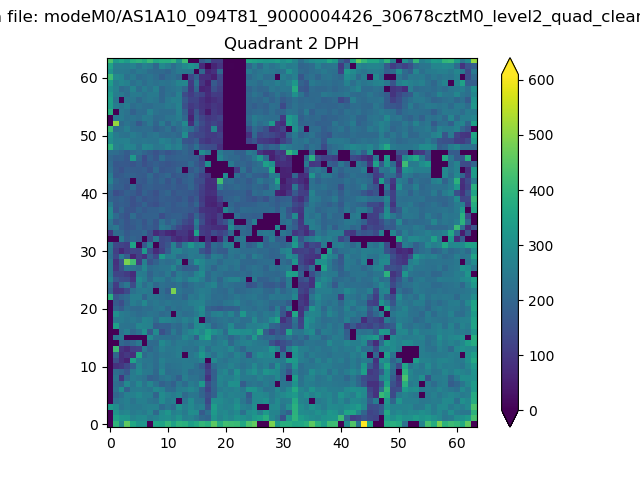
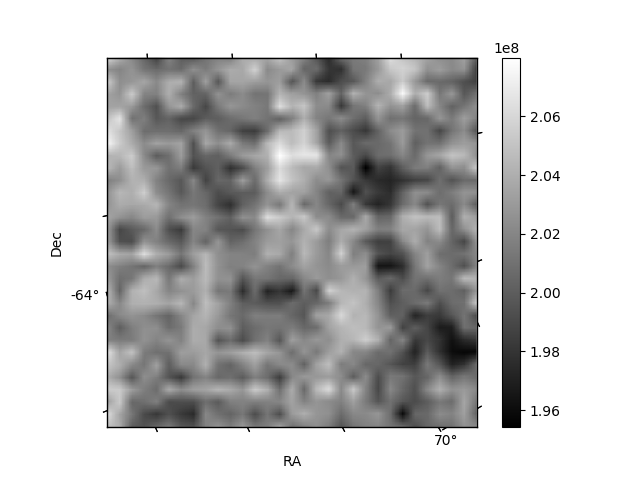
Histogram calculated using DETX and DETY for each event in the final _common_clean file
| Quadrant A | 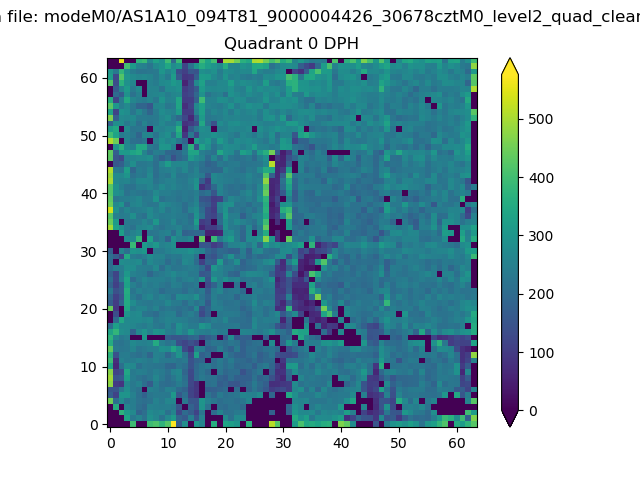 |
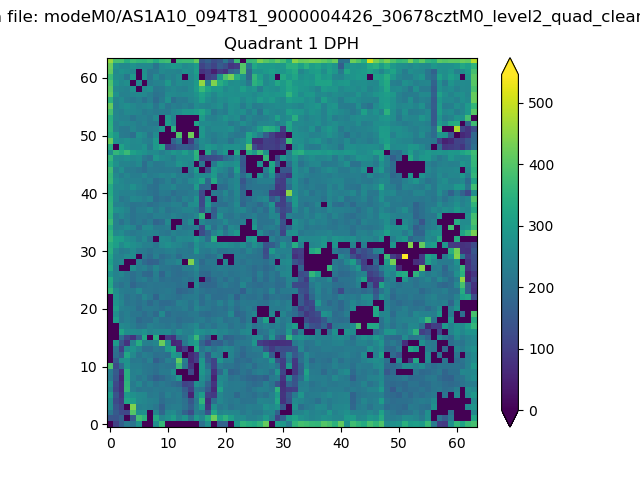 |
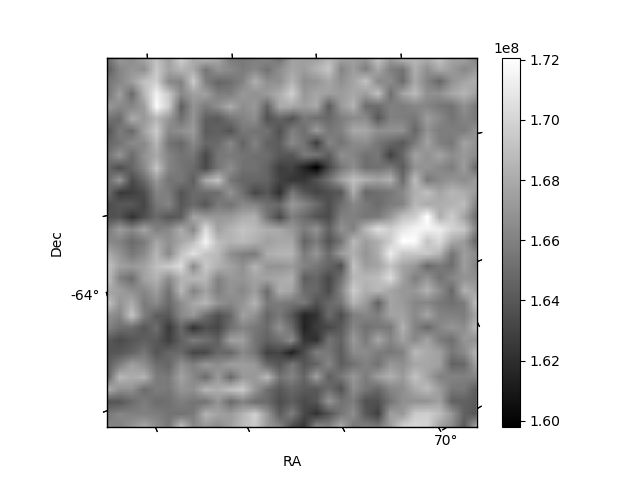
Quadrant B |
|---|---|---|---|
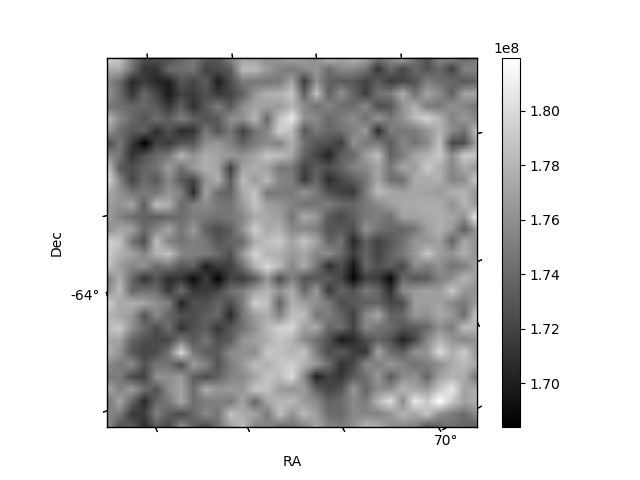
| Quadrant D | 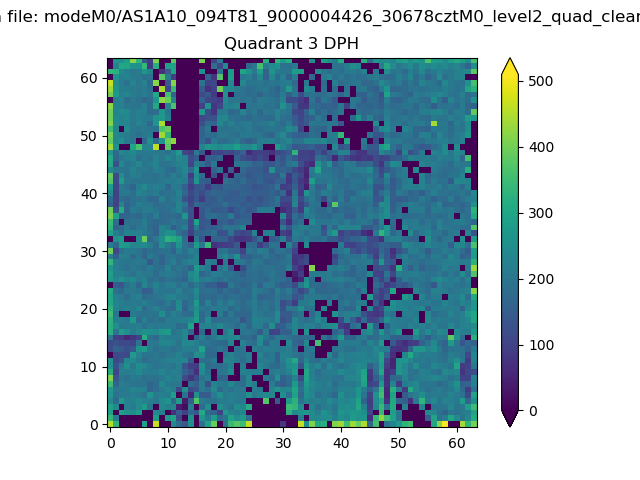 |
 |
Quadrant C |
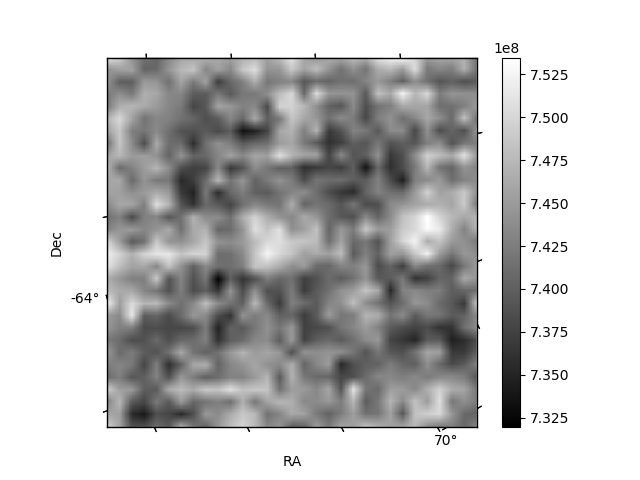
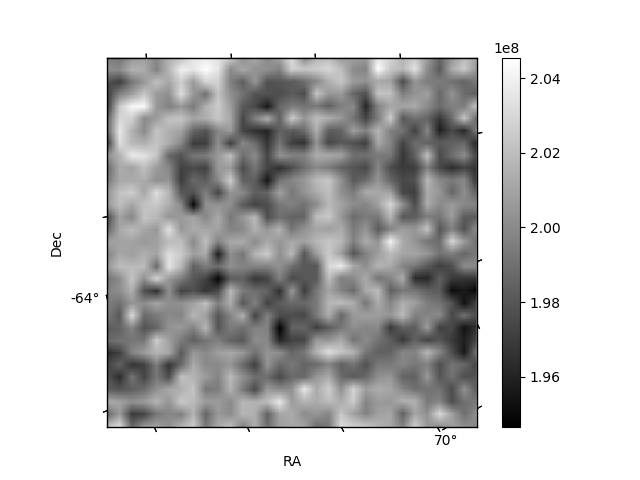
| Plot type | Count rate plots | Images |
|---|---|---|
| Comparison with Poisson distribution Blue bars denote a histogram of data divided into 1 sec bins. Red curve is a Poisson curve with rate = median count rate of data. |
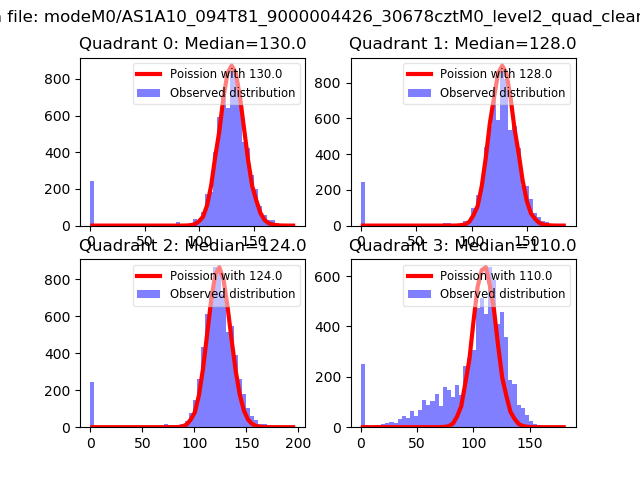 |
 |
| Quadrant-wise count rates Data is divided into 100 sec bins |
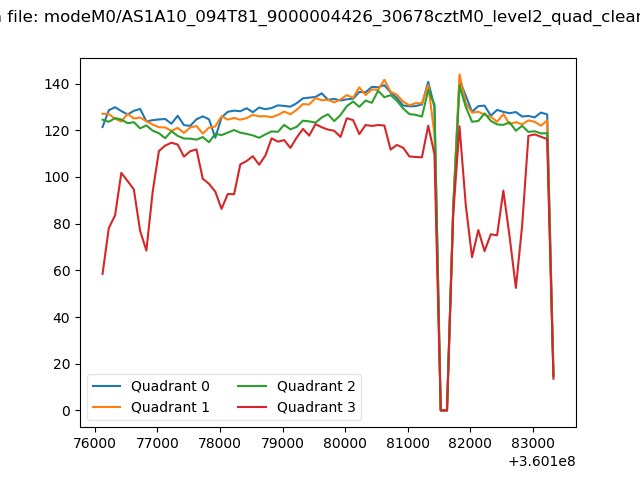 |
|
| Module-wise count rates for Quadrant A Data is divided into 100 sec bins |
 |
 |
| Module-wise count rates for Quadrant B Data is divided into 100 sec bins |
 |
 |
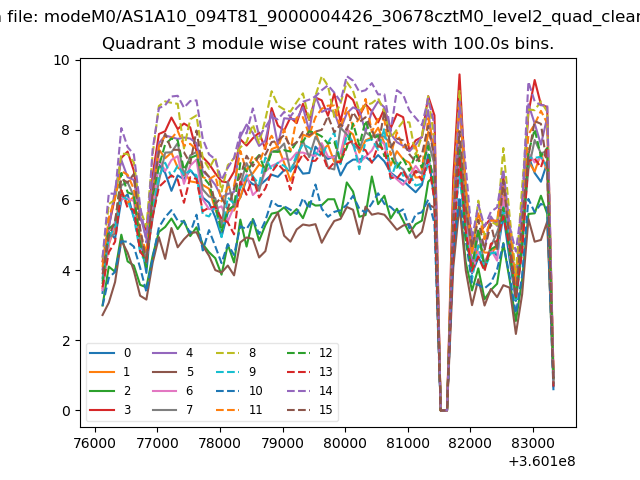
| Module-wise count rates for Quadrant C Data is divided into 100 sec bins |
 |
 |
| Module-wise count rates for Quadrant D Data is divided into 100 sec bins |
 |
 |
| Parameter | Plot |
|---|---|
| CZT HV Monitor |  |
| D_VDD | 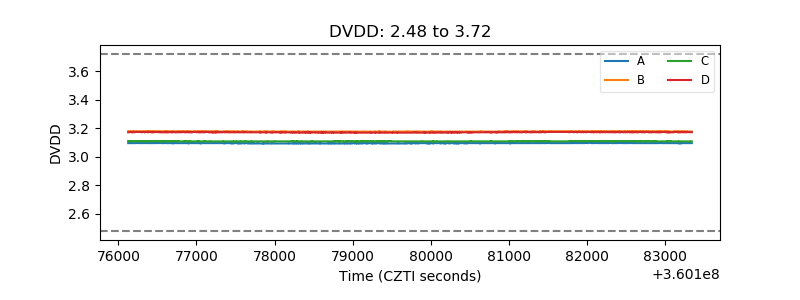 |
| Temperature 1 | 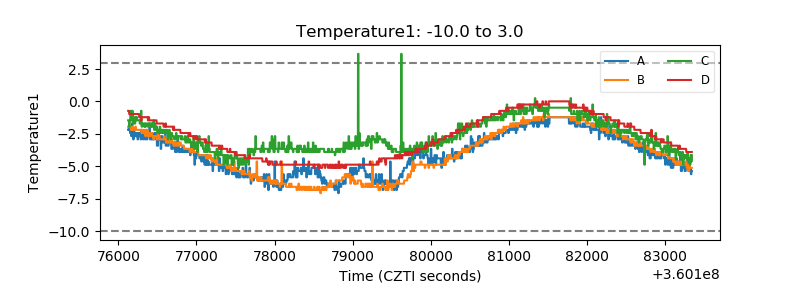 |
| Veto HV Monitor | 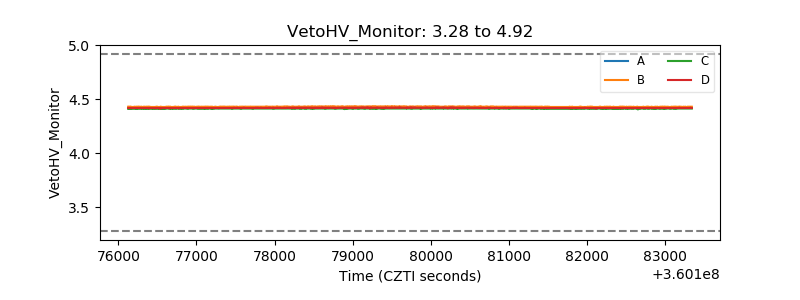 |
| Veto LLD | 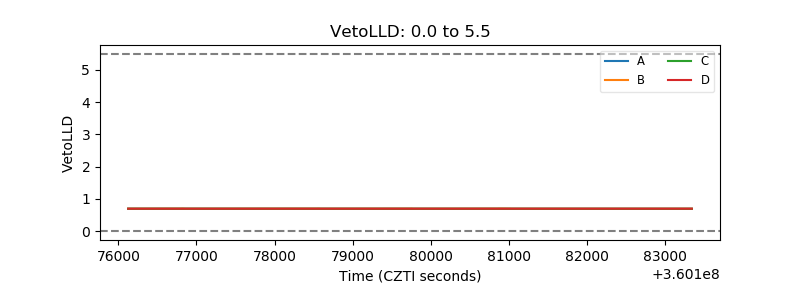 |
| Alpha Counter | 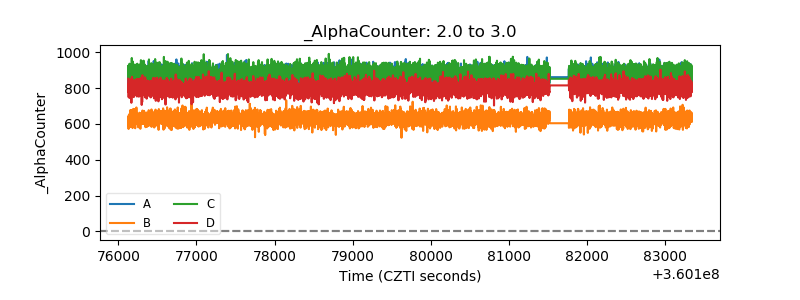 |
| _CPM_Rate | 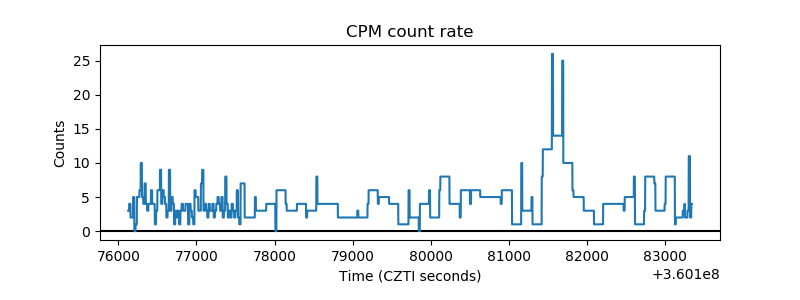 |
| CZT Counter | 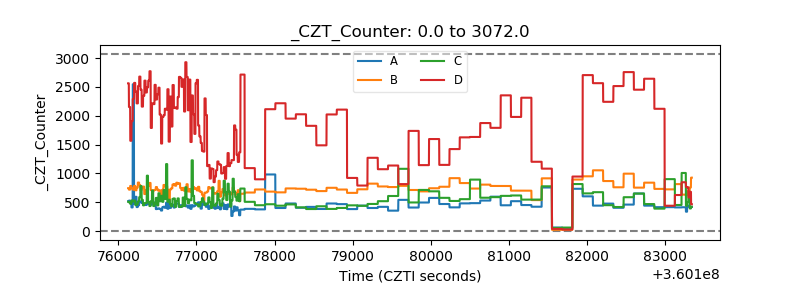 |
| +2.5 Volts monitor |  |
| +5 Volts monitor |  |
| _ROLL_ROT | 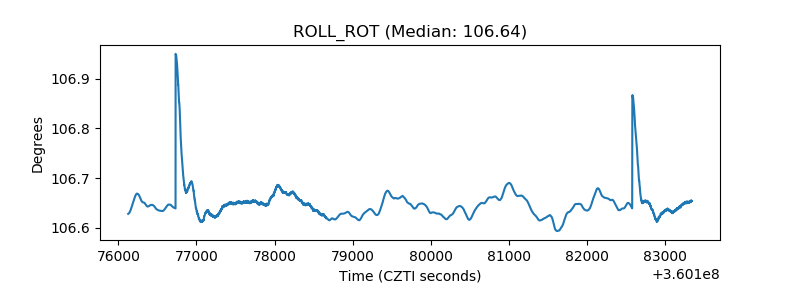 |
| _Roll_DEC | 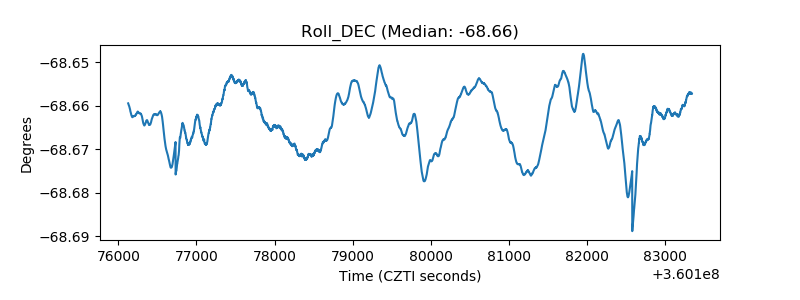 |
| _Roll_RA | 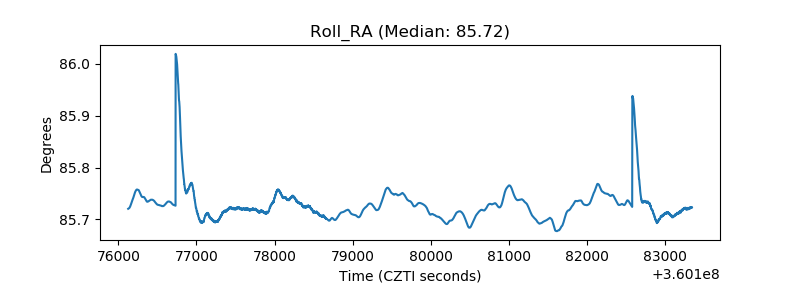 |
| Veto Counter | 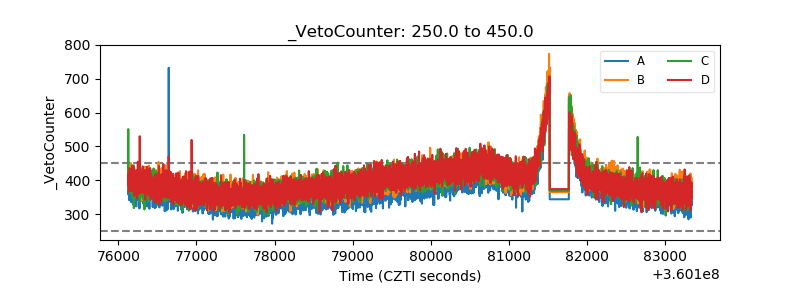 |