| Param | Original file | Final file |
|---|---|---|
| Filename | modeM0/AS1A10_094T81_9000004426_30681cztM0_level2.evt | modeM0/AS1A10_094T81_9000004426_30681cztM0_level2_quad_clean.evt |
| Size (bytes) | 2,123,236,800 | 330,742,080 |
| Size | 2.0 GB | 315.4 MB |
| Events in quadrant A | 9,041,626 | 2,343,540 |
| Events in quadrant B | 14,019,555 | 2,315,129 |
| Events in quadrant C | 9,603,600 | 2,236,286 |
| Events in quadrant D | 30,416,928 | 1,866,463 |
| Mode M9 | |||
|---|---|---|---|
| Quadrant | BADHDUFLAG | Total packets | Discarded packets |
| A | 0 | 18 | 0 |
| B | 0 | 18 | 0 |
| C | 0 | 18 | 0 |
| D | 0 | 18 | 0 |
| Mode M0 | |||
|---|---|---|---|
| Quadrant | BADHDUFLAG | Total packets | Discarded packets |
| A | 0 | 38740 | 3 |
| B | 0 | 55341 | 3 |
| C | 0 | 39668 | 3 |
| D | 0 | 102964 | 3 |
| Mode SS | |||
|---|---|---|---|
| Quadrant | BADHDUFLAG | Total packets | Discarded packets |
| A | 0 | 370 | 0 |
| B | 0 | 370 | 0 |
| C | 0 | 370 | 0 |
| D | 0 | 370 | 0 |
| Quadrant | Total seconds | Saturated seconds | Saturation percentage |
|---|---|---|---|
| A | 18197 | 248 | 1.362862% |
| B | 18197 | 264 | 1.450789% |
| C | 18197 | 328 | 1.802495% |
| D | 18197 | 6402 | 35.181623% |
Noise dominated data is calculated using 1-second bins in cleaned event files. If a bin has >2000 counts, and if more than 50% of those come from <1% of pixels, then it is considered to be noise-dominated and hence unusable.
| Quadrant | # 1 sec bins | Bins with >0 counts | Bins with >2000 counts | High rate bins dominated by noise | Noise dominated (total time) | Noise dominated (detector-on time) | Marked lightcurve |
|---|---|---|---|---|---|---|---|
| A | 20087 | 18200 | 75 | 75 | 0.37% | 0.41% | 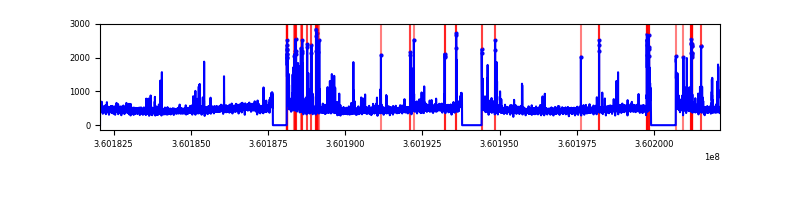 |
| B | 20087 | 18200 | 31 | 31 | 0.15% | 0.17% | 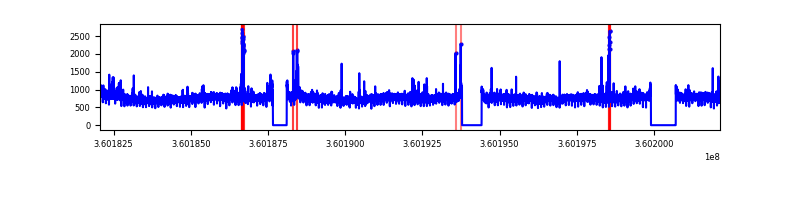 |
| C | 20087 | 18200 | 72 | 72 | 0.36% | 0.40% | 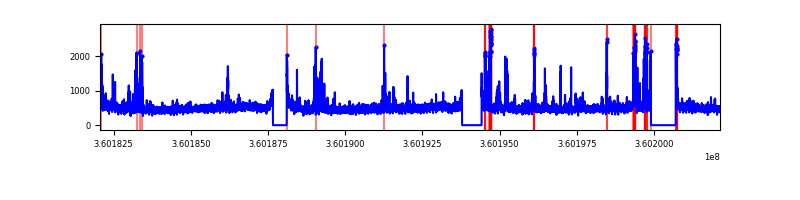 |
| D | 20087 | 18200 | 6553 | 6553 | 32.62% | 36.01% | 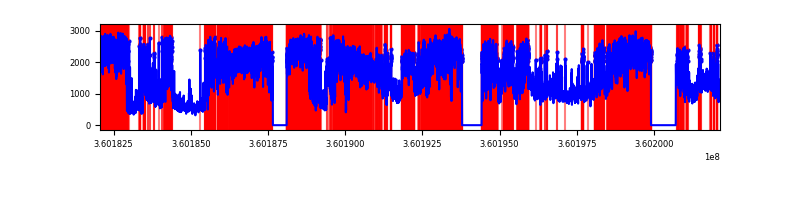 |
Top three noisy pixels from each quadrant. If the there are fewer than three noisy pixels in the level2.evt file, extra rows are filled as -1
| Pixel properties | Quadrant properties | ||||||
|---|---|---|---|---|---|---|---|
| Quadrant | DetID | PixID | Counts | Sigma | Mean | Median | Sigma |
| A | 0 | 13 | 634322 | 1470.54 | 2166 | 2123 | 429.9 |
| A | 8 | 192 | 36650 | 80.31 | 2166 | 2123 | 429.9 |
| A | 13 | 254 | 34284 | 74.81 | 2166 | 2123 | 429.9 |
| B | 6 | 159 | 5262436 | 12972.89 | 2137 | 2085 | 405.5 |
| B | 0 | 190 | 173622 | 423.04 | 2137 | 2085 | 405.5 |
| B | 0 | 230 | 57034 | 135.51 | 2137 | 2085 | 405.5 |
| C | 10 | 22 | 431519 | 900.34 | 2066 | 2078 | 477.0 |
| C | 3 | 233 | 418759 | 873.59 | 2066 | 2078 | 477.0 |
| C | 14 | 238 | 338665 | 705.67 | 2066 | 2078 | 477.0 |
| D | 8 | 195 | 16139943 | 36516.87 | 1862 | 1808 | 441.9 |
| D | 12 | 218 | 2965961 | 6707.19 | 1862 | 1808 | 441.9 |
| D | 12 | 33 | 1932403 | 4368.49 | 1862 | 1808 | 441.9 |
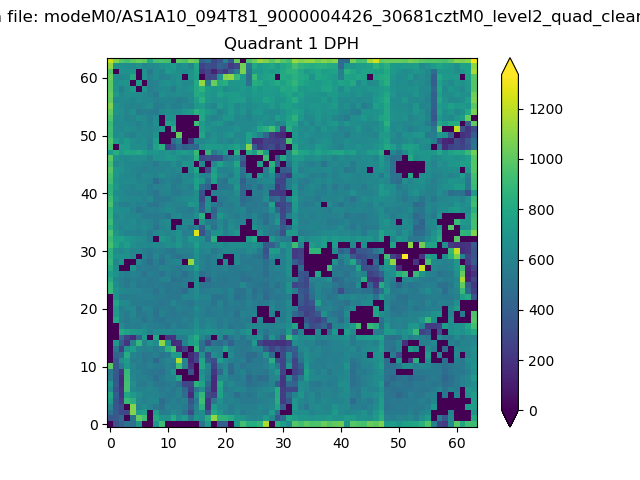
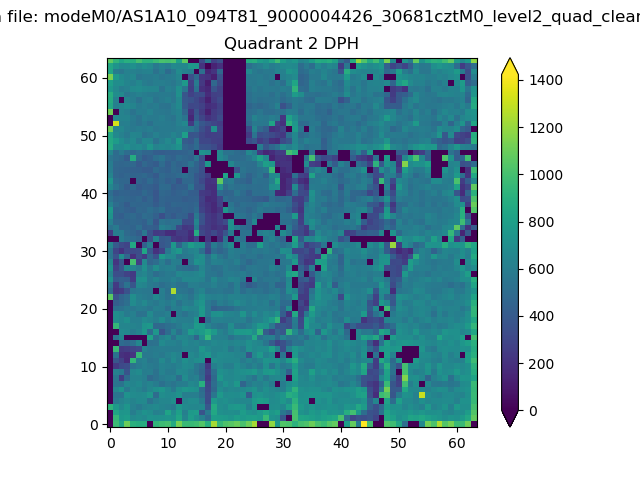
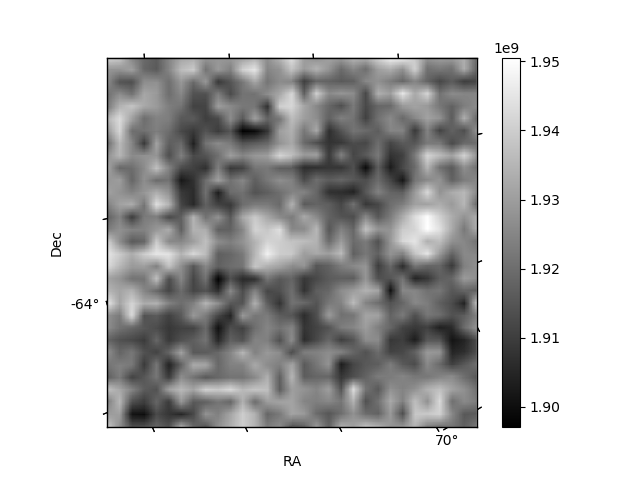
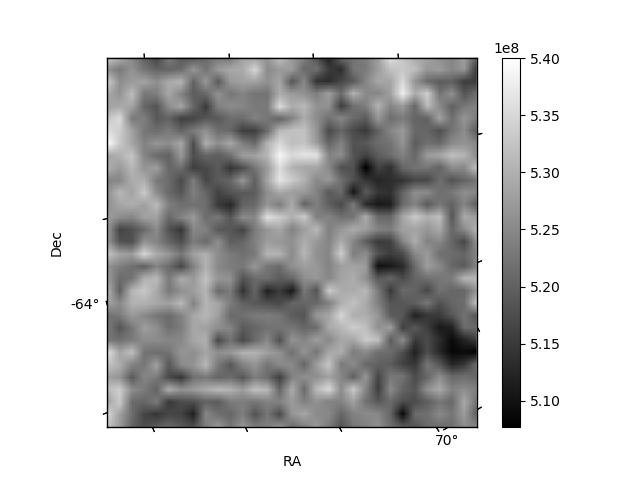
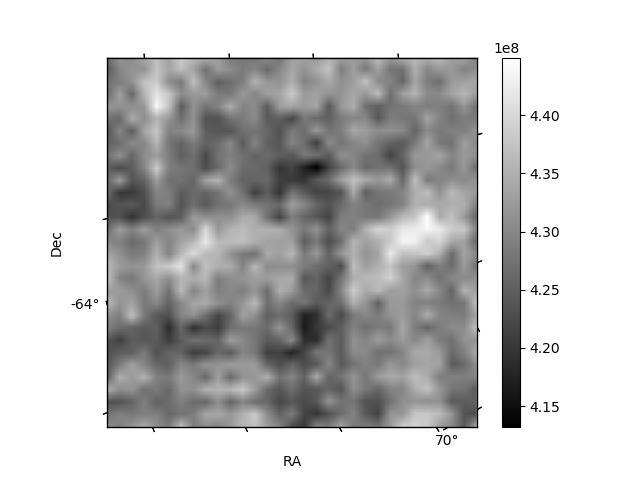
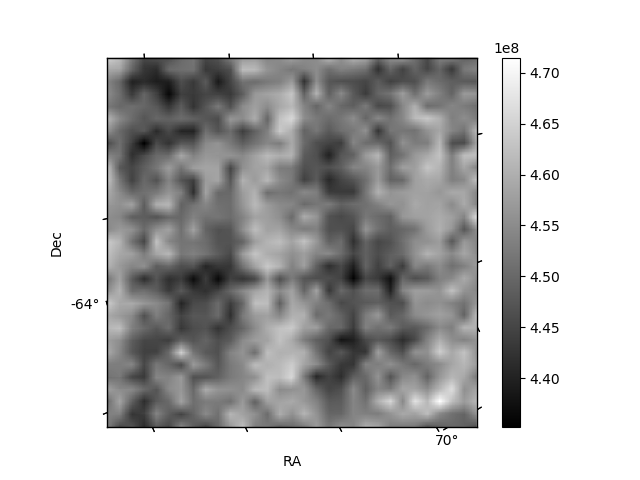
Histogram calculated using DETX and DETY for each event in the final _common_clean file
| Quadrant A |  |
 |
Quadrant B |
|---|---|---|---|
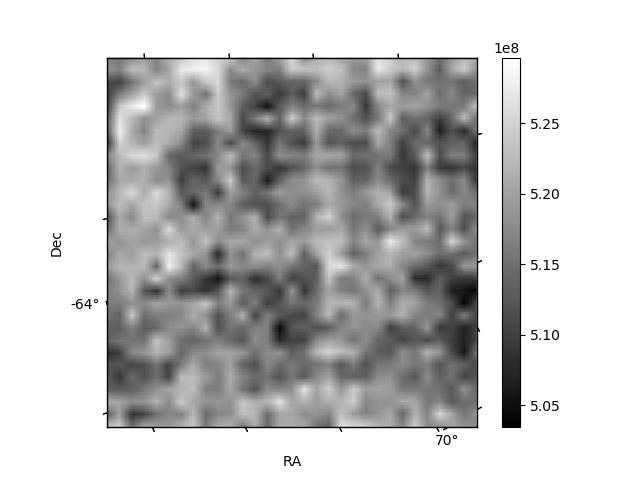
| Quadrant D | 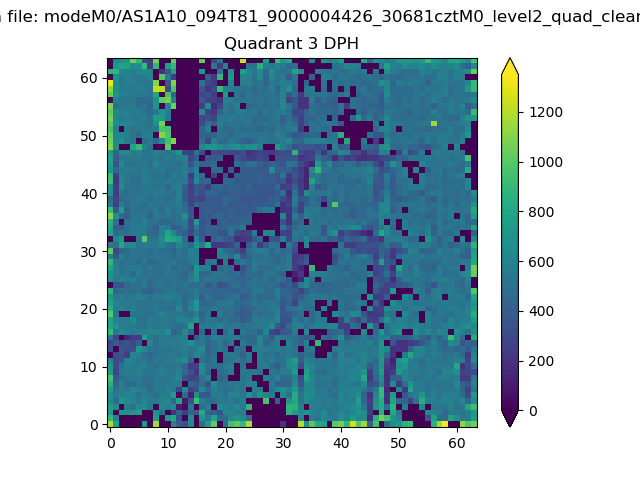 |
 |
Quadrant C |
| Plot type | Count rate plots | Images |
|---|---|---|
| Comparison with Poisson distribution Blue bars denote a histogram of data divided into 1 sec bins. Red curve is a Poisson curve with rate = median count rate of data. |
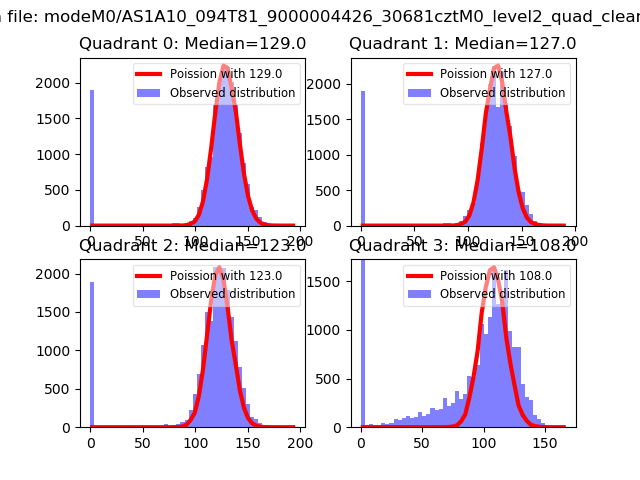 |
 |
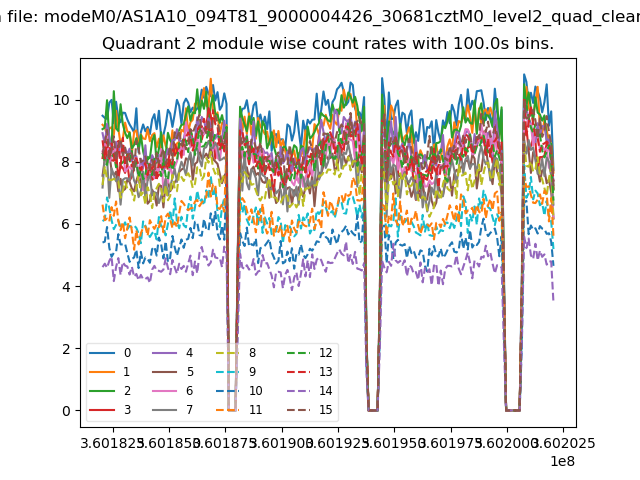
| Quadrant-wise count rates Data is divided into 100 sec bins |
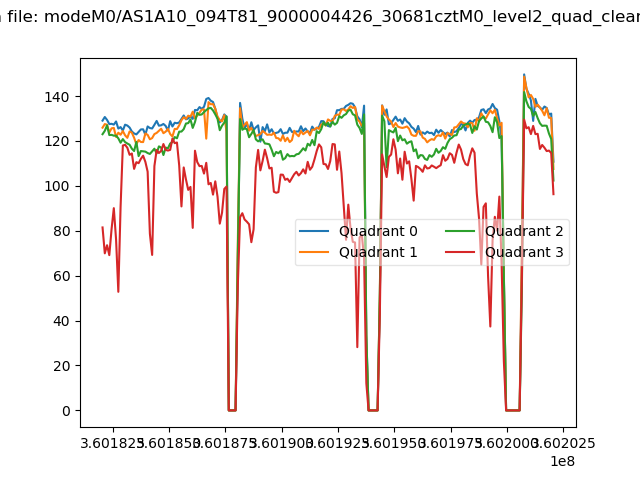 |
|
| Module-wise count rates for Quadrant A Data is divided into 100 sec bins |
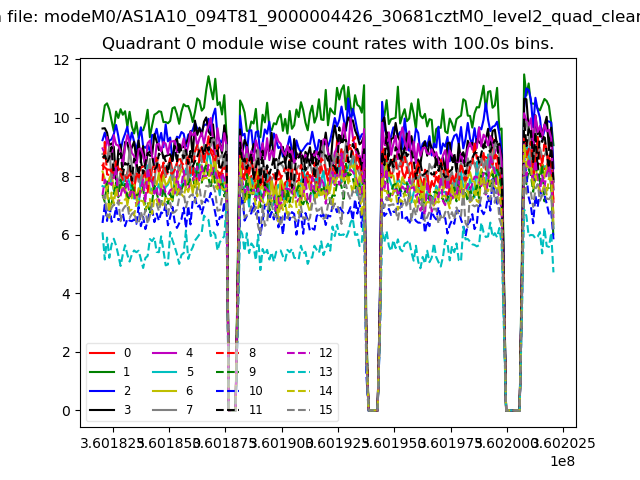 |
 |
| Module-wise count rates for Quadrant B Data is divided into 100 sec bins |
 |
 |
| Module-wise count rates for Quadrant C Data is divided into 100 sec bins |
 |
 |
| Module-wise count rates for Quadrant D Data is divided into 100 sec bins |
 |
 |
| Parameter | Plot |
|---|---|
| CZT HV Monitor | 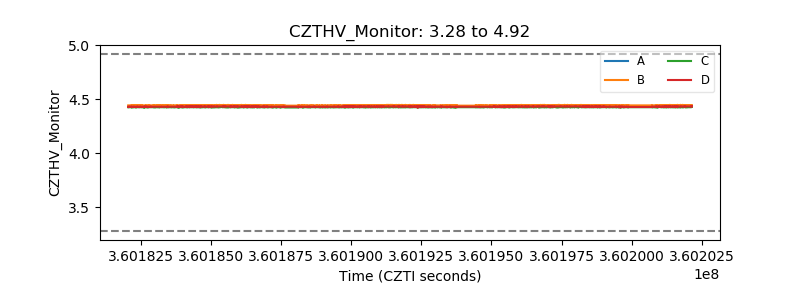 |
| D_VDD | 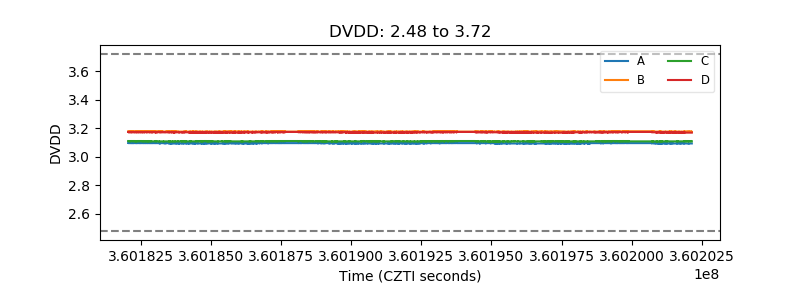 |
| Temperature 1 | 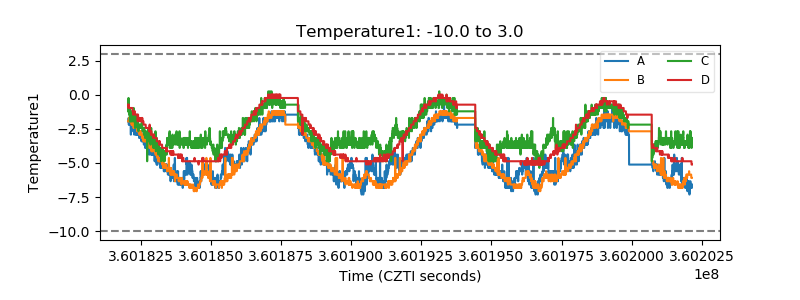 |
| Veto HV Monitor | 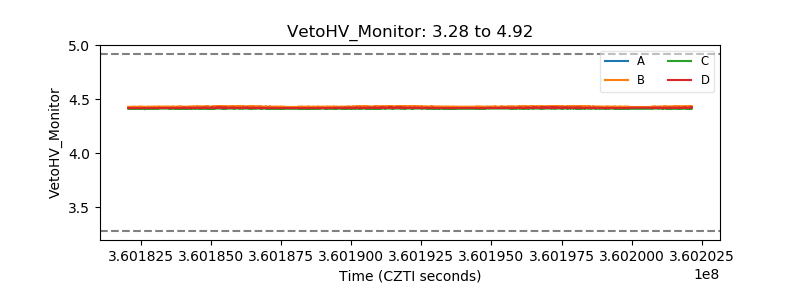 |
| Veto LLD | 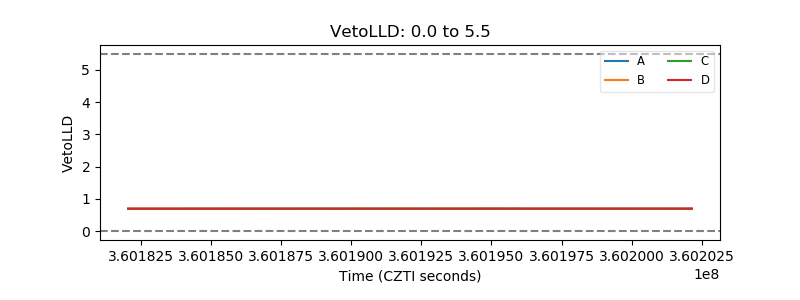 |
| Alpha Counter | 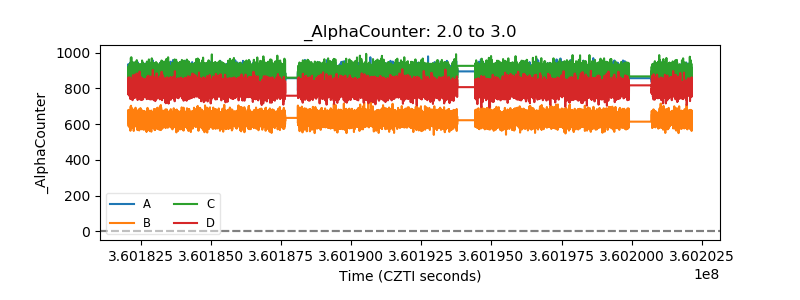 |
| _CPM_Rate | 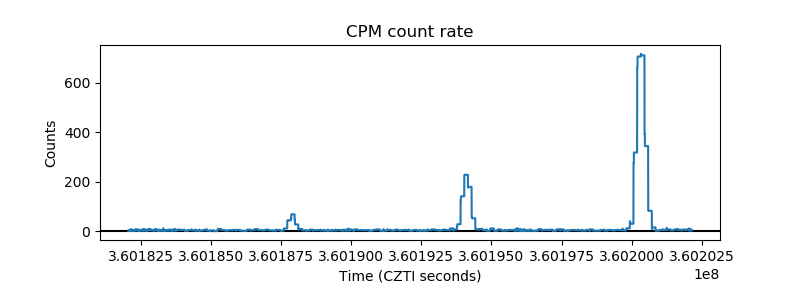 |
| CZT Counter | 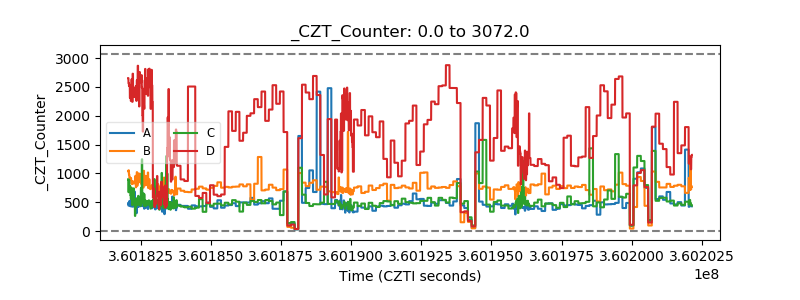 |
| +2.5 Volts monitor | 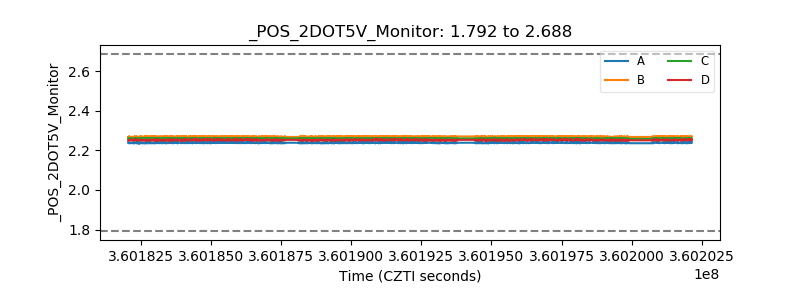 |
| +5 Volts monitor | 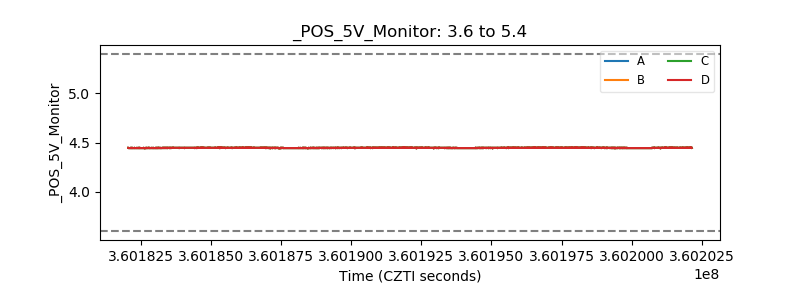 |
| _ROLL_ROT |  |
| _Roll_DEC | 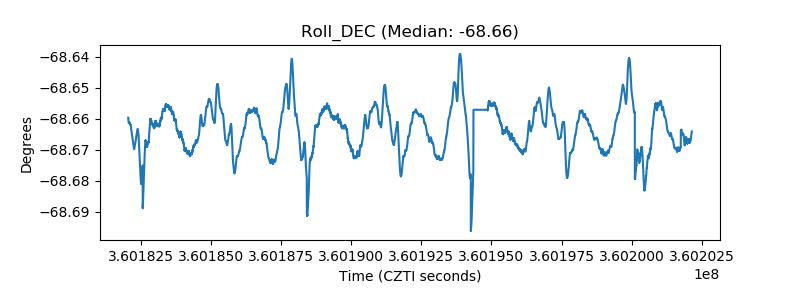 |
| _Roll_RA | 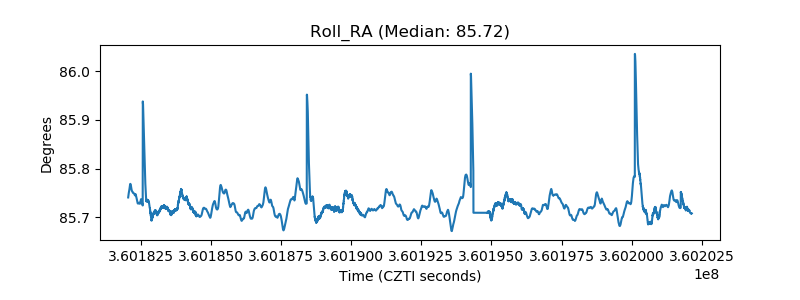 |
| Veto Counter | 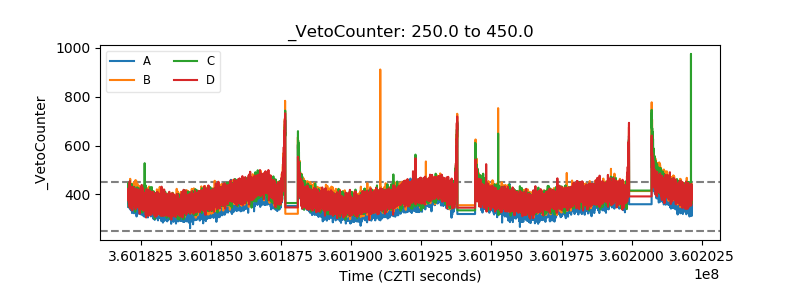 |