| Param | Original file | Final file |
|---|---|---|
| Filename | modeM0/AS1A10_094T81_9000004426_30682cztM0_level2.evt | modeM0/AS1A10_094T81_9000004426_30682cztM0_level2_quad_clean.evt |
| Size (bytes) | 720,325,440 | 129,360,960 |
| Size | 687.0 MB | 123.4 MB |
| Events in quadrant A | 3,432,948 | 904,197 |
| Events in quadrant B | 5,265,255 | 900,871 |
| Events in quadrant C | 3,397,580 | 868,655 |
| Events in quadrant D | 9,266,255 | 775,494 |
| Mode M9 | |||
|---|---|---|---|
| Quadrant | BADHDUFLAG | Total packets | Discarded packets |
| A | 0 | 12 | 0 |
| B | 0 | 13 | 0 |
| C | 0 | 13 | 0 |
| D | 0 | 13 | 0 |
| Mode M0 | |||
|---|---|---|---|
| Quadrant | BADHDUFLAG | Total packets | Discarded packets |
| A | 0 | 14408 | 2 |
| B | 0 | 20418 | 2 |
| C | 0 | 14068 | 2 |
| D | 0 | 32279 | 2 |
| Mode SS | |||
|---|---|---|---|
| Quadrant | BADHDUFLAG | Total packets | Discarded packets |
| A | 0 | 136 | 0 |
| B | 0 | 136 | 0 |
| C | 0 | 136 | 0 |
| D | 0 | 136 | 0 |
| Quadrant | Total seconds | Saturated seconds | Saturation percentage |
|---|---|---|---|
| A | 6721 | 90 | 1.339086% |
| B | 6721 | 104 | 1.547389% |
| C | 6721 | 108 | 1.606904% |
| D | 6721 | 1234 | 18.360363% |
Noise dominated data is calculated using 1-second bins in cleaned event files. If a bin has >2000 counts, and if more than 50% of those come from <1% of pixels, then it is considered to be noise-dominated and hence unusable.
| Quadrant | # 1 sec bins | Bins with >0 counts | Bins with >2000 counts | High rate bins dominated by noise | Noise dominated (total time) | Noise dominated (detector-on time) | Marked lightcurve |
|---|---|---|---|---|---|---|---|
| A | 7676 | 6722 | 35 | 35 | 0.46% | 0.52% | 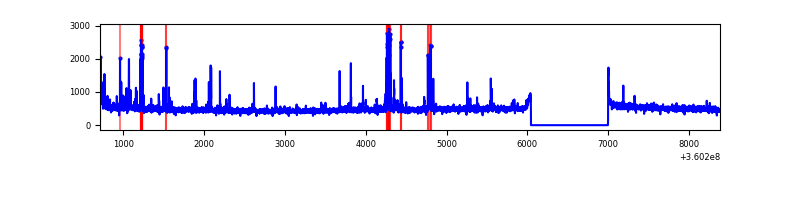 |
| B | 7676 | 6722 | 1 | 1 | 0.01% | 0.01% | 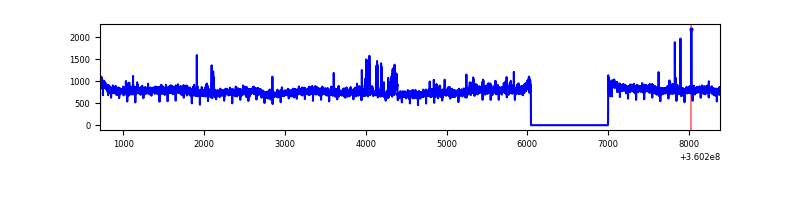 |
| C | 7676 | 6722 | 9 | 9 | 0.12% | 0.13% | 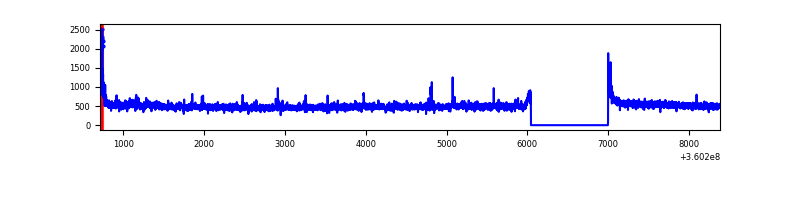 |
| D | 7676 | 6722 | 1240 | 1240 | 16.15% | 18.45% | 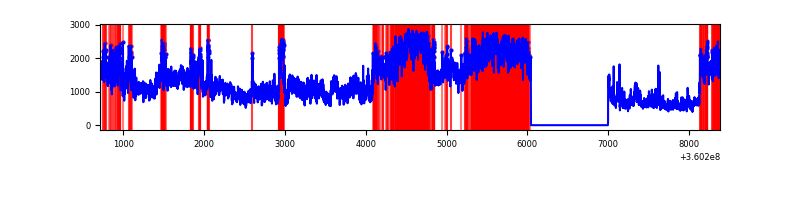 |
Top three noisy pixels from each quadrant. If the there are fewer than three noisy pixels in the level2.evt file, extra rows are filled as -1
| Pixel properties | Quadrant properties | ||||||
|---|---|---|---|---|---|---|---|
| Quadrant | DetID | PixID | Counts | Sigma | Mean | Median | Sigma |
| A | 0 | 13 | 245303 | 1491.4 | 820 | 803 | 163.9 |
| A | 8 | 192 | 22118 | 130.02 | 820 | 803 | 163.9 |
| A | 13 | 254 | 13446 | 77.12 | 820 | 803 | 163.9 |
| B | 6 | 159 | 1924965 | 12483.59 | 816 | 798 | 154.1 |
| B | 0 | 190 | 80492 | 517.04 | 816 | 798 | 154.1 |
| B | 12 | 111 | 19085 | 118.64 | 816 | 798 | 154.1 |
| C | 14 | 238 | 128856 | 700.59 | 792 | 798 | 182.8 |
| C | 3 | 233 | 95962 | 520.63 | 792 | 798 | 182.8 |
| C | 0 | 10 | 56026 | 302.15 | 792 | 798 | 182.8 |
| D | 8 | 195 | 4786411 | 26727.83 | 752 | 732 | 179.1 |
| D | 12 | 227 | 625963 | 3491.89 | 752 | 732 | 179.1 |
| D | 12 | 233 | 445084 | 2481.69 | 752 | 732 | 179.1 |
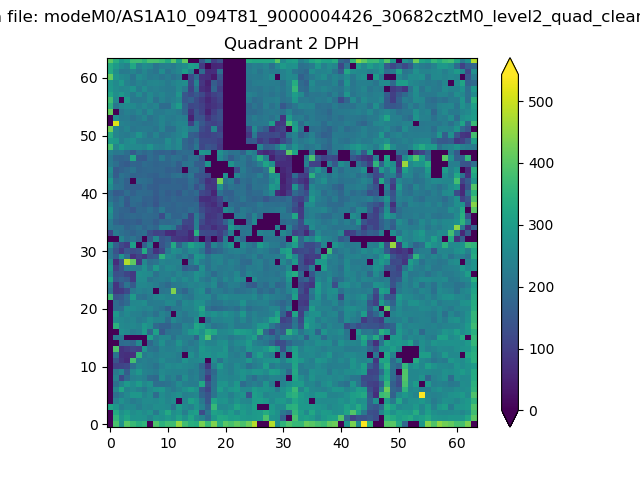
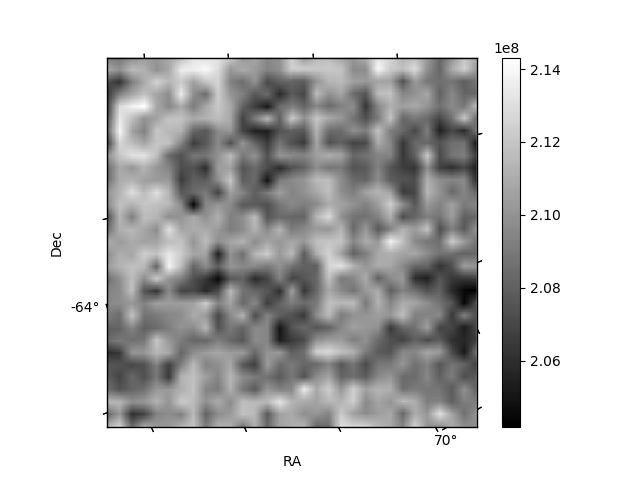
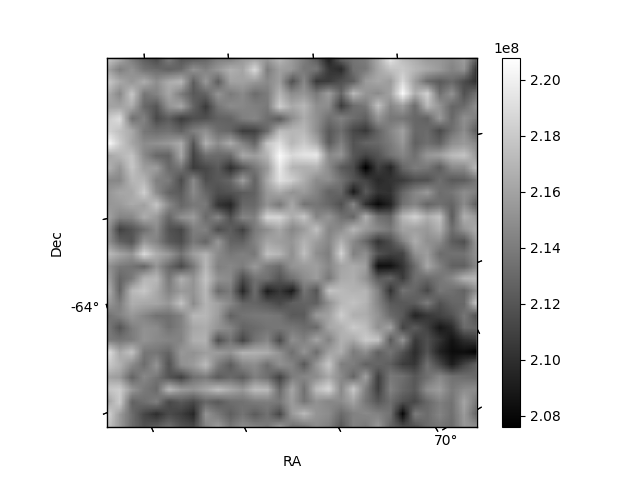
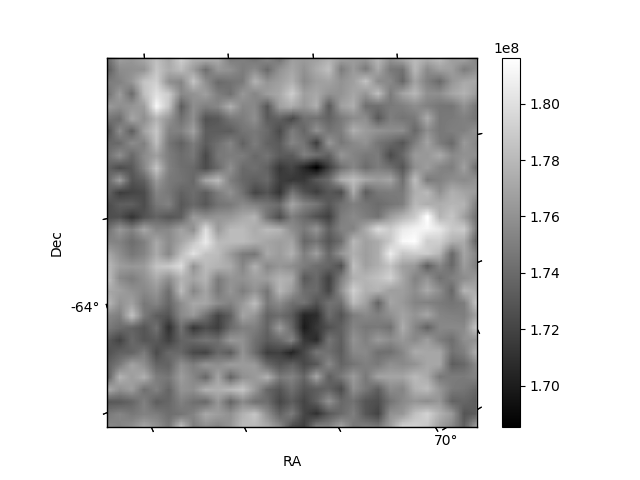
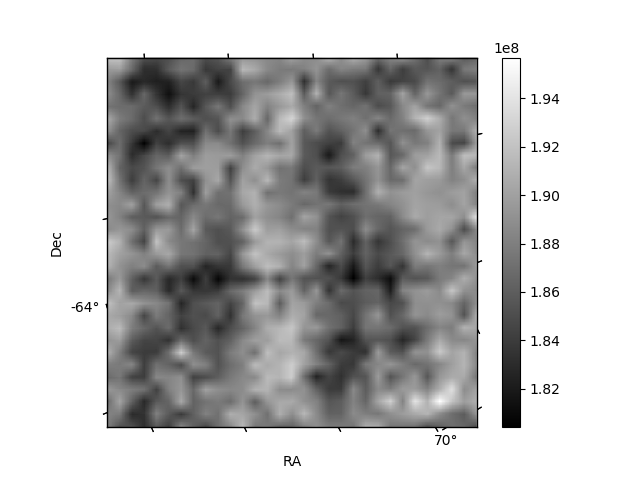
Histogram calculated using DETX and DETY for each event in the final _common_clean file
| Quadrant A | 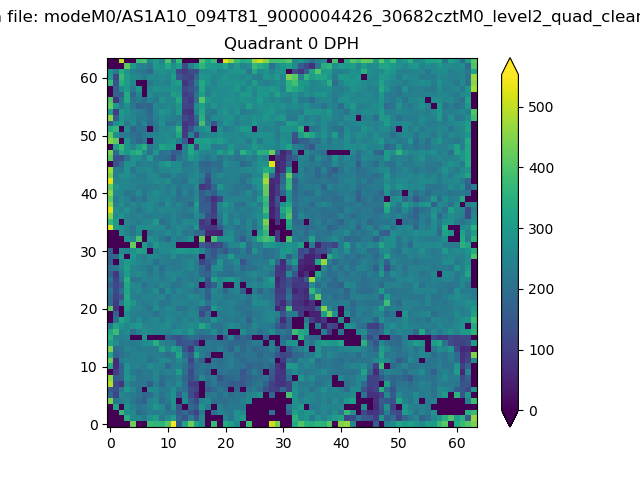 |
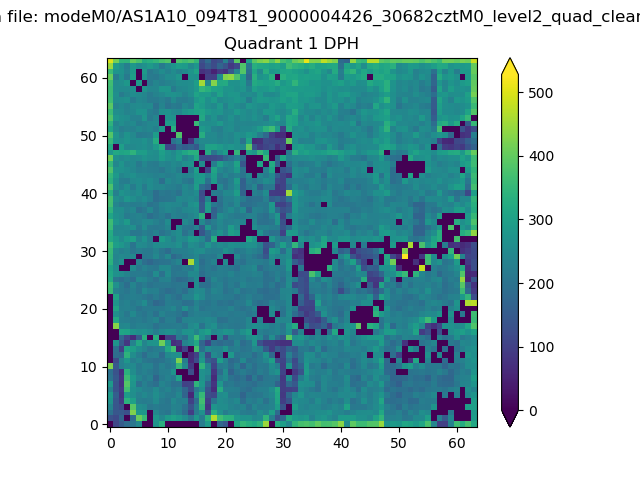 |
Quadrant B |
|---|---|---|---|
| Quadrant D | 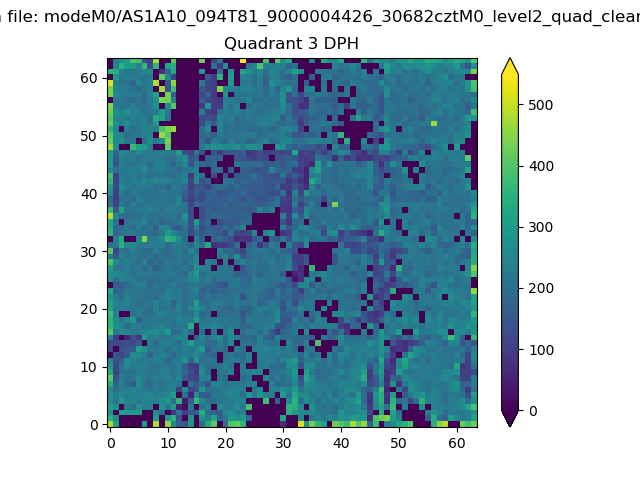 |
 |
Quadrant C |
| Plot type | Count rate plots | Images |
|---|---|---|
| Comparison with Poisson distribution Blue bars denote a histogram of data divided into 1 sec bins. Red curve is a Poisson curve with rate = median count rate of data. |
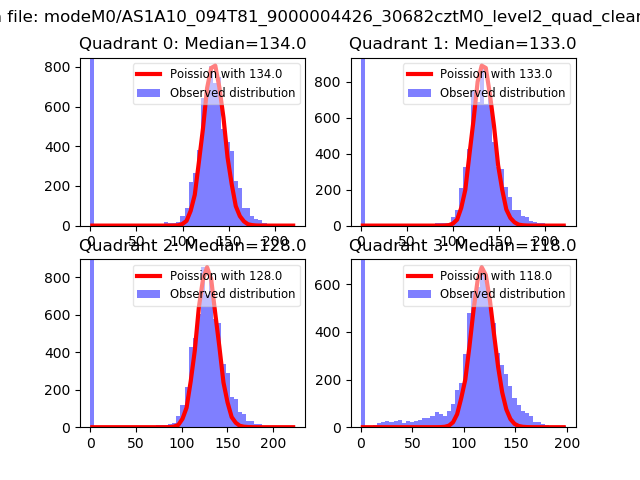 |
 |
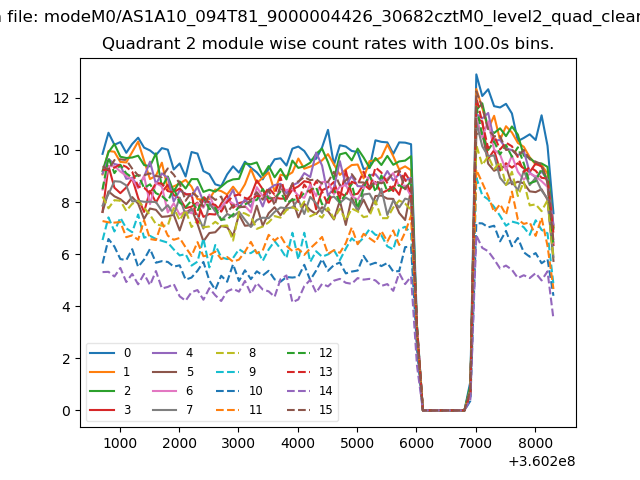
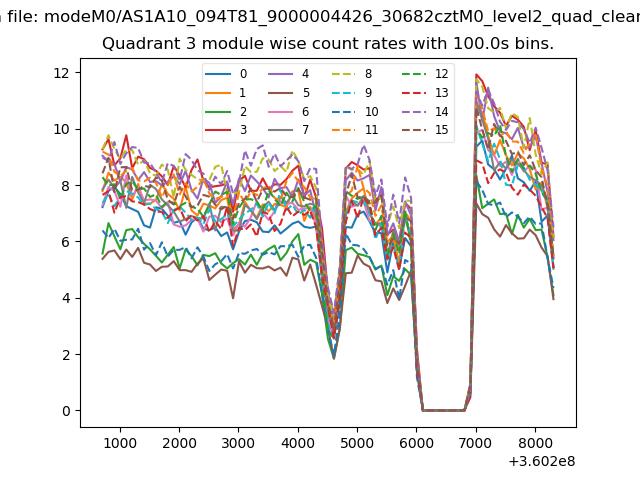
| Quadrant-wise count rates Data is divided into 100 sec bins |
 |
|
| Module-wise count rates for Quadrant A Data is divided into 100 sec bins |
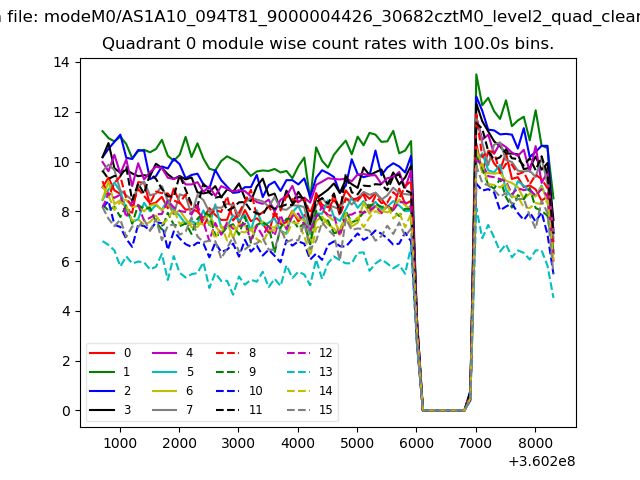 |
 |
| Module-wise count rates for Quadrant B Data is divided into 100 sec bins |
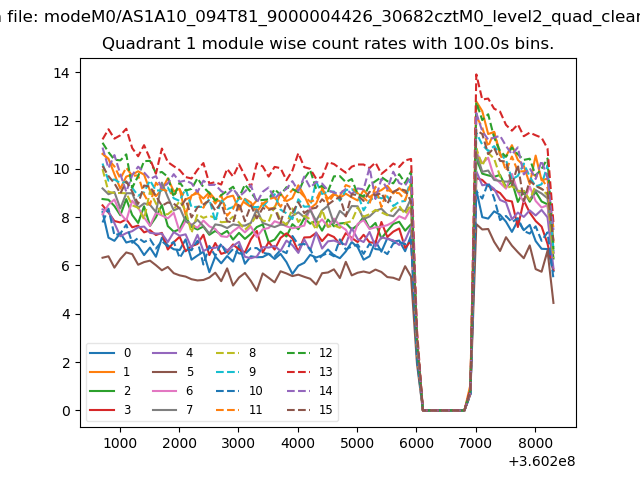 |
 |
| Module-wise count rates for Quadrant C Data is divided into 100 sec bins |
 |
 |
| Module-wise count rates for Quadrant D Data is divided into 100 sec bins |
 |
 |
| Parameter | Plot |
|---|---|
| CZT HV Monitor |  |
| D_VDD | 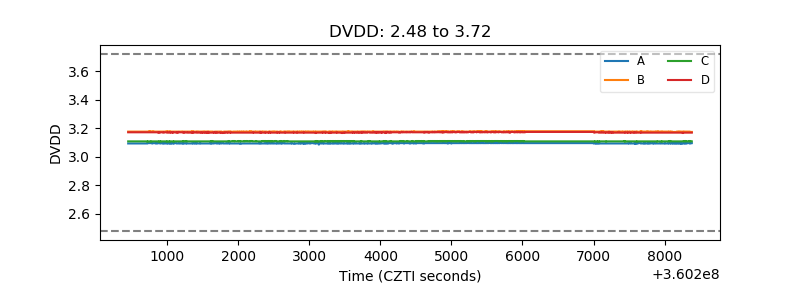 |
| Temperature 1 | 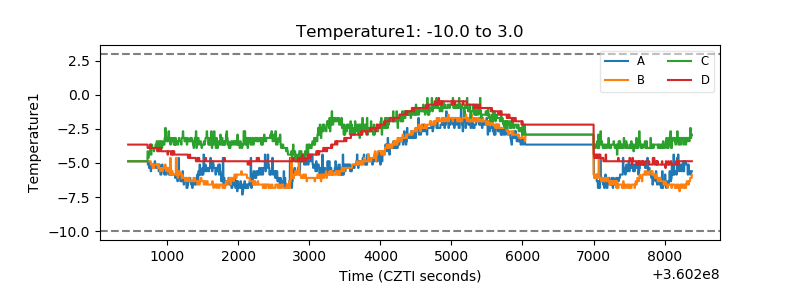 |
| Veto HV Monitor | 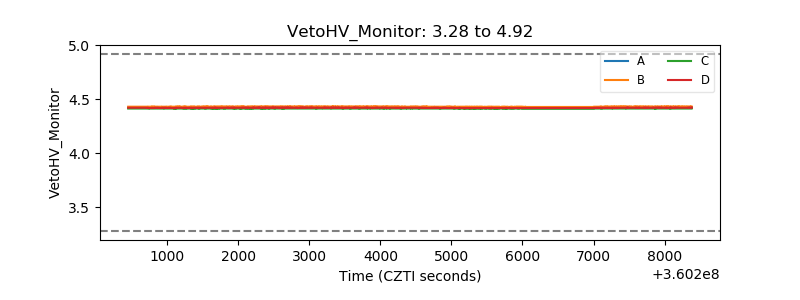 |
| Veto LLD | 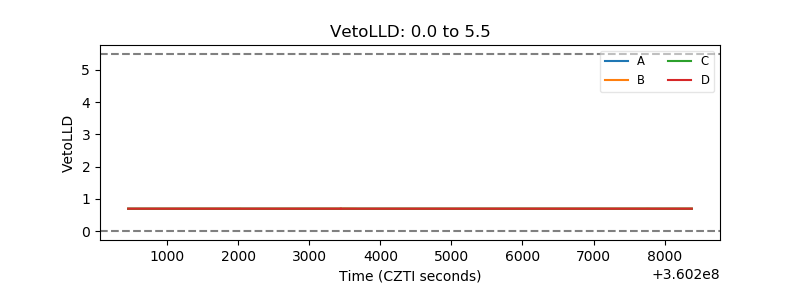 |
| Alpha Counter | 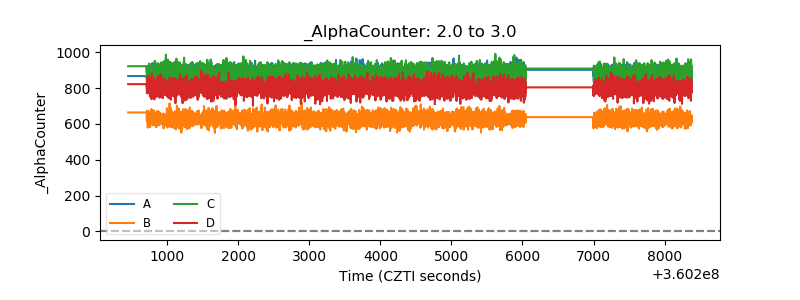 |
| _CPM_Rate | 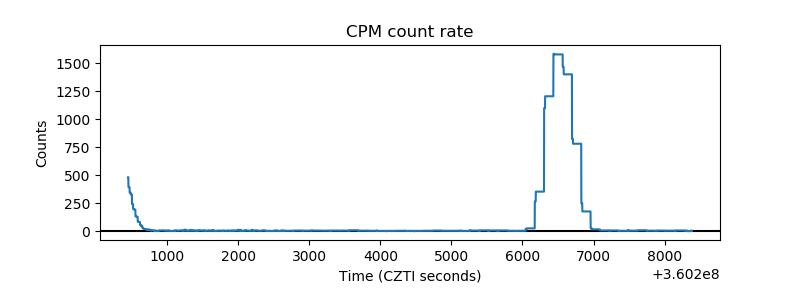 |
| CZT Counter | 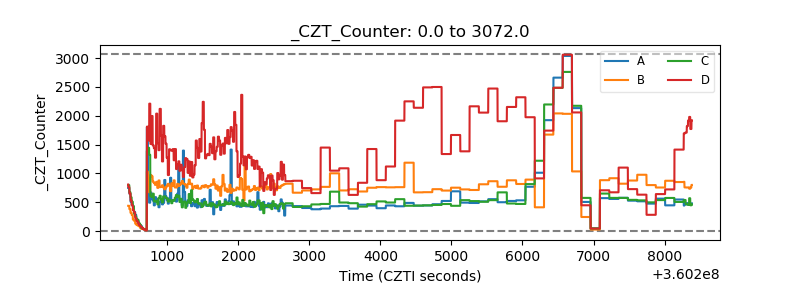 |
| +2.5 Volts monitor |  |
| +5 Volts monitor |  |
| _ROLL_ROT | 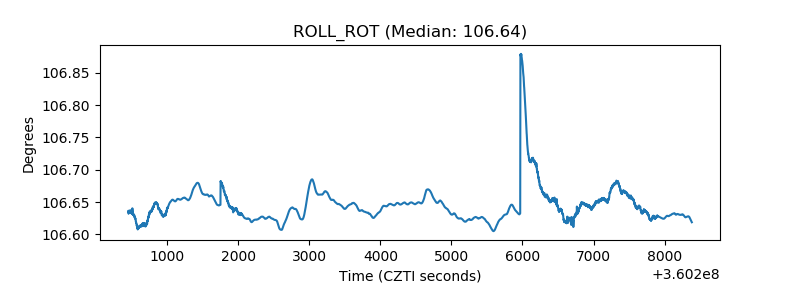 |
| _Roll_DEC | 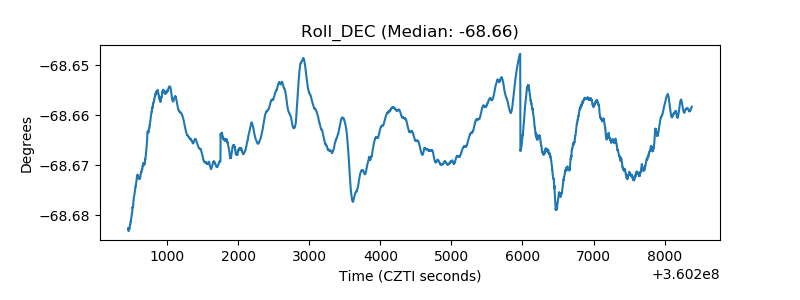 |
| _Roll_RA | 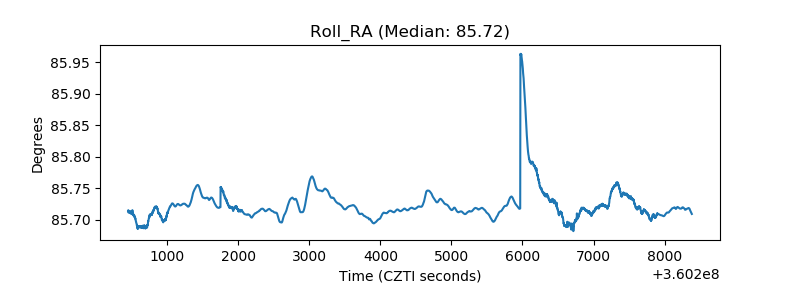 |
| Veto Counter | 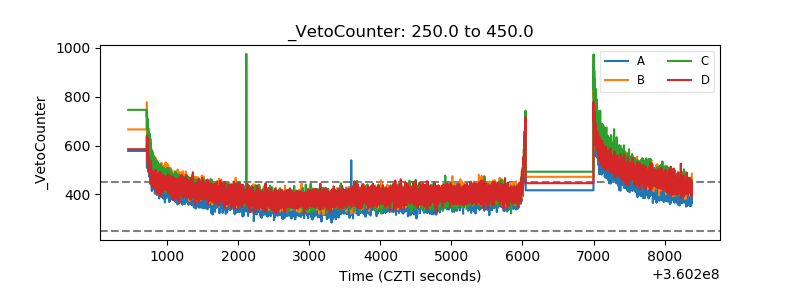 |