| Param | Original file | Final file |
|---|---|---|
| Filename | modeM0/AS1A10_094T81_9000004426_30685cztM0_level2.evt | modeM0/AS1A10_094T81_9000004426_30685cztM0_level2_quad_clean.evt |
| Size (bytes) | 1,325,465,280 | 217,143,360 |
| Size | 1.2 GB | 207.1 MB |
| Events in quadrant A | 6,129,948 | 1,544,265 |
| Events in quadrant B | 8,286,263 | 1,553,022 |
| Events in quadrant C | 5,890,397 | 1,509,843 |
| Events in quadrant D | 19,124,624 | 1,235,395 |
| Mode M9 | |||
|---|---|---|---|
| Quadrant | BADHDUFLAG | Total packets | Discarded packets |
| A | 0 | 24 | 0 |
| B | 0 | 24 | 0 |
| C | 0 | 24 | 0 |
| D | 0 | 24 | 0 |
| Mode M0 | |||
|---|---|---|---|
| Quadrant | BADHDUFLAG | Total packets | Discarded packets |
| A | 0 | 25020 | 2 |
| B | 0 | 32254 | 2 |
| C | 0 | 24282 | 2 |
| D | 0 | 64192 | 3 |
| Mode SS | |||
|---|---|---|---|
| Quadrant | BADHDUFLAG | Total packets | Discarded packets |
| A | 0 | 214 | 0 |
| B | 0 | 214 | 0 |
| C | 0 | 214 | 0 |
| D | 0 | 214 | 0 |
| Quadrant | Total seconds | Saturated seconds | Saturation percentage |
|---|---|---|---|
| A | 10587 | 274 | 2.588080% |
| B | 10588 | 166 | 1.567813% |
| C | 10588 | 281 | 2.653948% |
| D | 10587 | 4419 | 41.739870% |
Noise dominated data is calculated using 1-second bins in cleaned event files. If a bin has >2000 counts, and if more than 50% of those come from <1% of pixels, then it is considered to be noise-dominated and hence unusable.
| Quadrant | # 1 sec bins | Bins with >0 counts | Bins with >2000 counts | High rate bins dominated by noise | Noise dominated (total time) | Noise dominated (detector-on time) | Marked lightcurve |
|---|---|---|---|---|---|---|---|
| A | 12907 | 10589 | 148 | 148 | 1.15% | 1.40% | 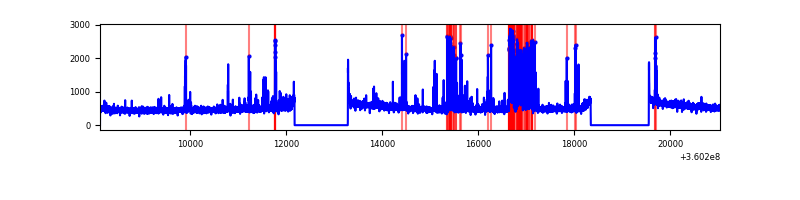 |
| B | 12908 | 10590 | 4 | 4 | 0.03% | 0.04% | 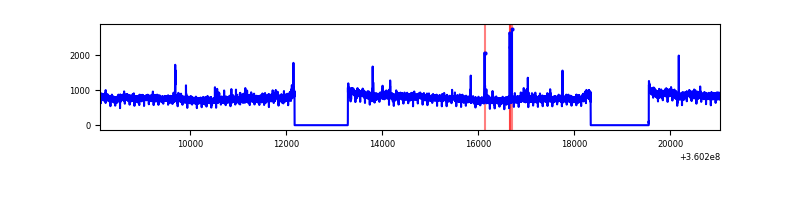 |
| C | 12908 | 10590 | 78 | 78 | 0.60% | 0.74% | 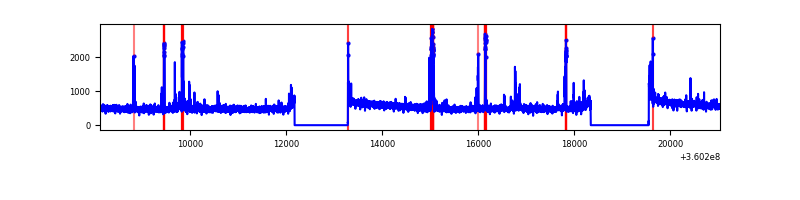 |
| D | 12907 | 10589 | 4736 | 4736 | 36.69% | 44.73% | 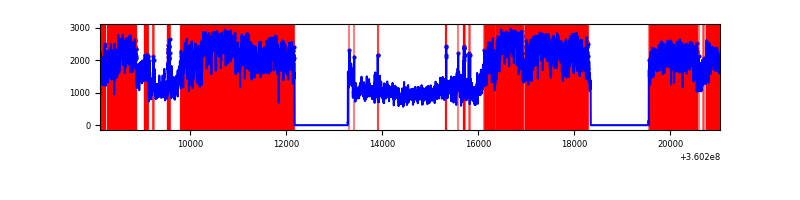 |
Top three noisy pixels from each quadrant. If the there are fewer than three noisy pixels in the level2.evt file, extra rows are filled as -1
| Pixel properties | Quadrant properties | ||||||
|---|---|---|---|---|---|---|---|
| Quadrant | DetID | PixID | Counts | Sigma | Mean | Median | Sigma |
| A | 0 | 13 | 881336 | 3308.03 | 1355 | 1331 | 266.0 |
| A | 8 | 192 | 21820 | 77.02 | 1355 | 1331 | 266.0 |
| A | 13 | 254 | 18854 | 65.87 | 1355 | 1331 | 266.0 |
| B | 6 | 159 | 2931369 | 11834.38 | 1341 | 1310 | 247.6 |
| B | 12 | 111 | 29716 | 114.73 | 1341 | 1310 | 247.6 |
| B | 11 | 111 | 27384 | 105.31 | 1341 | 1310 | 247.6 |
| C | 10 | 22 | 367480 | 1219.2 | 1316 | 1323 | 300.3 |
| C | 14 | 238 | 218989 | 724.76 | 1316 | 1323 | 300.3 |
| C | 3 | 233 | 104045 | 342.03 | 1316 | 1323 | 300.3 |
| D | 8 | 195 | 9065599 | 32957.71 | 1185 | 1155 | 275.0 |
| D | 12 | 227 | 4095678 | 14887.41 | 1185 | 1155 | 275.0 |
| D | 10 | 253 | 788764 | 2863.69 | 1185 | 1155 | 275.0 |
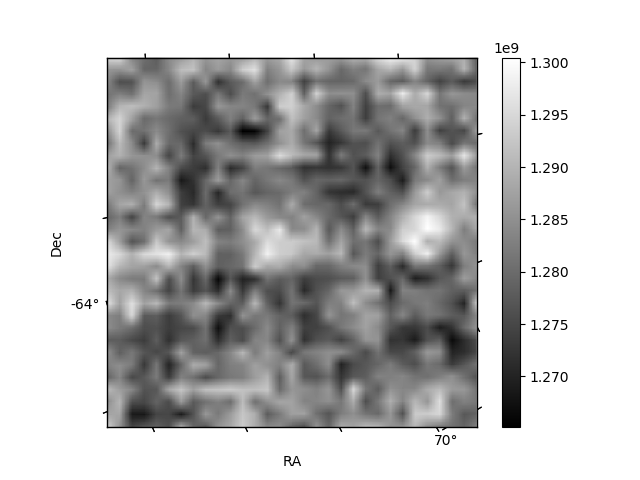
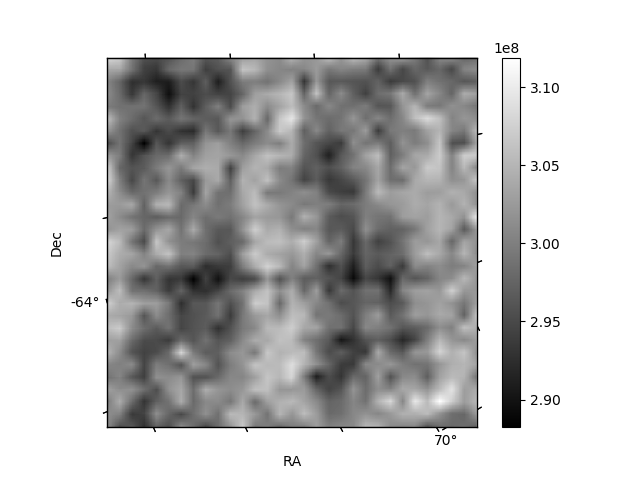
Histogram calculated using DETX and DETY for each event in the final _common_clean file
| Quadrant A | 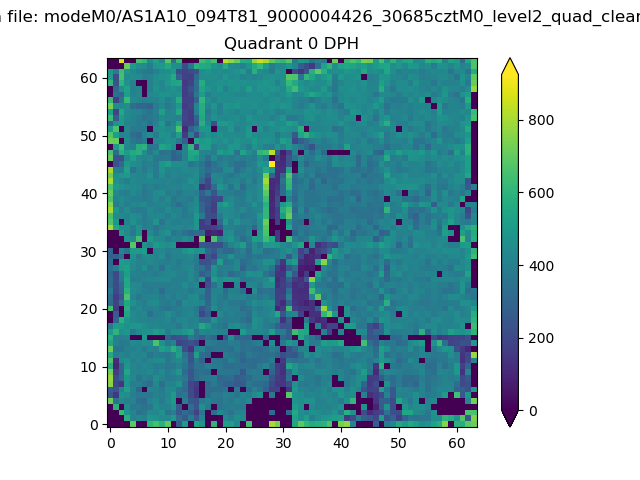 |
 |
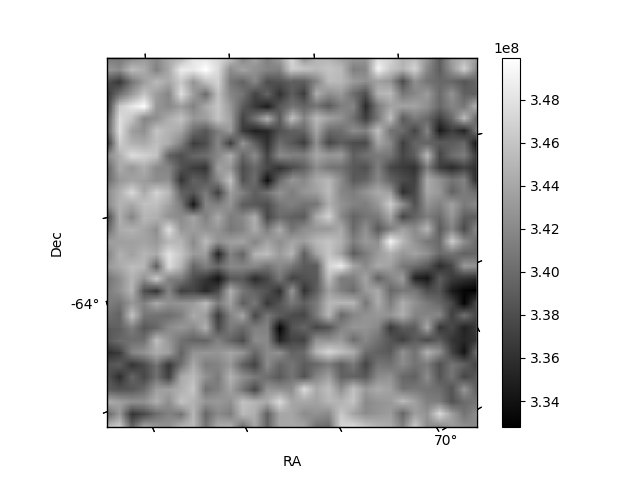
Quadrant B |
|---|---|---|---|
| Quadrant D | 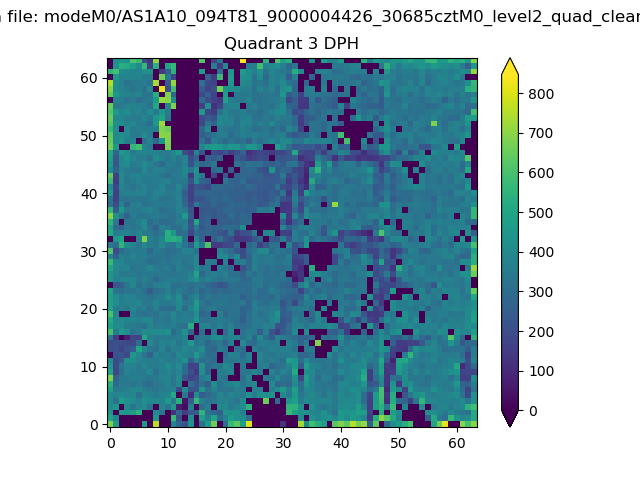 |
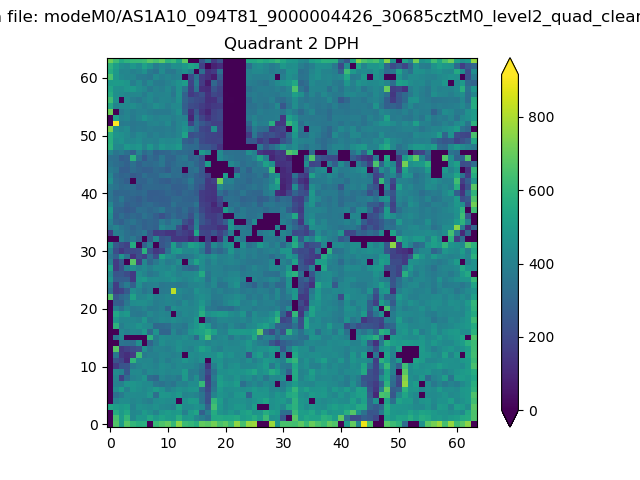 |
Quadrant C |
| Plot type | Count rate plots | Images |
|---|---|---|
| Comparison with Poisson distribution Blue bars denote a histogram of data divided into 1 sec bins. Red curve is a Poisson curve with rate = median count rate of data. |
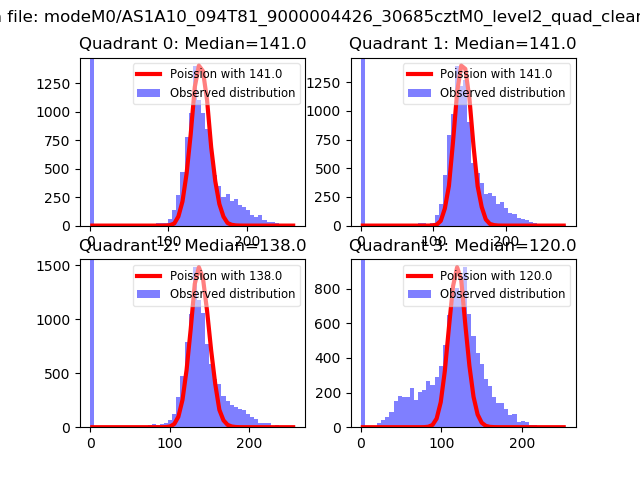 |
 |
| Quadrant-wise count rates Data is divided into 100 sec bins |
 |
|
| Module-wise count rates for Quadrant A Data is divided into 100 sec bins |
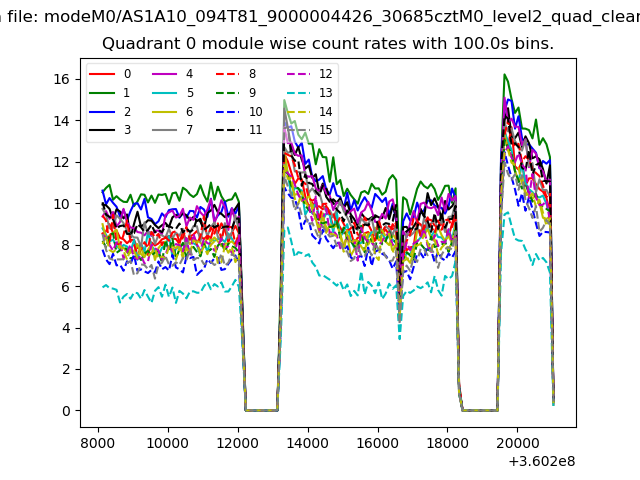 |
 |
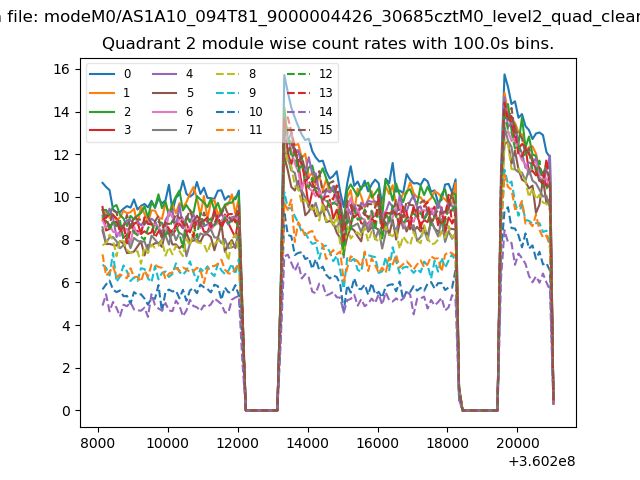
| Module-wise count rates for Quadrant B Data is divided into 100 sec bins |
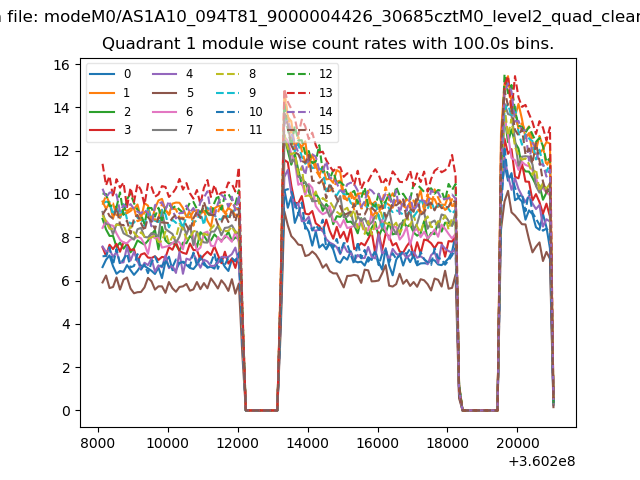 |
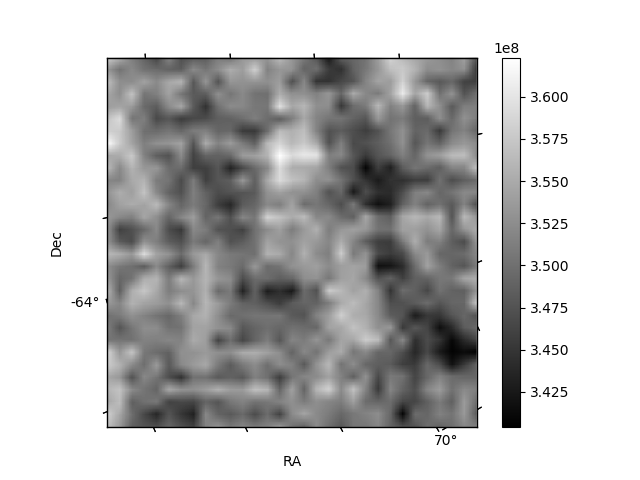 |
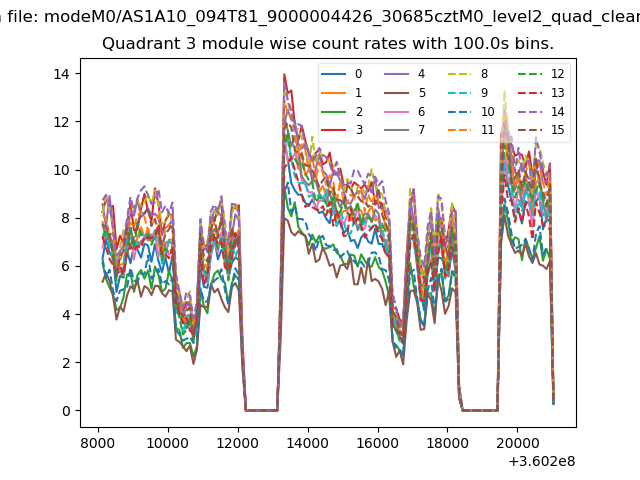
| Module-wise count rates for Quadrant C Data is divided into 100 sec bins |
 |
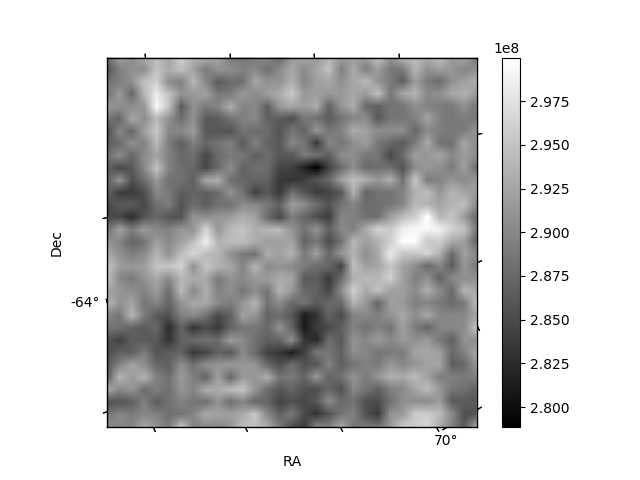 |
| Module-wise count rates for Quadrant D Data is divided into 100 sec bins |
 |
 |
| Parameter | Plot |
|---|---|
| CZT HV Monitor |  |
| D_VDD | 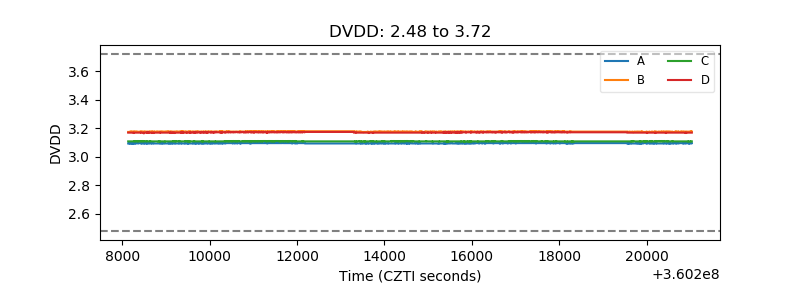 |
| Temperature 1 | 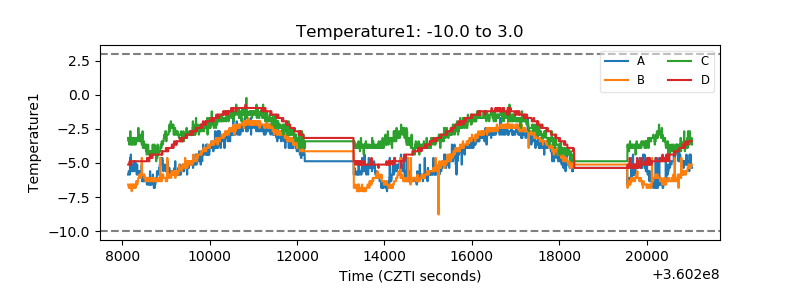 |
| Veto HV Monitor | 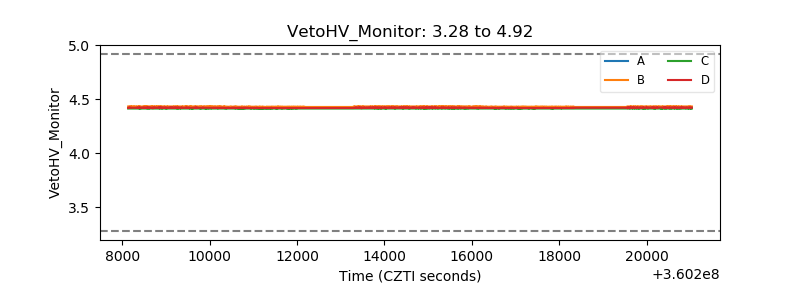 |
| Veto LLD | 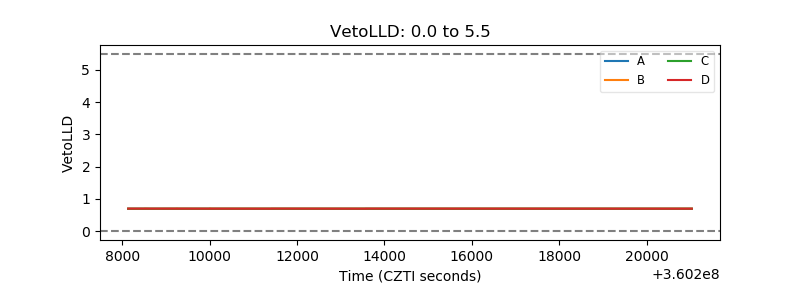 |
| Alpha Counter | 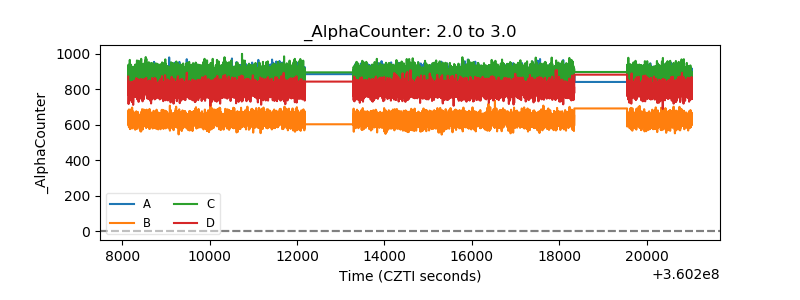 |
| _CPM_Rate | 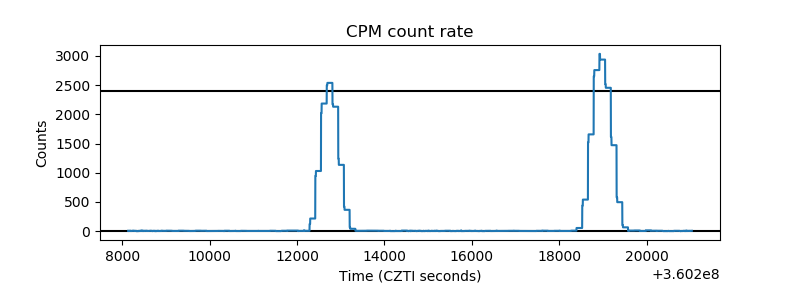 |
| CZT Counter | 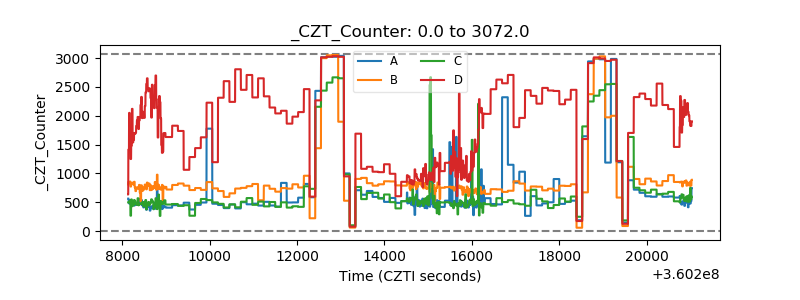 |
| +2.5 Volts monitor |  |
| +5 Volts monitor |  |
| _ROLL_ROT | 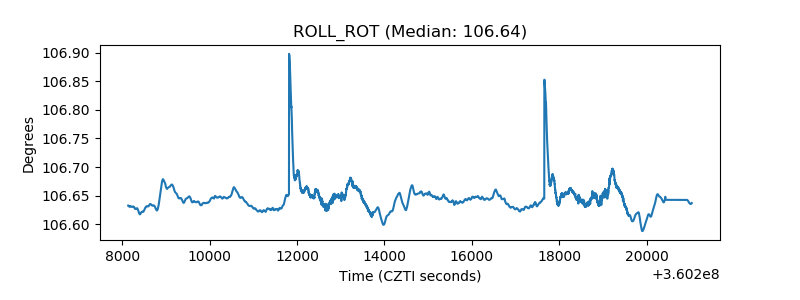 |
| _Roll_DEC | 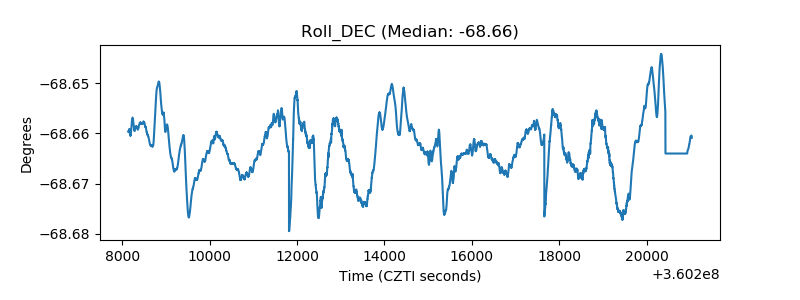 |
| _Roll_RA | 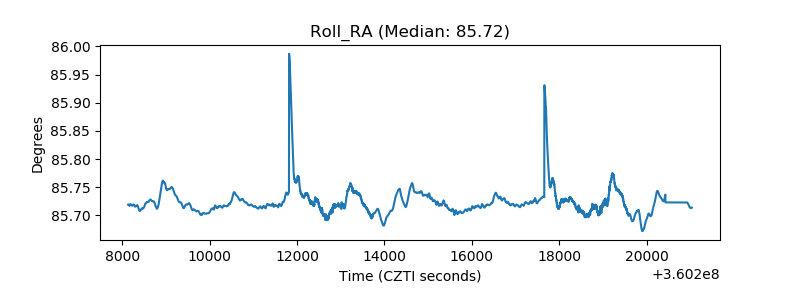 |
| Veto Counter | 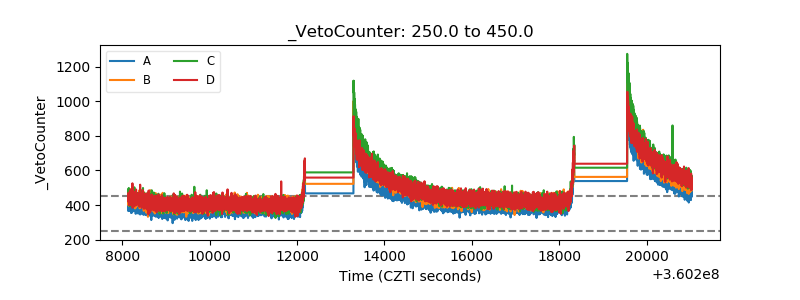 |