| Param | Original file | Final file |
|---|---|---|
| Filename | modeM0/AS1A10_094T81_9000004426_30686cztM0_level2.evt | modeM0/AS1A10_094T81_9000004426_30686cztM0_level2_quad_clean.evt |
| Size (bytes) | 502,914,240 | 85,832,640 |
| Size | 479.6 MB | 81.9 MB |
| Events in quadrant A | 2,146,234 | 612,368 |
| Events in quadrant B | 3,074,686 | 613,973 |
| Events in quadrant C | 2,101,332 | 602,436 |
| Events in quadrant D | 7,642,241 | 492,380 |
| Mode M0 | |||
|---|---|---|---|
| Quadrant | BADHDUFLAG | Total packets | Discarded packets |
| A | 0 | 8698 | 0 |
| B | 0 | 11889 | 0 |
| C | 0 | 8685 | 0 |
| D | 0 | 25388 | 0 |
| Mode SS | |||
|---|---|---|---|
| Quadrant | BADHDUFLAG | Total packets | Discarded packets |
| A | 0 | 78 | 0 |
| B | 0 | 78 | 0 |
| C | 0 | 78 | 0 |
| D | 0 | 78 | 0 |
| Quadrant | Total seconds | Saturated seconds | Saturation percentage |
|---|---|---|---|
| A | 3933 | 17 | 0.432240% |
| B | 3934 | 20 | 0.508388% |
| C | 3934 | 25 | 0.635486% |
| D | 3934 | 1824 | 46.365023% |
Noise dominated data is calculated using 1-second bins in cleaned event files. If a bin has >2000 counts, and if more than 50% of those come from <1% of pixels, then it is considered to be noise-dominated and hence unusable.
| Quadrant | # 1 sec bins | Bins with >0 counts | Bins with >2000 counts | High rate bins dominated by noise | Noise dominated (total time) | Noise dominated (detector-on time) | Marked lightcurve |
|---|---|---|---|---|---|---|---|
| A | 3933 | 3933 | 16 | 16 | 0.41% | 0.41% | 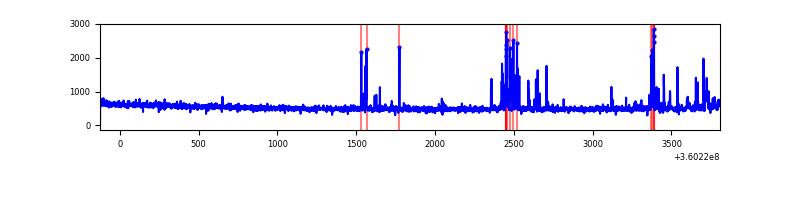 |
| B | 3934 | 3934 | 0 | 0 | 0.00% | 0.00% | 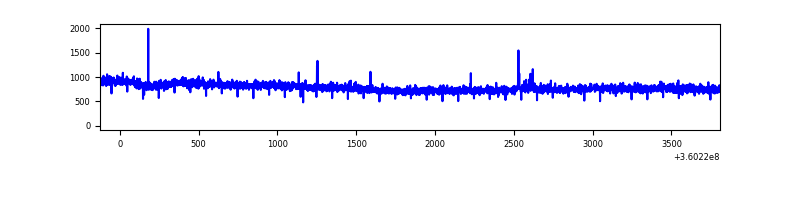 |
| C | 3934 | 3934 | 0 | 0 | 0.00% | 0.00% | 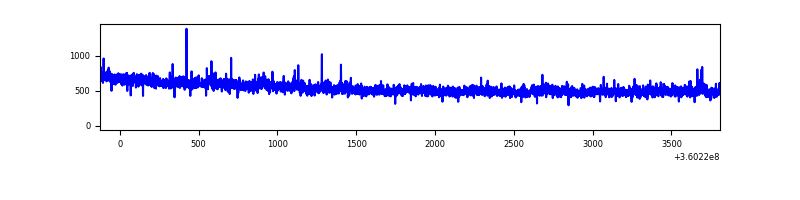 |
| D | 3934 | 3934 | 2055 | 2055 | 52.24% | 52.24% | 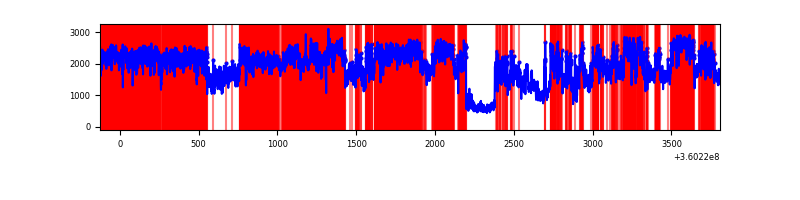 |
Top three noisy pixels from each quadrant. If the there are fewer than three noisy pixels in the level2.evt file, extra rows are filled as -1
| Pixel properties | Quadrant properties | ||||||
|---|---|---|---|---|---|---|---|
| Quadrant | DetID | PixID | Counts | Sigma | Mean | Median | Sigma |
| A | 0 | 13 | 153996 | 1491.22 | 516 | 508 | 102.9 |
| A | 13 | 254 | 6566 | 58.86 | 516 | 508 | 102.9 |
| A | 3 | 137 | 4582 | 39.58 | 516 | 508 | 102.9 |
| B | 6 | 159 | 1079910 | 11505.82 | 505 | 494 | 93.8 |
| B | 12 | 111 | 10577 | 107.48 | 505 | 494 | 93.8 |
| B | 11 | 111 | 9852 | 99.75 | 505 | 494 | 93.8 |
| C | 14 | 238 | 83109 | 721.98 | 499 | 504 | 114.4 |
| C | 3 | 233 | 59466 | 515.34 | 499 | 504 | 114.4 |
| C | 2 | 114 | 8800 | 72.51 | 499 | 504 | 114.4 |
| D | 8 | 195 | 4664145 | 43988.48 | 456 | 445 | 106.0 |
| D | 12 | 227 | 678799 | 6398.3 | 456 | 445 | 106.0 |
| D | 2 | 250 | 260834 | 2456.01 | 456 | 445 | 106.0 |
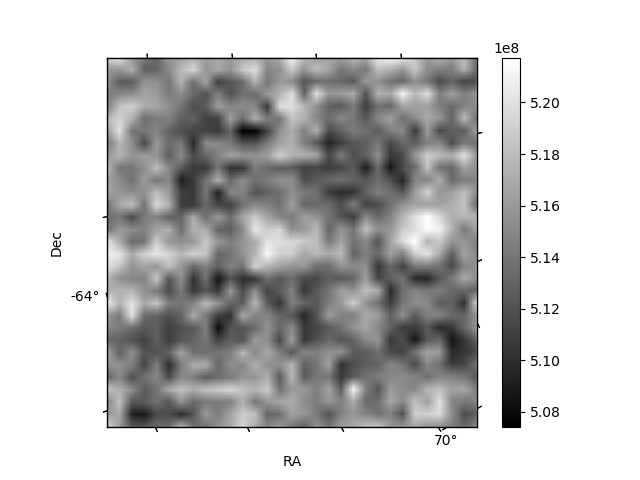
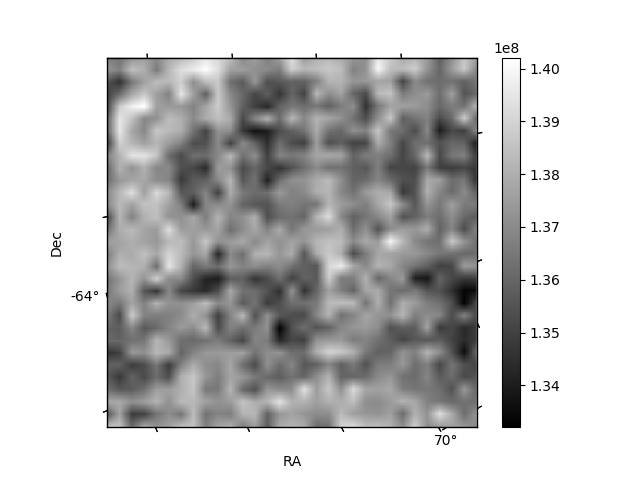
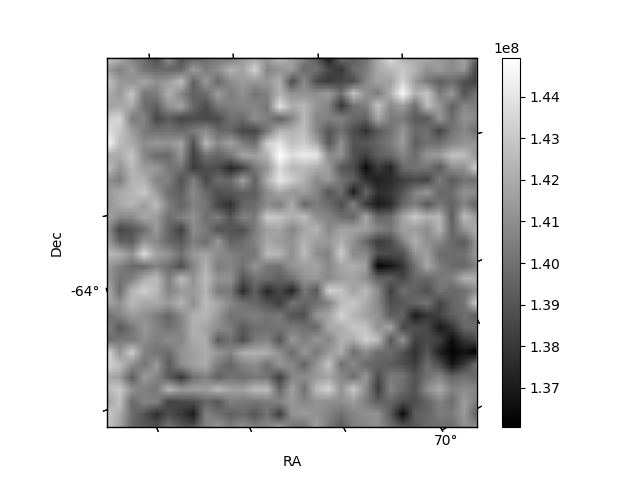
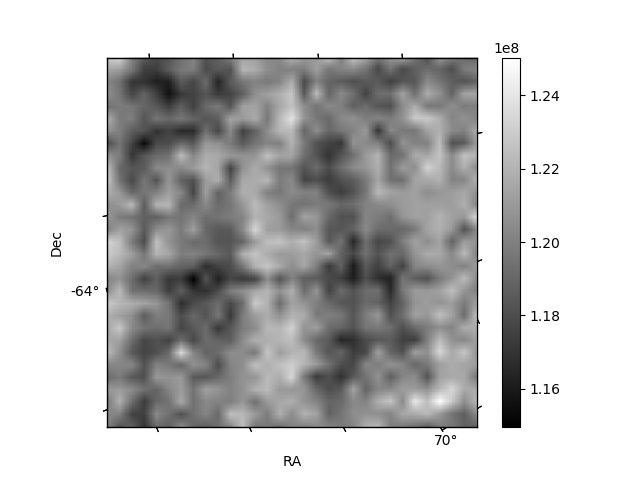
Histogram calculated using DETX and DETY for each event in the final _common_clean file
| Quadrant A | 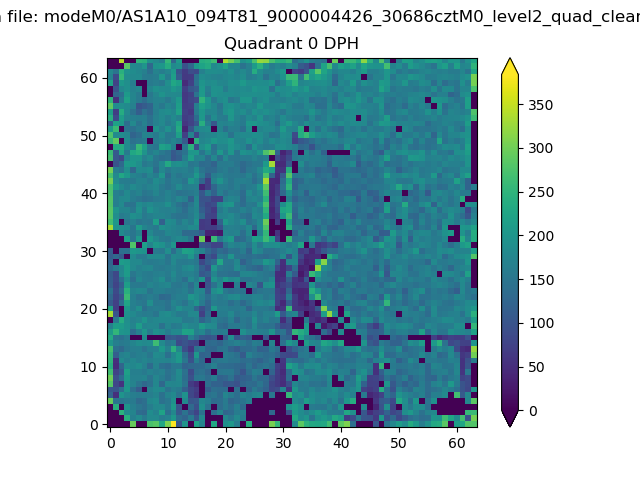 |
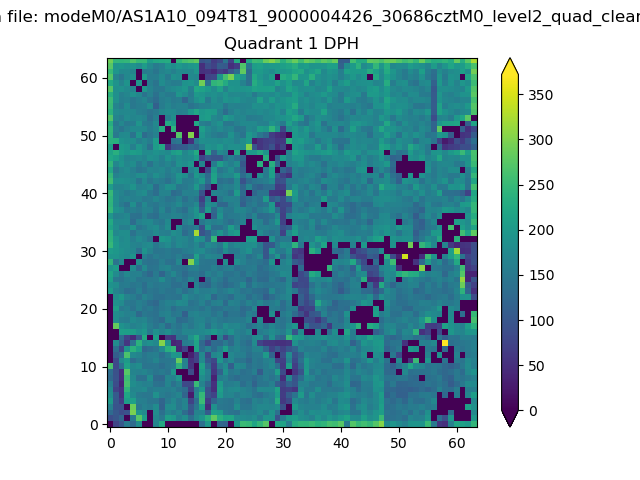 |
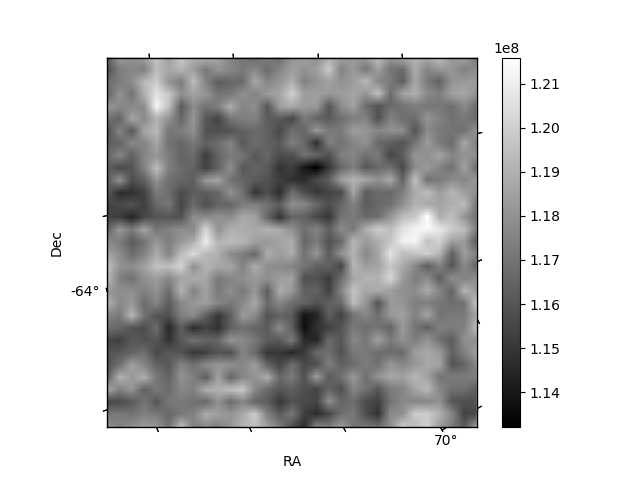
Quadrant B |
|---|---|---|---|
| Quadrant D | 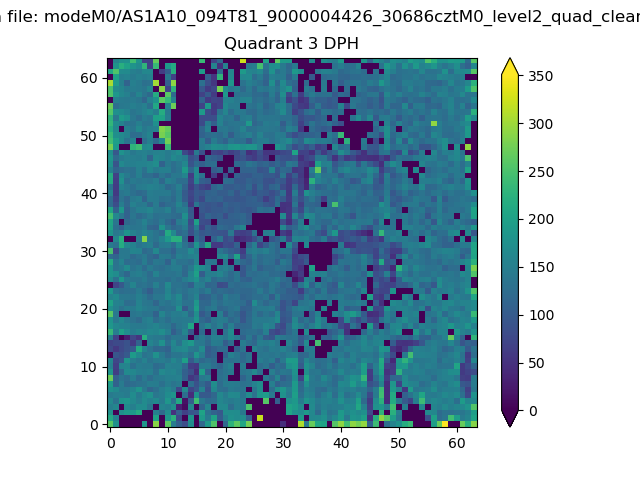 |
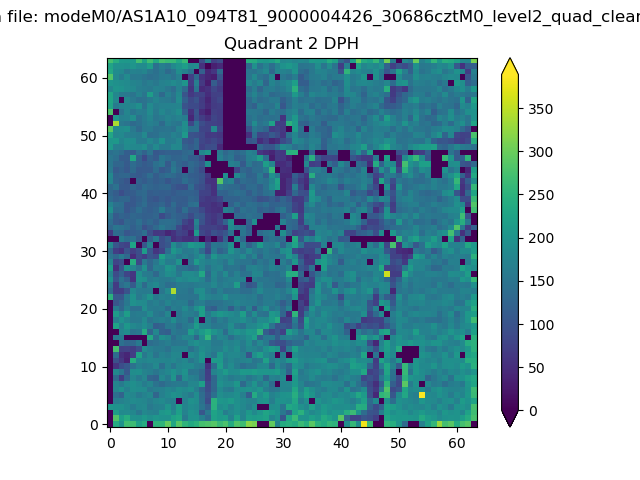 |
Quadrant C |
| Plot type | Count rate plots | Images |
|---|---|---|
| Comparison with Poisson distribution Blue bars denote a histogram of data divided into 1 sec bins. Red curve is a Poisson curve with rate = median count rate of data. |
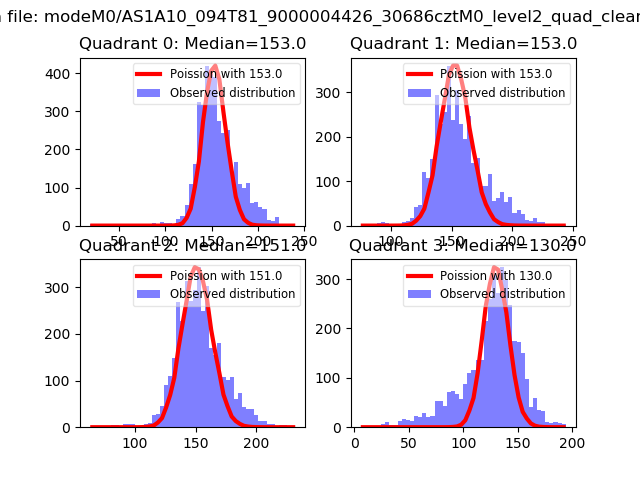 |
 |
| Quadrant-wise count rates Data is divided into 100 sec bins |
 |
|
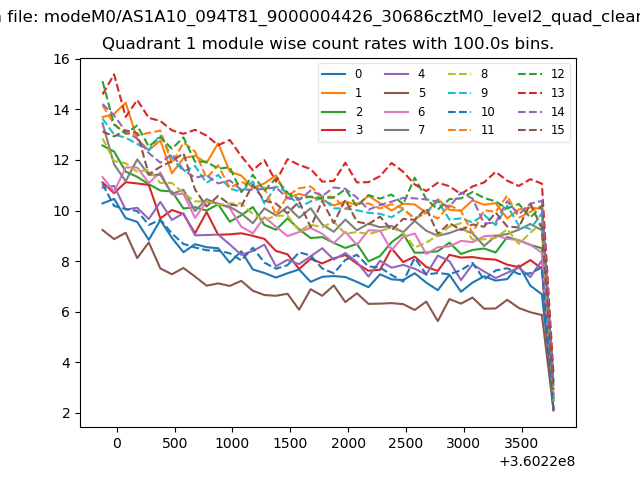
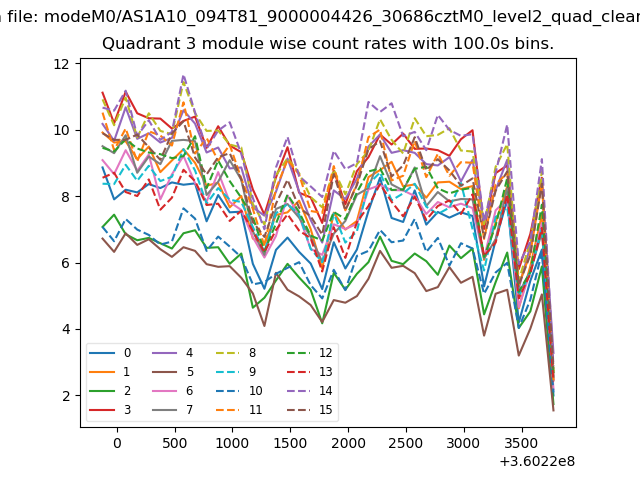
| Module-wise count rates for Quadrant A Data is divided into 100 sec bins |
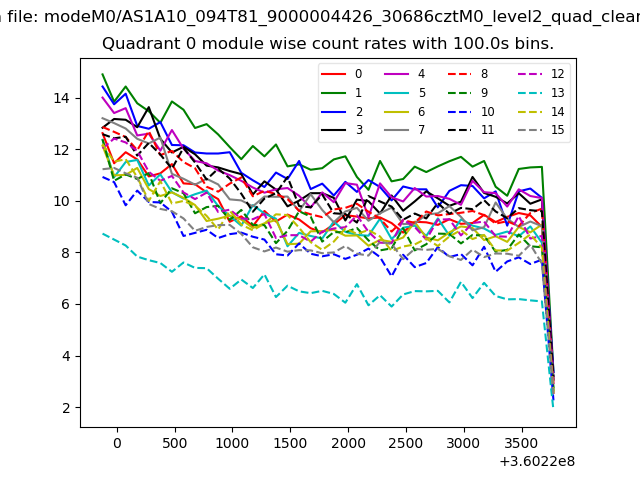 |
 |
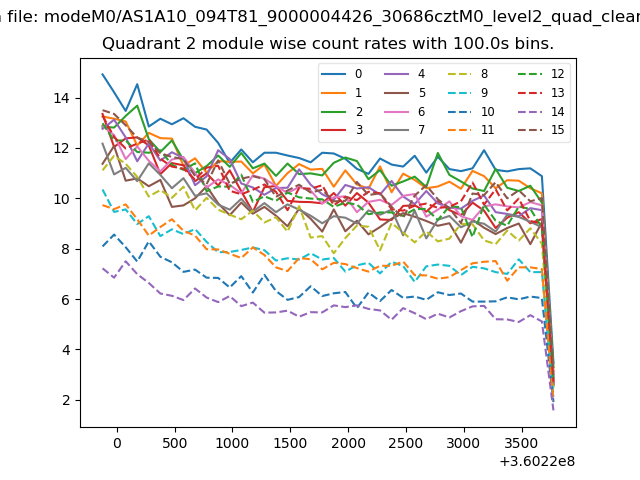
| Module-wise count rates for Quadrant B Data is divided into 100 sec bins |
 |
 |
| Module-wise count rates for Quadrant C Data is divided into 100 sec bins |
 |
 |
| Module-wise count rates for Quadrant D Data is divided into 100 sec bins |
 |
 |
| Parameter | Plot |
|---|---|
| CZT HV Monitor |  |
| D_VDD | 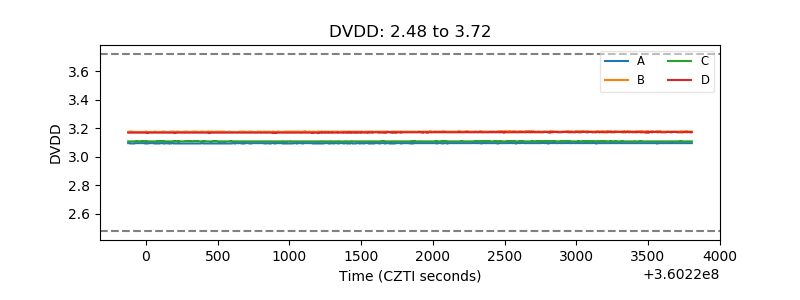 |
| Temperature 1 | 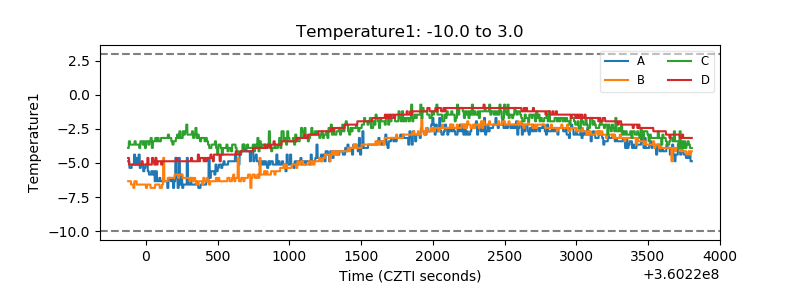 |
| Veto HV Monitor |  |
| Veto LLD | 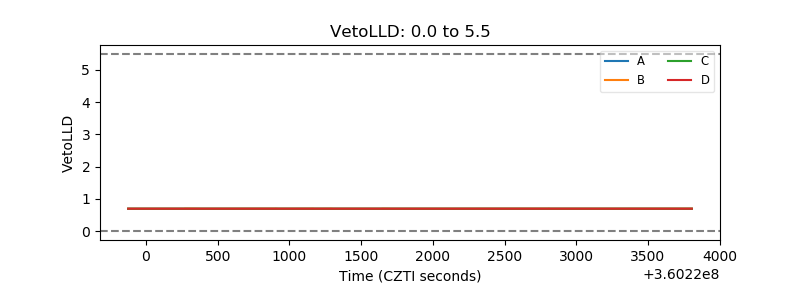 |
| Alpha Counter | 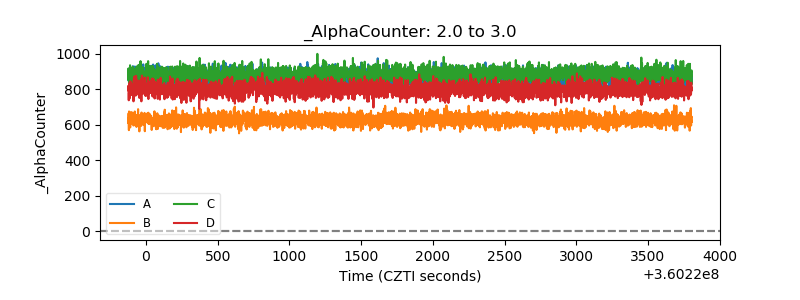 |
| _CPM_Rate | 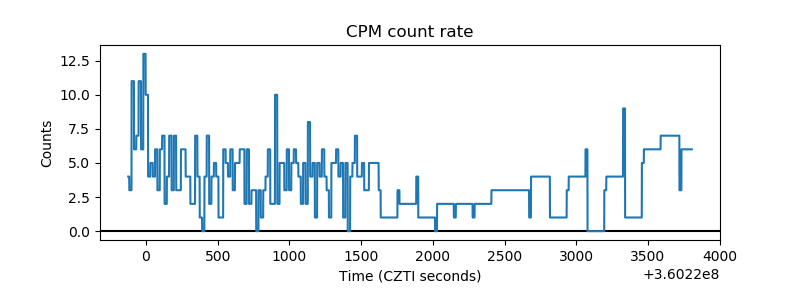 |
| CZT Counter | 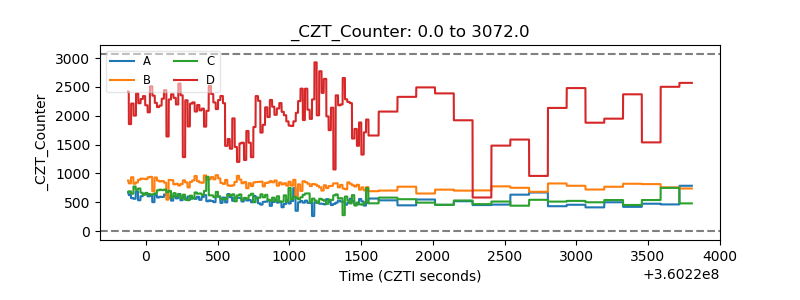 |
| +2.5 Volts monitor |  |
| +5 Volts monitor |  |
| _ROLL_ROT | 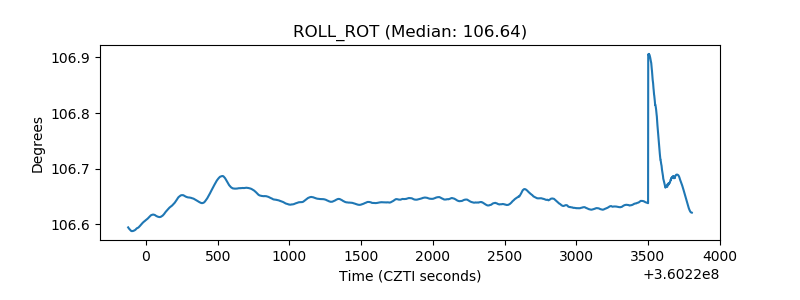 |
| _Roll_DEC | 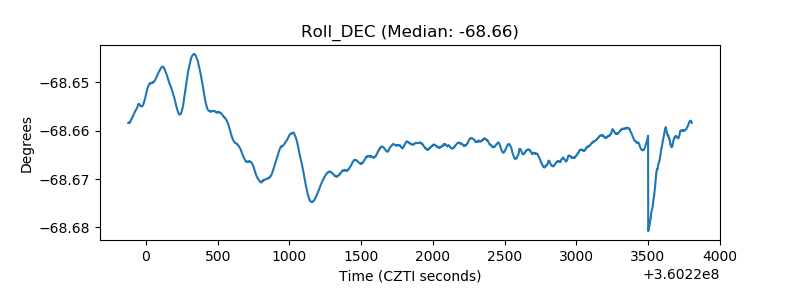 |
| _Roll_RA | 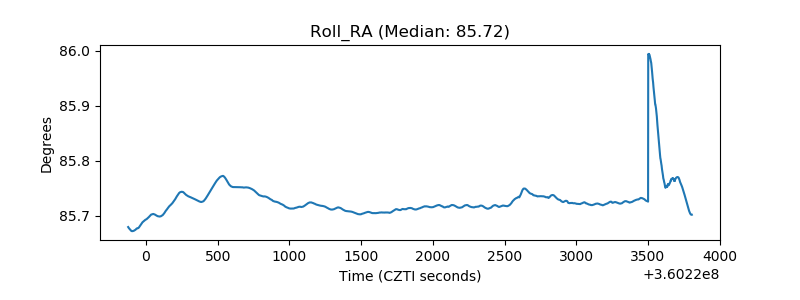 |
| Veto Counter | 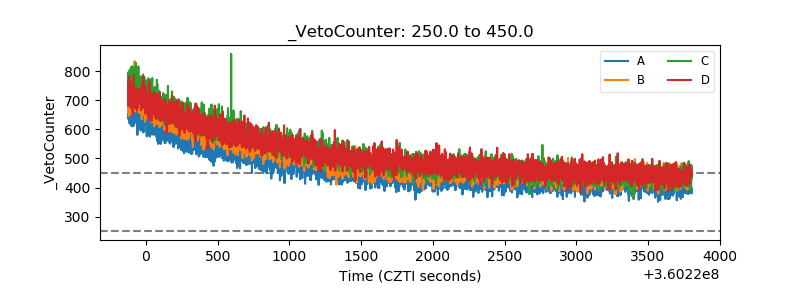 |