| Param | Original file | Final file |
|---|---|---|
| Filename | modeM0/AS1A10_058T14_9000004430cztM0_level2.fits | modeM0/AS1A10_058T14_9000004430cztM0_level2_quad_clean.evt |
| Size (bytes) | 780,102,720 | 612,659,520 |
| Size | 744.0 MB | 584.3 MB |
| Events in quadrant A | 4,976,336 | 3,646,757 |
| Events in quadrant B | 4,645,070 | 3,590,357 |
| Events in quadrant C | 4,782,816 | 3,438,065 |
| Events in quadrant D | 3,912,216 | 2,572,782 |
| Mode M9 | |||
|---|---|---|---|
| Quadrant | BADHDUFLAG | Total packets | Discarded packets |
| A | 0 | 122 | 0 |
| B | 0 | 123 | 0 |
| C | 0 | 122 | 0 |
| D | 0 | 122 | 0 |
| Mode SS | |||
|---|---|---|---|
| Quadrant | BADHDUFLAG | Total packets | Discarded packets |
| A | 0 | 1572 | 0 |
| B | 0 | 1580 | 0 |
| C | 0 | 1576 | 0 |
| D | 0 | 1576 | 0 |
| Mode M0 | |||
|---|---|---|---|
| Quadrant | BADHDUFLAG | Total packets | Discarded packets |
| A | 0 | 177051 | 0 |
| B | 0 | 238985 | 0 |
| C | 0 | 172801 | 0 |
| D | 0 | 368231 | 0 |
| Quadrant | Total seconds | Saturated seconds | Saturation percentage |
|---|---|---|---|
| A | 77454 | 1932 | 2.494384% |
| B | 77354 | 1933 | 2.498901% |
| C | 77455 | 2176 | 2.809373% |
| D | 77092 | 11308 | 14.668189% |
Noise dominated data is calculated using 1-second bins in cleaned event files. If a bin has >2000 counts, and if more than 50% of those come from <1% of pixels, then it is considered to be noise-dominated and hence unusable.
| Quadrant | # 1 sec bins | Bins with >0 counts | Bins with >2000 counts | High rate bins dominated by noise | Noise dominated (total time) | Noise dominated (detector-on time) | Marked lightcurve |
|---|---|---|---|---|---|---|---|
| A | 90451 | 77564 | 0 | 0 | 0.00% | 0.00% |  |
| B | 90452 | 77483 | 0 | 0 | 0.00% | 0.00% |  |
| C | 90452 | 77558 | 0 | 0 | 0.00% | 0.00% | 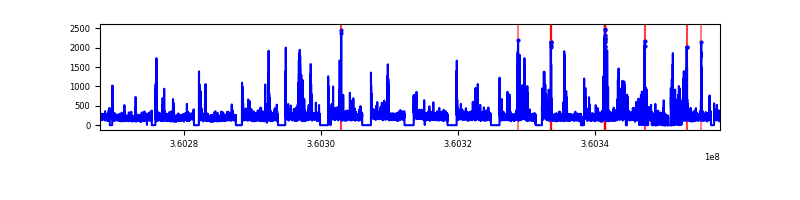 |
| D | 90450 | 77074 | 0 | 0 | 0.00% | 0.00% |  |
Top three noisy pixels from each quadrant. If the there are fewer than three noisy pixels in the level2.evt file, extra rows are filled as -1
| Pixel properties | Quadrant properties | ||||||
|---|---|---|---|---|---|---|---|
| Quadrant | DetID | PixID | Counts | Sigma | Mean | Median | Sigma |
| A | 0 | 29 | 4100 | 9.06 | 1298 | 1220 | 317.8 |
| A | 7 | 110 | 3880 | 8.37 | 1298 | 1220 | 317.8 |
| A | 9 | 19 | 3690 | 7.77 | 1298 | 1220 | 317.8 |
| B | 2 | 9 | 3660 | 10.34 | 1230 | 1176 | 240.1 |
| B | 3 | 80 | 3071 | 7.89 | 1230 | 1176 | 240.1 |
| B | 2 | 8 | 3054 | 7.82 | 1230 | 1176 | 240.1 |
| C | 12 | 241 | 3303 | 6.73 | 1266 | 1191 | 313.9 |
| C | 3 | 126 | 3212 | 6.44 | 1266 | 1191 | 313.9 |
| C | 7 | 111 | 3195 | 6.38 | 1266 | 1191 | 313.9 |
| D | 15 | 46 | 2948 | 6.58 | 1118 | 1024 | 292.3 |
| D | 10 | 189 | 2850 | 6.25 | 1118 | 1024 | 292.3 |
| D | 6 | 231 | 2733 | 5.85 | 1118 | 1024 | 292.3 |
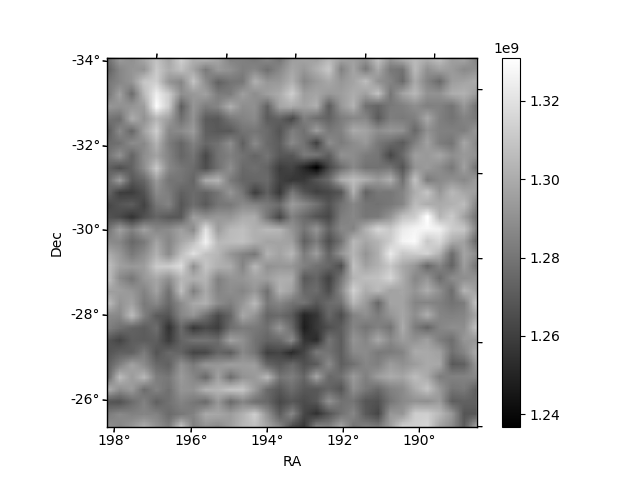
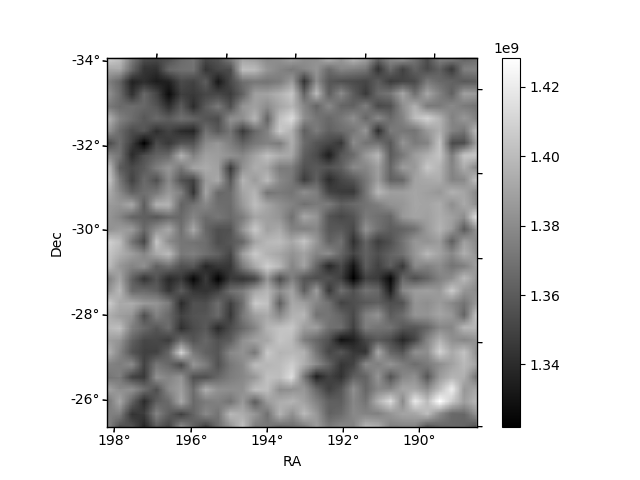
Histogram calculated using DETX and DETY for each event in the final _common_clean file
| Quadrant A |  |
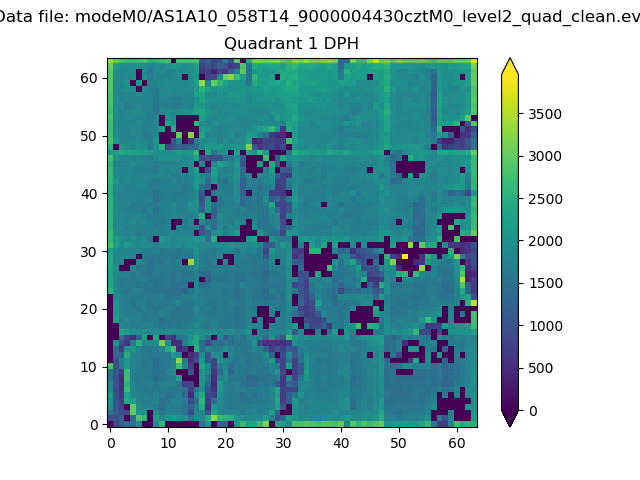 |
Quadrant B |
|---|---|---|---|
| Quadrant D |  |
 |
Quadrant C |
| Plot type | Count rate plots | Images |
|---|---|---|
| Comparison with Poisson distribution Blue bars denote a histogram of data divided into 1 sec bins. Red curve is a Poisson curve with rate = median count rate of data. |
 |
 |
| Quadrant-wise count rates Data is divided into 100 sec bins |
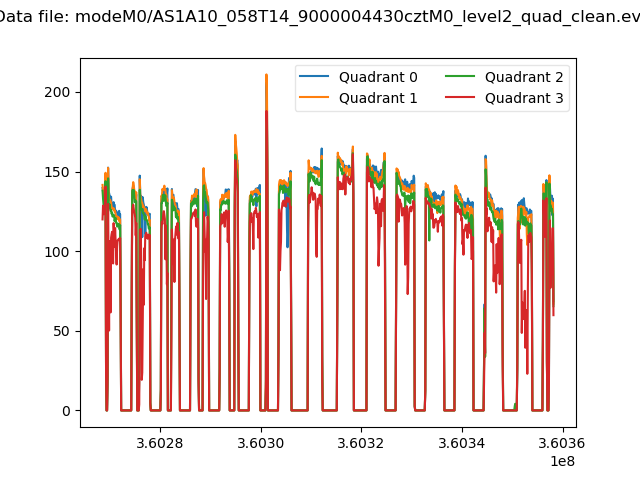 |
|
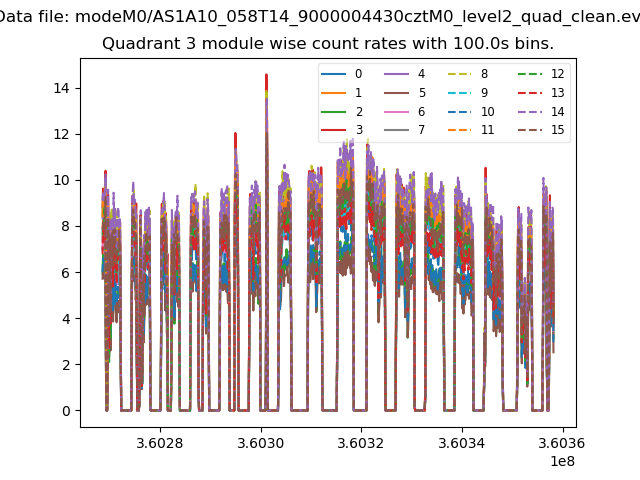
| Module-wise count rates for Quadrant A Data is divided into 100 sec bins |
 |
 |
| Module-wise count rates for Quadrant B Data is divided into 100 sec bins |
 |
 |
| Module-wise count rates for Quadrant C Data is divided into 100 sec bins |
 |
 |
| Module-wise count rates for Quadrant D Data is divided into 100 sec bins |
 |
 |
| Parameter | Plot |
|---|---|
| CZT HV Monitor |  |
| D_VDD | 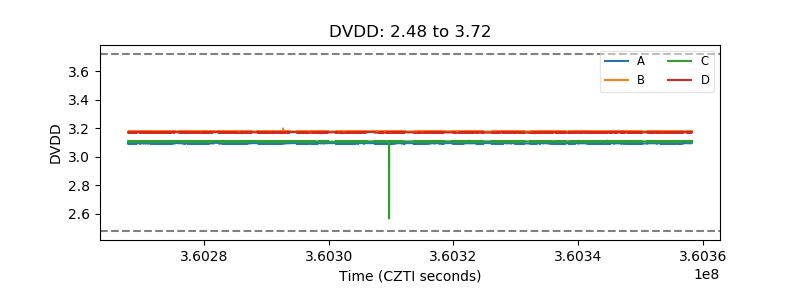 |
| Temperature 1 |  |
| Veto HV Monitor |  |
| Veto LLD |  |
| Alpha Counter | 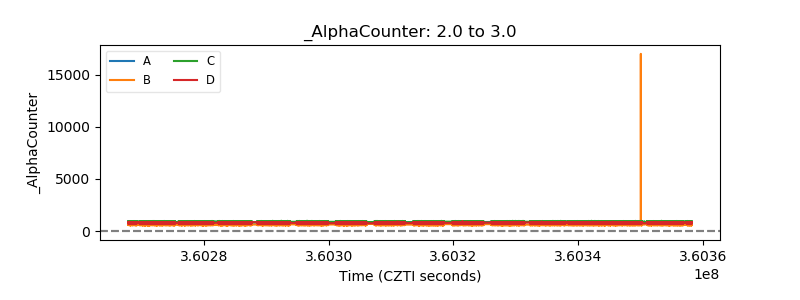 |
| _CPM_Rate |  |
| CZT Counter |  |
| +2.5 Volts monitor |  |
| +5 Volts monitor |  |
| _ROLL_ROT | 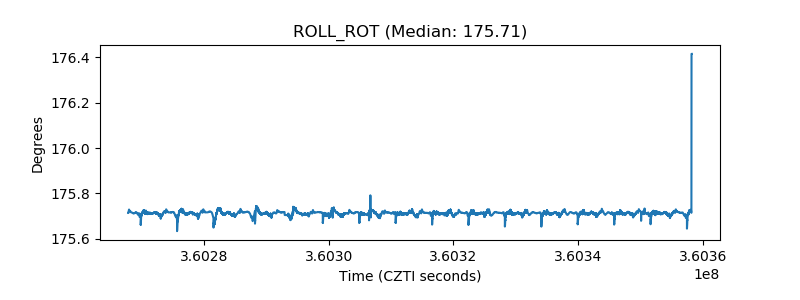 |
| _Roll_DEC |  |
| _Roll_RA |  |
| Veto Counter |  |