| Param | Original file | Final file |
|---|---|---|
| Filename | modeM0/AS1A10_058T14_9000004430_30700cztM0_level2.evt | modeM0/AS1A10_058T14_9000004430_30700cztM0_level2_quad_clean.evt |
| Size (bytes) | 724,256,640 | 61,945,920 |
| Size | 690.7 MB | 59.1 MB |
| Events in quadrant A | 4,344,625 | 360,653 |
| Events in quadrant B | 5,292,892 | 377,137 |
| Events in quadrant C | 3,784,386 | 362,118 |
| Events in quadrant D | 8,083,524 | 330,615 |
| Mode M9 | |||
|---|---|---|---|
| Quadrant | BADHDUFLAG | Total packets | Discarded packets |
| A | 0 | 13 | 0 |
| B | 0 | 13 | 0 |
| C | 0 | 13 | 0 |
| D | 0 | 13 | 0 |
| Mode SS | |||
|---|---|---|---|
| Quadrant | BADHDUFLAG | Total packets | Discarded packets |
| A | 0 | 128 | 0 |
| B | 0 | 128 | 0 |
| C | 0 | 128 | 0 |
| D | 0 | 128 | 0 |
| Mode M0 | |||
|---|---|---|---|
| Quadrant | BADHDUFLAG | Total packets | Discarded packets |
| A | 0 | 16958 | 1 |
| B | 0 | 19664 | 1 |
| C | 0 | 15296 | 1 |
| D | 0 | 28512 | 1 |
| Quadrant | Total seconds | Saturated seconds | Saturation percentage |
|---|---|---|---|
| A | 6377 | 271 | 4.249647% |
| B | 6377 | 86 | 1.348597% |
| C | 6378 | 255 | 3.998119% |
| D | 6377 | 462 | 7.244786% |
Noise dominated data is calculated using 1-second bins in cleaned event files. If a bin has >2000 counts, and if more than 50% of those come from <1% of pixels, then it is considered to be noise-dominated and hence unusable.
| Quadrant | # 1 sec bins | Bins with >0 counts | Bins with >2000 counts | High rate bins dominated by noise | Noise dominated (total time) | Noise dominated (detector-on time) | Marked lightcurve |
|---|---|---|---|---|---|---|---|
| A | 7656 | 6376 | 218 | 218 | 2.85% | 3.42% | 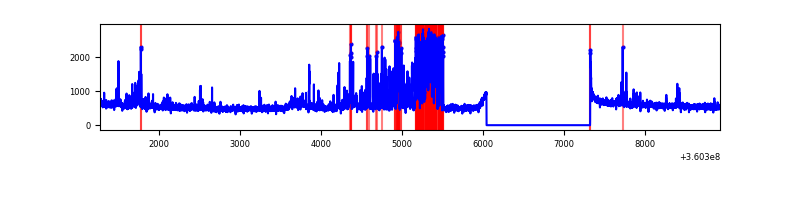 |
| B | 7657 | 6377 | 4 | 4 | 0.05% | 0.06% | 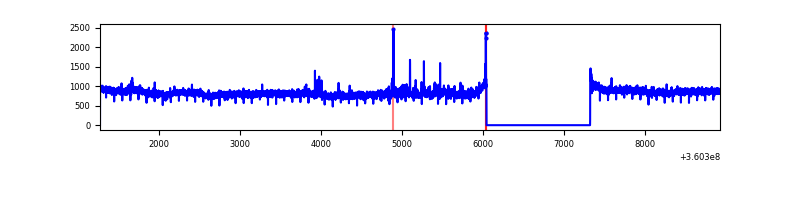 |
| C | 7657 | 6377 | 7 | 7 | 0.09% | 0.11% | 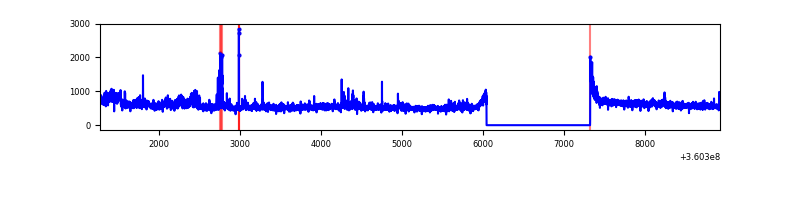 |
| D | 7657 | 6377 | 362 | 362 | 4.73% | 5.68% | 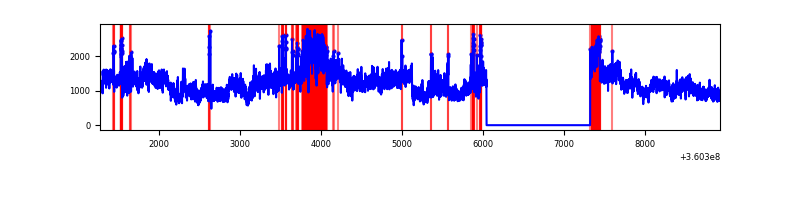 |
Top three noisy pixels from each quadrant. If the there are fewer than three noisy pixels in the level2.evt file, extra rows are filled as -1
| Pixel properties | Quadrant properties | ||||||
|---|---|---|---|---|---|---|---|
| Quadrant | DetID | PixID | Counts | Sigma | Mean | Median | Sigma |
| A | 0 | 13 | 987436 | 5791.99 | 868 | 854 | 170.3 |
| A | 8 | 192 | 12335 | 67.4 | 868 | 854 | 170.3 |
| A | 13 | 254 | 11765 | 64.06 | 868 | 854 | 170.3 |
| B | 6 | 159 | 1762023 | 10940.4 | 870 | 850 | 161.0 |
| B | 0 | 190 | 75777 | 465.45 | 870 | 850 | 161.0 |
| B | 5 | 172 | 21099 | 125.79 | 870 | 850 | 161.0 |
| C | 14 | 238 | 207137 | 1075.96 | 835 | 843 | 191.7 |
| C | 3 | 233 | 173375 | 899.87 | 835 | 843 | 191.7 |
| C | 14 | 254 | 90017 | 465.1 | 835 | 843 | 191.7 |
| D | 8 | 195 | 4405576 | 22470.67 | 825 | 808 | 196.0 |
| D | 12 | 233 | 315612 | 1605.95 | 825 | 808 | 196.0 |
| D | 12 | 218 | 73602 | 371.35 | 825 | 808 | 196.0 |
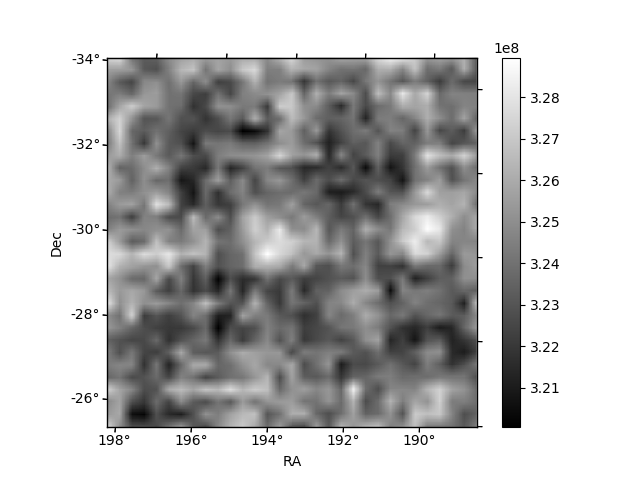
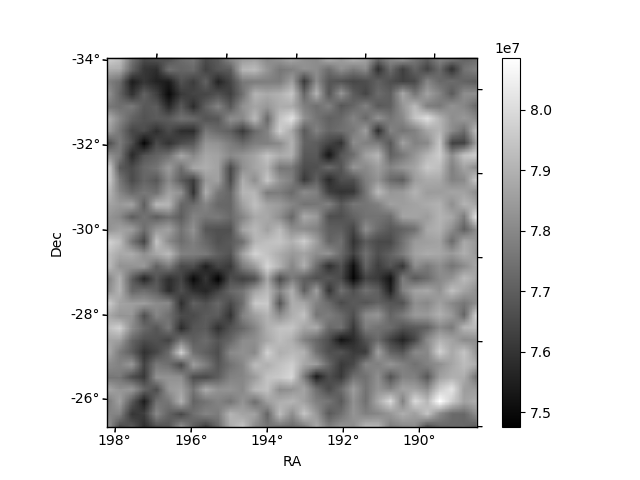
Histogram calculated using DETX and DETY for each event in the final _common_clean file
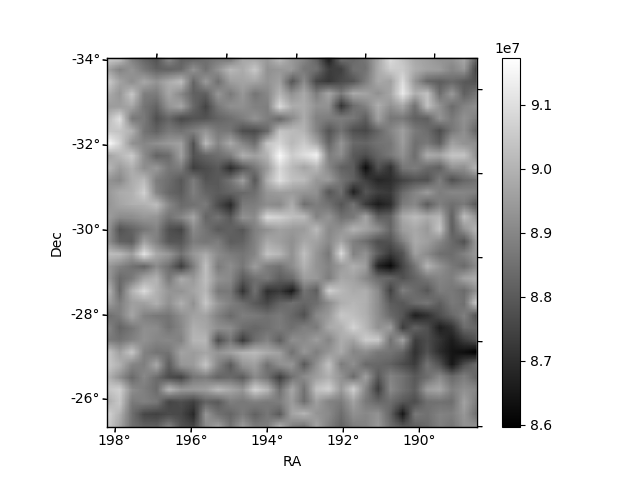
| Quadrant A | 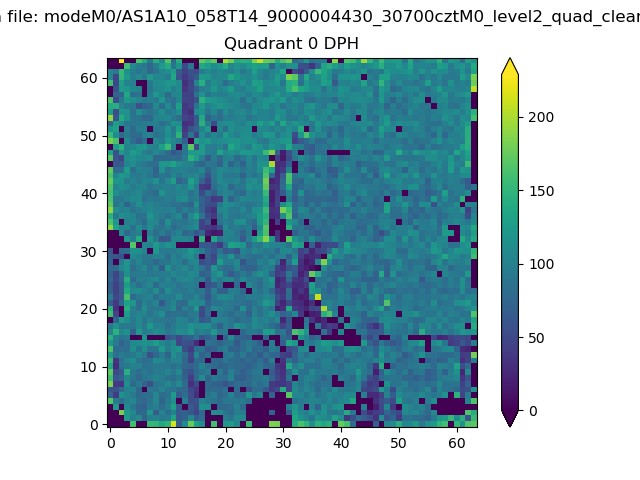 |
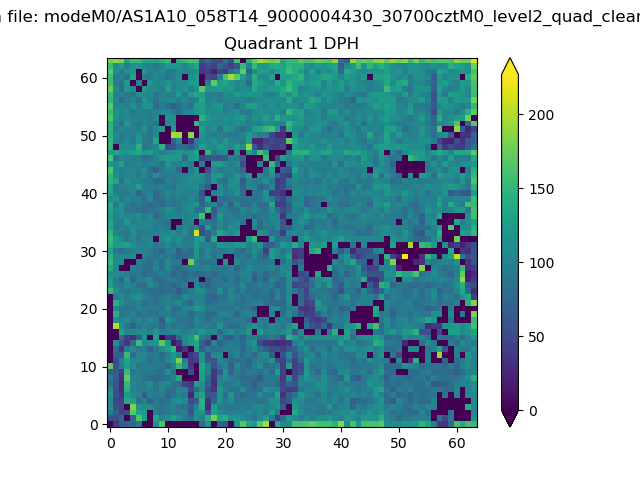 |
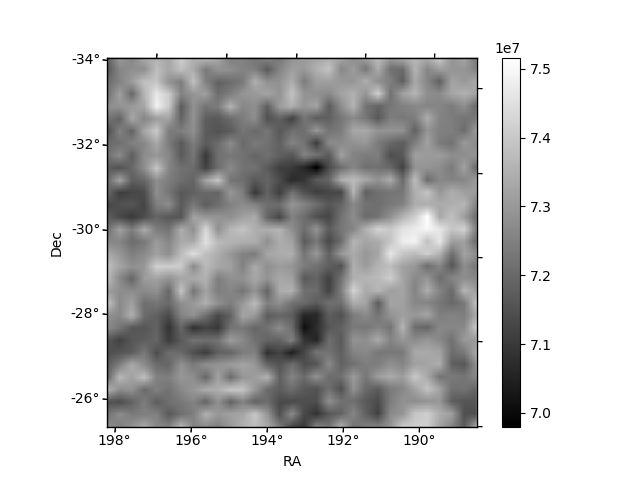
Quadrant B |
|---|---|---|---|
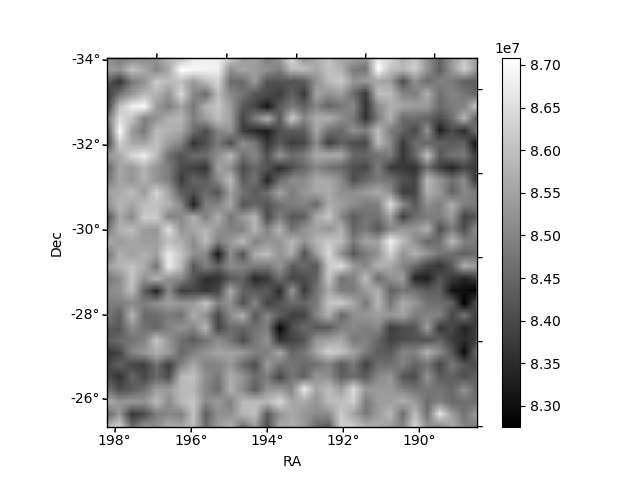
| Quadrant D | 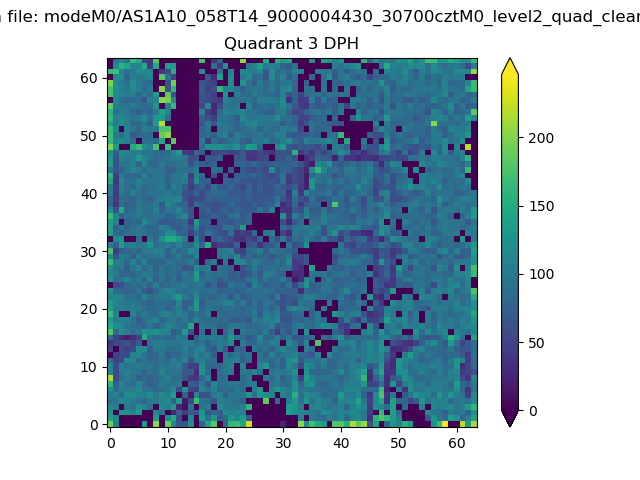 |
 |
Quadrant C |
| Plot type | Count rate plots | Images |
|---|---|---|
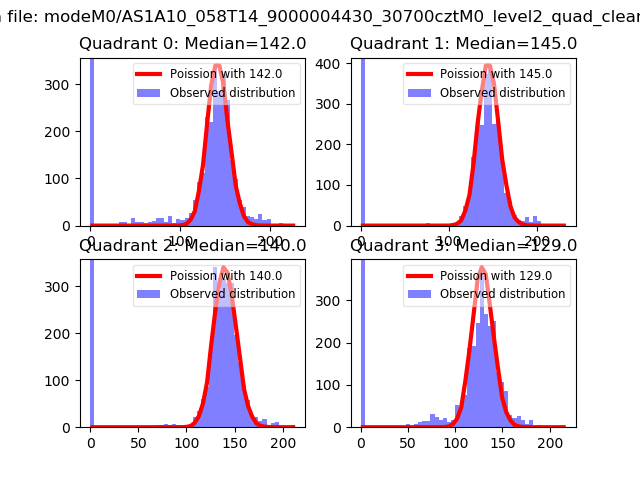
| Comparison with Poisson distribution Blue bars denote a histogram of data divided into 1 sec bins. Red curve is a Poisson curve with rate = median count rate of data. |
 |
 |
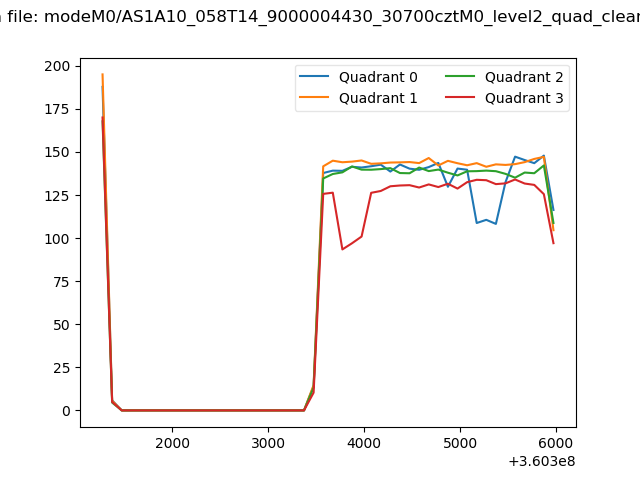
| Quadrant-wise count rates Data is divided into 100 sec bins |
 |
|
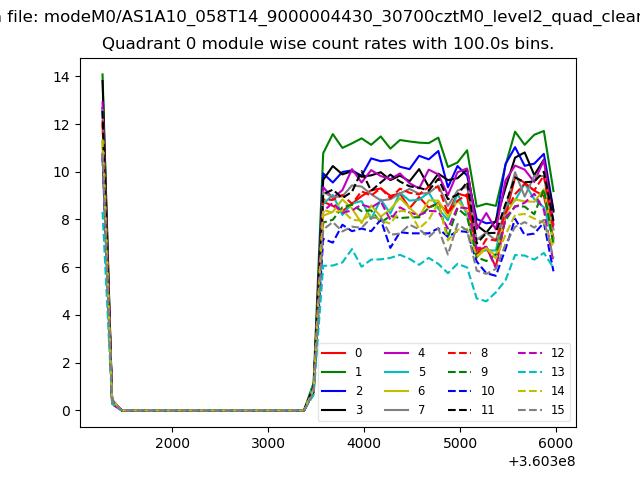
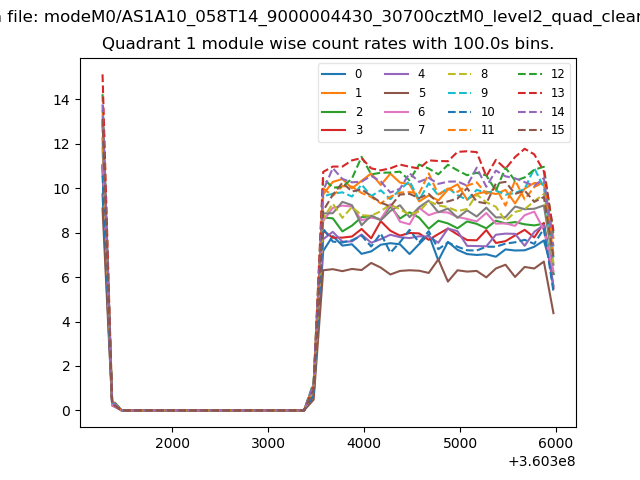
| Module-wise count rates for Quadrant A Data is divided into 100 sec bins |
 |
 |
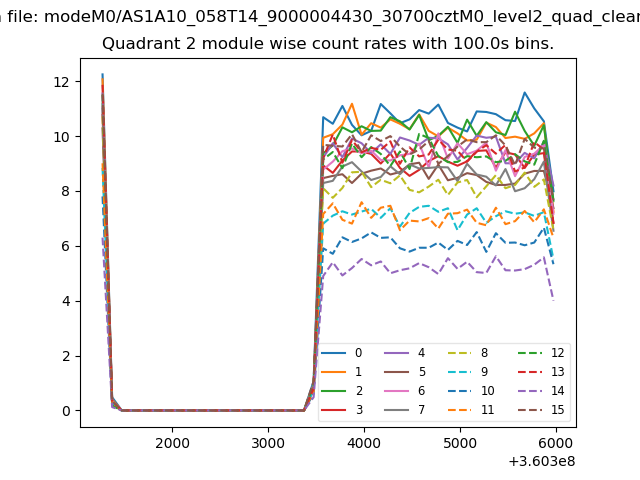
| Module-wise count rates for Quadrant B Data is divided into 100 sec bins |
 |
 |
| Module-wise count rates for Quadrant C Data is divided into 100 sec bins |
 |
 |
| Module-wise count rates for Quadrant D Data is divided into 100 sec bins |
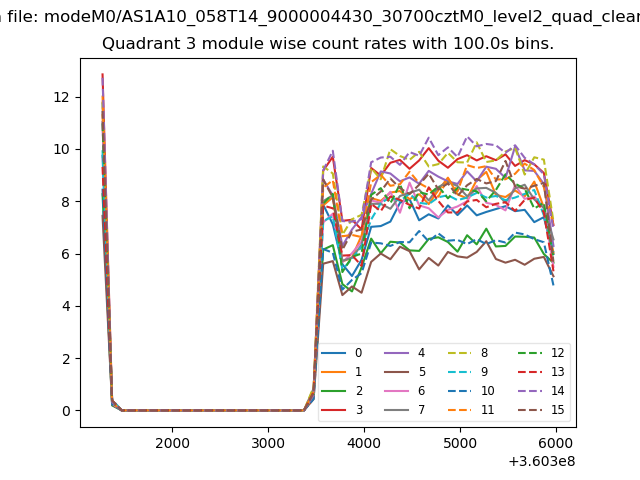 |
 |
| Parameter | Plot |
|---|---|
| CZT HV Monitor | 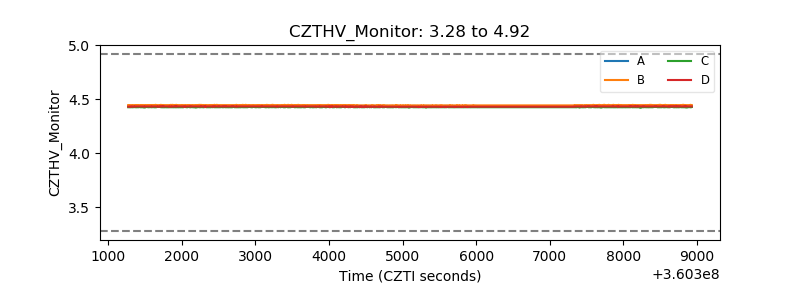 |
| D_VDD | 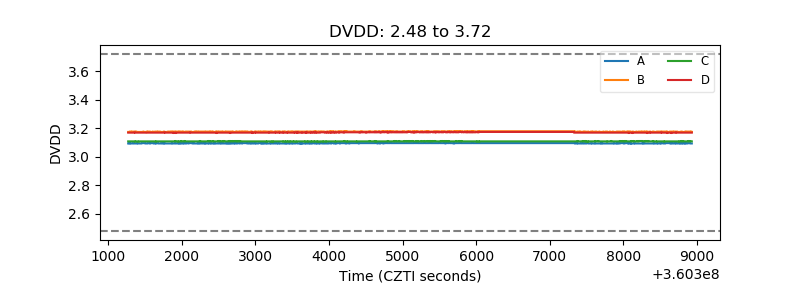 |
| Temperature 1 | 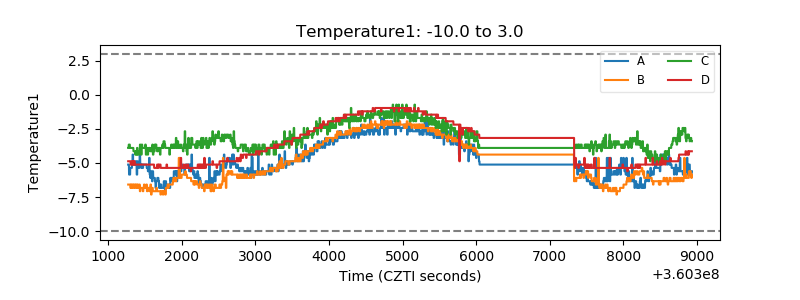 |
| Veto HV Monitor | 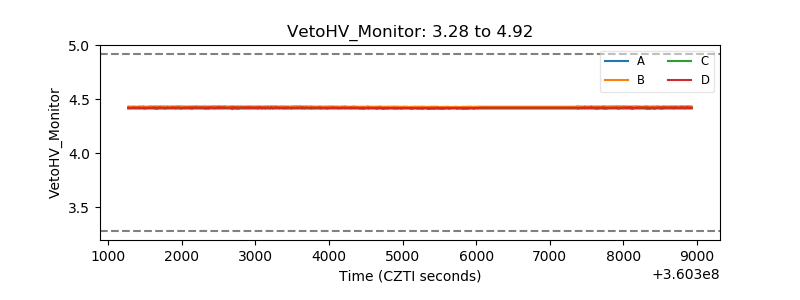 |
| Veto LLD | 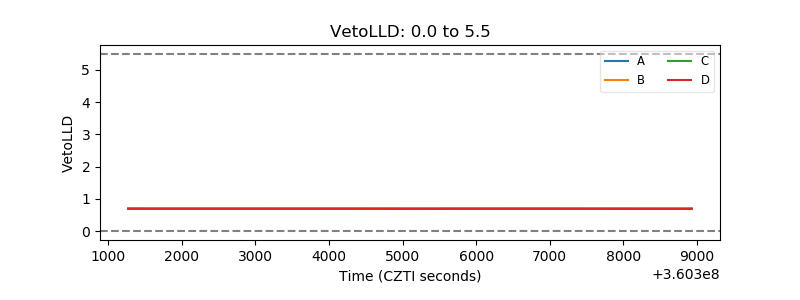 |
| Alpha Counter | 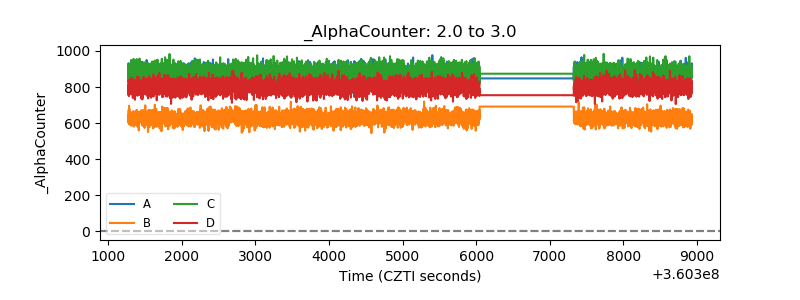 |
| _CPM_Rate | 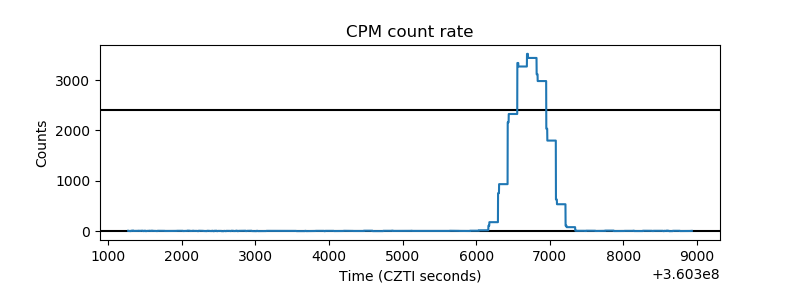 |
| CZT Counter |  |
| +2.5 Volts monitor |  |
| +5 Volts monitor |  |
| _ROLL_ROT | 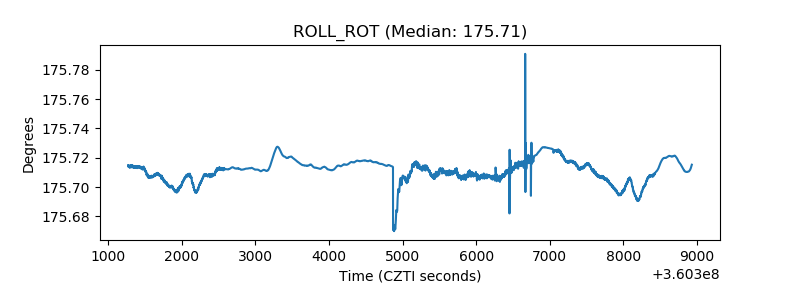 |
| _Roll_DEC | 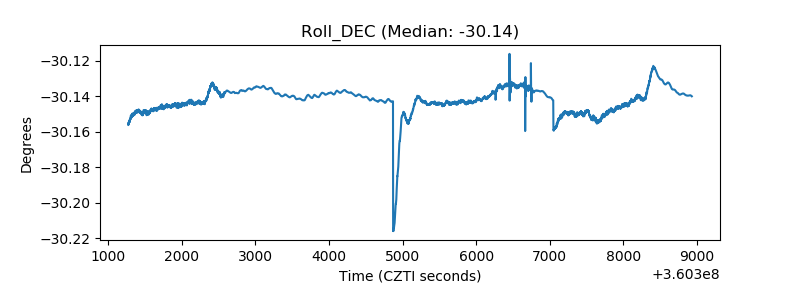 |
| _Roll_RA |  |
| Veto Counter | 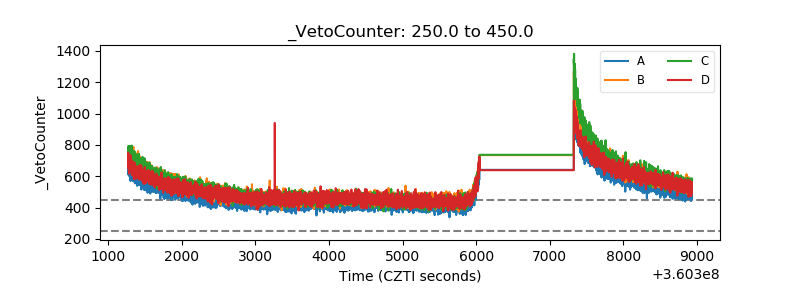 |