| Param | Original file | Final file |
|---|---|---|
| Filename | modeM0/AS1A10_058T14_9000004430_30702cztM0_level2.evt | modeM0/AS1A10_058T14_9000004430_30702cztM0_level2_quad_clean.evt |
| Size (bytes) | 4,859,951,040 | 556,545,600 |
| Size | 4.5 GB | 530.8 MB |
| Events in quadrant A | 25,919,442 | 3,589,412 |
| Events in quadrant B | 35,769,917 | 3,617,910 |
| Events in quadrant C | 23,888,887 | 3,481,893 |
| Events in quadrant D | 58,622,884 | 3,104,953 |
| Mode M9 | |||
|---|---|---|---|
| Quadrant | BADHDUFLAG | Total packets | Discarded packets |
| A | 0 | 88 | 0 |
| B | 0 | 88 | 0 |
| C | 0 | 88 | 0 |
| D | 0 | 88 | 0 |
| Mode SS | |||
|---|---|---|---|
| Quadrant | BADHDUFLAG | Total packets | Discarded packets |
| A | 0 | 910 | 0 |
| B | 0 | 910 | 0 |
| C | 0 | 910 | 0 |
| D | 0 | 910 | 0 |
| Mode M0 | |||
|---|---|---|---|
| Quadrant | BADHDUFLAG | Total packets | Discarded packets |
| A | 0 | 104911 | 9 |
| B | 0 | 136588 | 9 |
| C | 0 | 98603 | 9 |
| D | 0 | 205420 | 9 |
| Quadrant | Total seconds | Saturated seconds | Saturation percentage |
|---|---|---|---|
| A | 44591 | 1056 | 2.368191% |
| B | 44591 | 717 | 1.607948% |
| C | 44591 | 1048 | 2.350250% |
| D | 44591 | 5161 | 11.574084% |
Noise dominated data is calculated using 1-second bins in cleaned event files. If a bin has >2000 counts, and if more than 50% of those come from <1% of pixels, then it is considered to be noise-dominated and hence unusable.
| Quadrant | # 1 sec bins | Bins with >0 counts | Bins with >2000 counts | High rate bins dominated by noise | Noise dominated (total time) | Noise dominated (detector-on time) | Marked lightcurve |
|---|---|---|---|---|---|---|---|
| A | 53352 | 44596 | 654 | 654 | 1.23% | 1.47% | 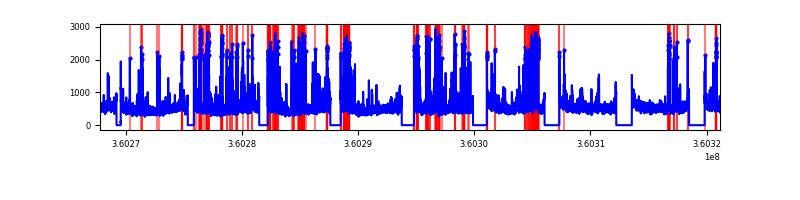 |
| B | 53352 | 44597 | 16 | 16 | 0.03% | 0.04% | 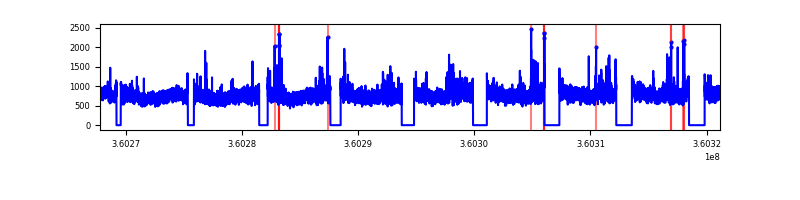 |
| C | 53351 | 44595 | 50 | 50 | 0.09% | 0.11% | 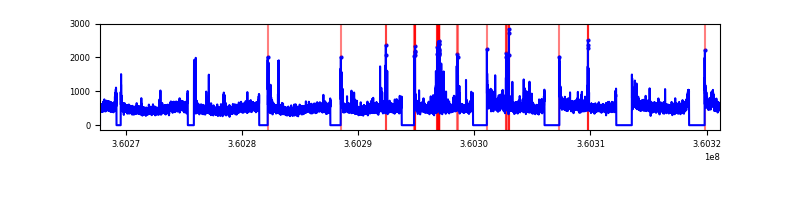 |
| D | 53352 | 44597 | 4713 | 4713 | 8.83% | 10.57% | 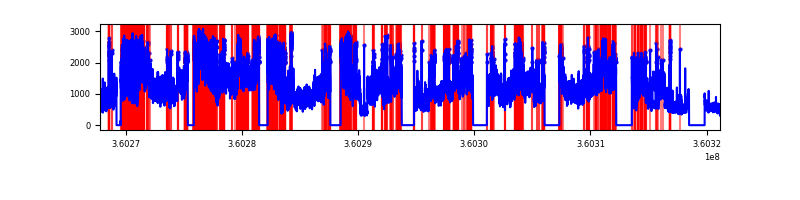 |
Top three noisy pixels from each quadrant. If the there are fewer than three noisy pixels in the level2.evt file, extra rows are filled as -1
| Pixel properties | Quadrant properties | ||||||
|---|---|---|---|---|---|---|---|
| Quadrant | DetID | PixID | Counts | Sigma | Mean | Median | Sigma |
| A | 0 | 13 | 3558367 | 3127.19 | 5766 | 5662 | 1136.1 |
| A | 8 | 192 | 103868 | 86.44 | 5766 | 5662 | 1136.1 |
| A | 13 | 254 | 86189 | 70.88 | 5766 | 5662 | 1136.1 |
| B | 6 | 159 | 12531764 | 11769.71 | 5719 | 5593 | 1064.3 |
| B | 0 | 190 | 443508 | 411.47 | 5719 | 5593 | 1064.3 |
| B | 12 | 111 | 132209 | 118.97 | 5719 | 5593 | 1064.3 |
| C | 14 | 238 | 1000442 | 782.44 | 5517 | 5565 | 1271.5 |
| C | 3 | 233 | 845456 | 660.55 | 5517 | 5565 | 1271.5 |
| C | 0 | 10 | 196496 | 150.16 | 5517 | 5565 | 1271.5 |
| D | 8 | 195 | 32483074 | 25795.71 | 5367 | 5242 | 1259.0 |
| D | 12 | 218 | 3438836 | 2727.15 | 5367 | 5242 | 1259.0 |
| D | 12 | 233 | 564857 | 444.48 | 5367 | 5242 | 1259.0 |
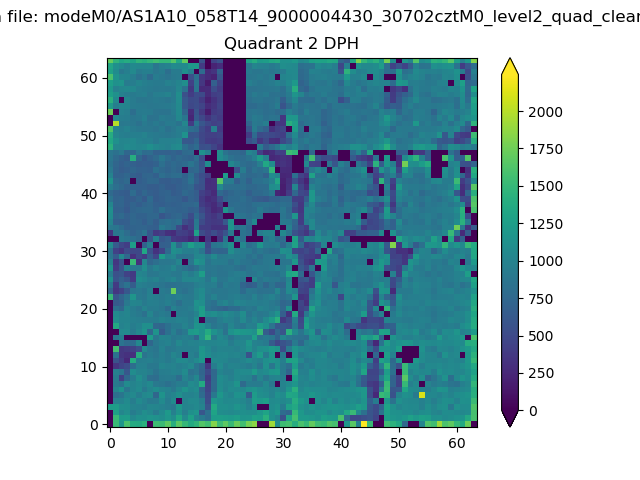
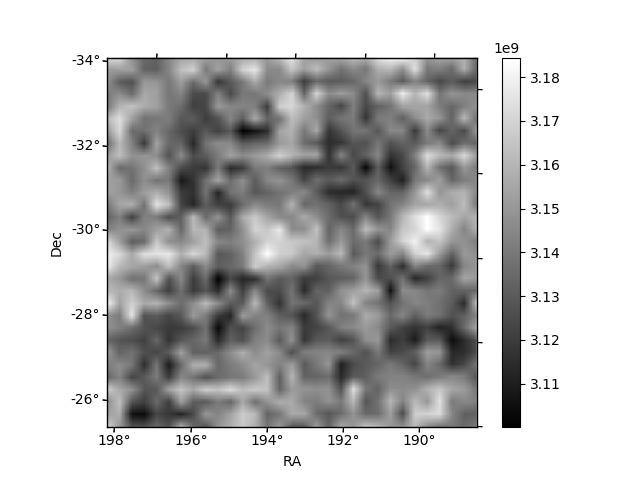
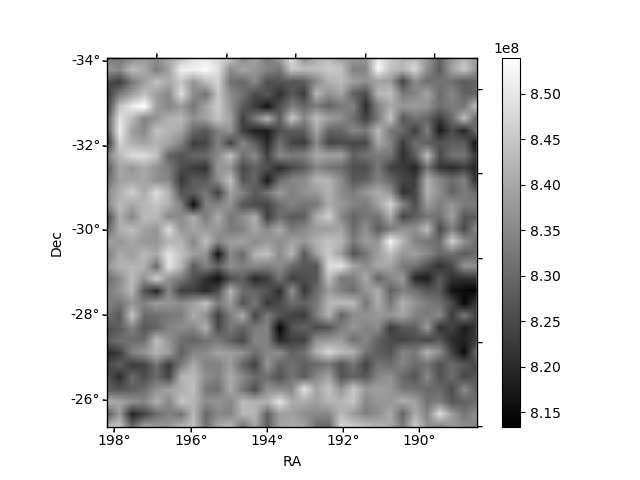
Histogram calculated using DETX and DETY for each event in the final _common_clean file
| Quadrant A | 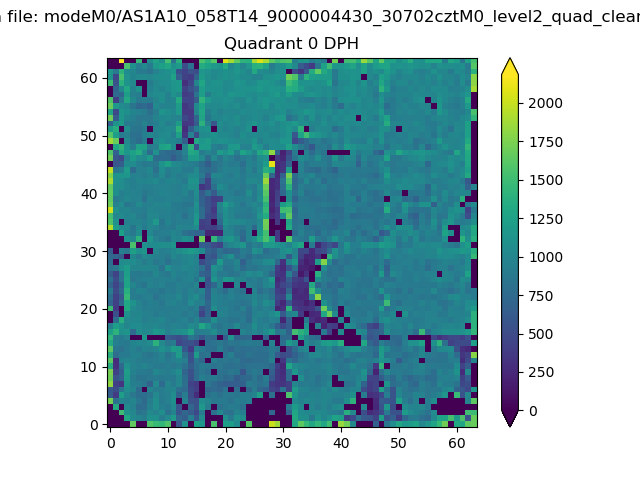 |
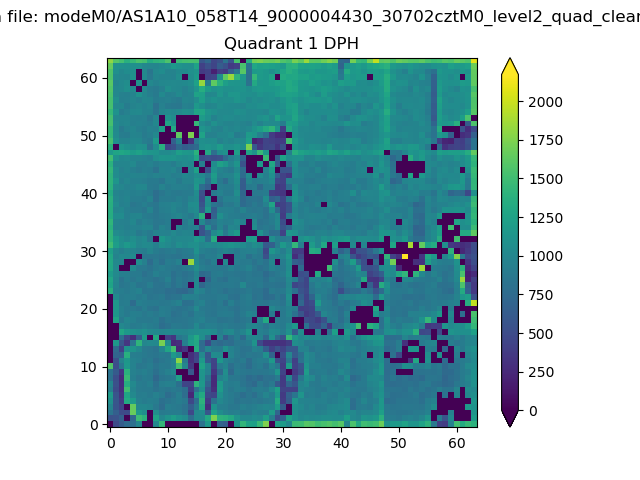 |
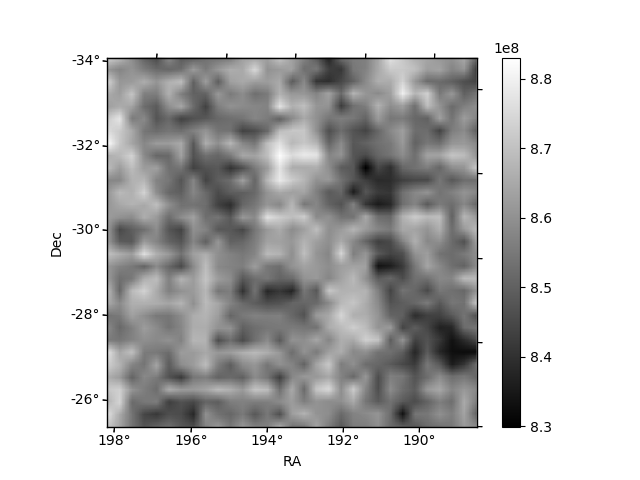
Quadrant B |
|---|---|---|---|
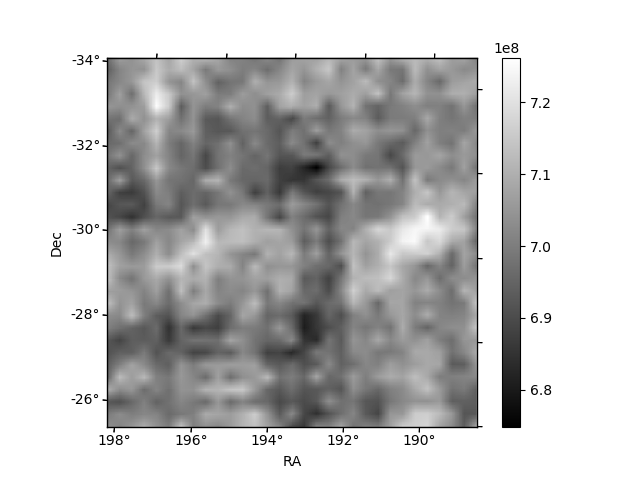
| Quadrant D | 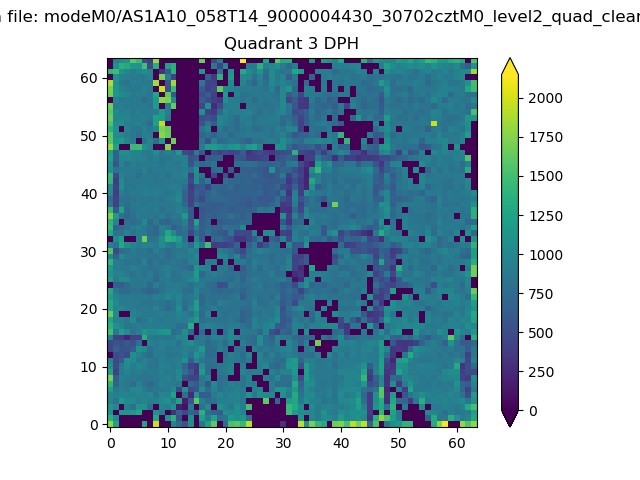 |
 |
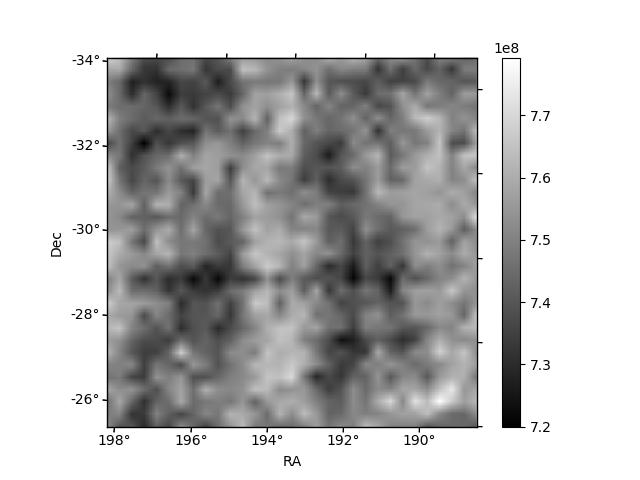
Quadrant C |
| Plot type | Count rate plots | Images |
|---|---|---|
| Comparison with Poisson distribution Blue bars denote a histogram of data divided into 1 sec bins. Red curve is a Poisson curve with rate = median count rate of data. |
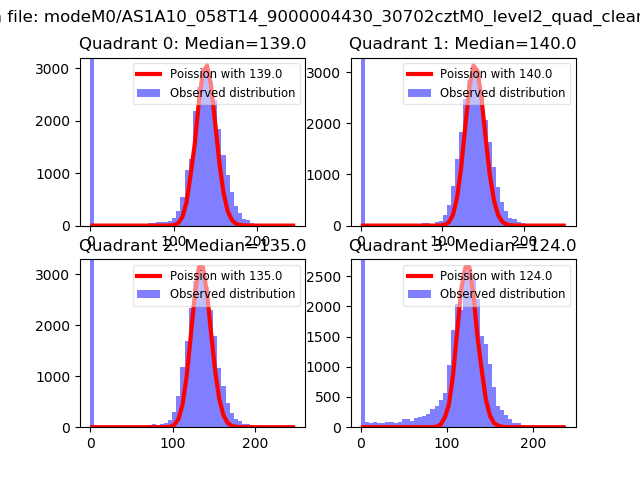 |
 |
| Quadrant-wise count rates Data is divided into 100 sec bins |
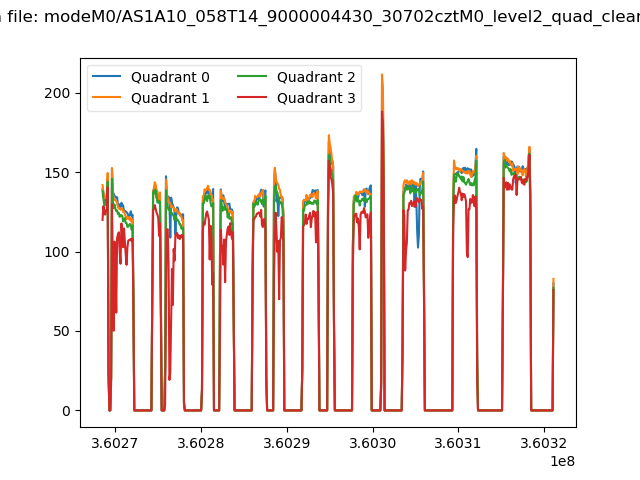 |
|
| Module-wise count rates for Quadrant A Data is divided into 100 sec bins |
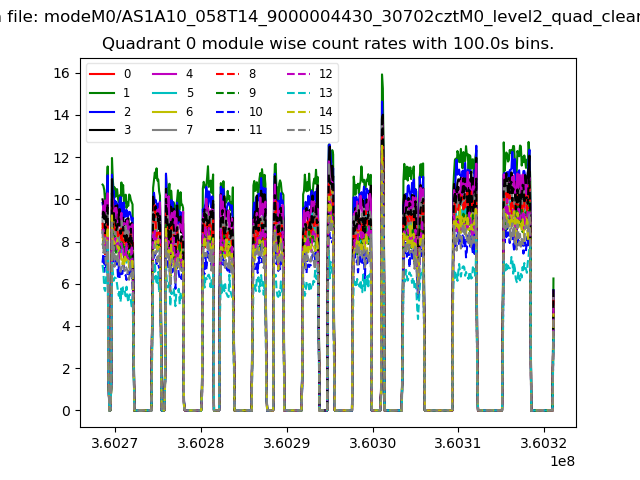 |
 |
| Module-wise count rates for Quadrant B Data is divided into 100 sec bins |
 |
 |
| Module-wise count rates for Quadrant C Data is divided into 100 sec bins |
 |
 |
| Module-wise count rates for Quadrant D Data is divided into 100 sec bins |
 |
 |
| Parameter | Plot |
|---|---|
| CZT HV Monitor | 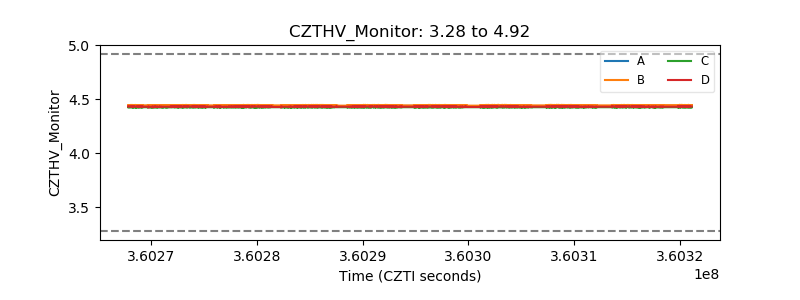 |
| D_VDD | 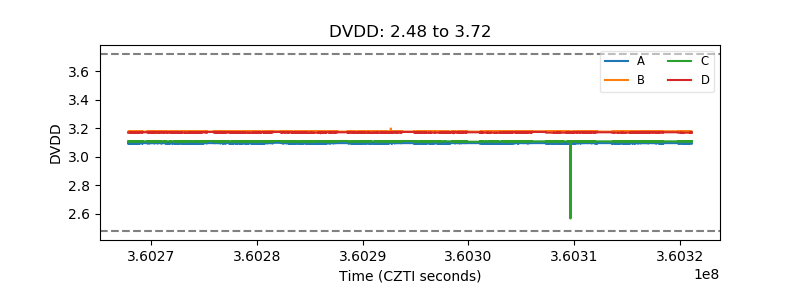 |
| Temperature 1 |  |
| Veto HV Monitor | 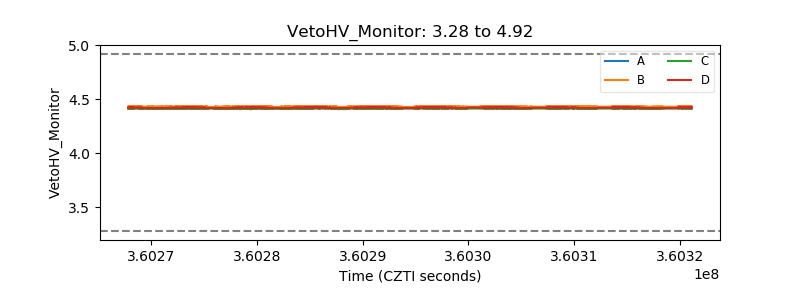 |
| Veto LLD | 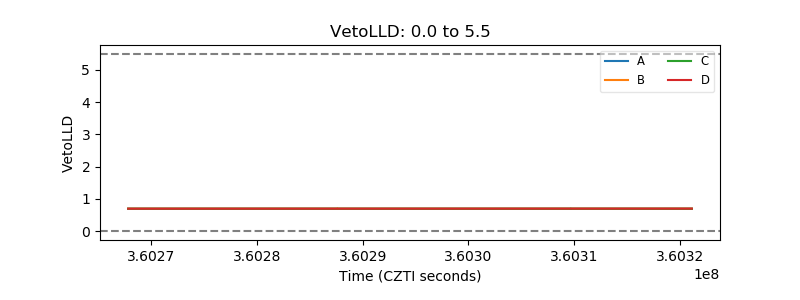 |
| Alpha Counter | 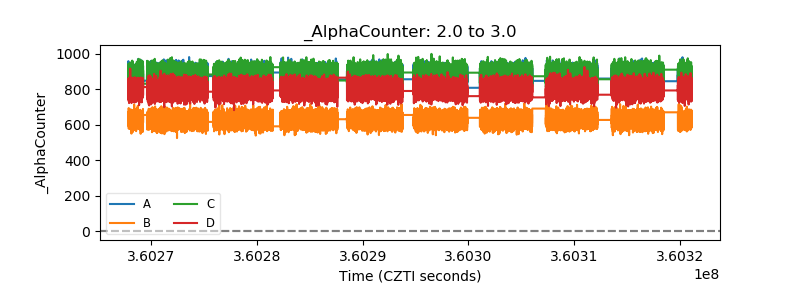 |
| _CPM_Rate | 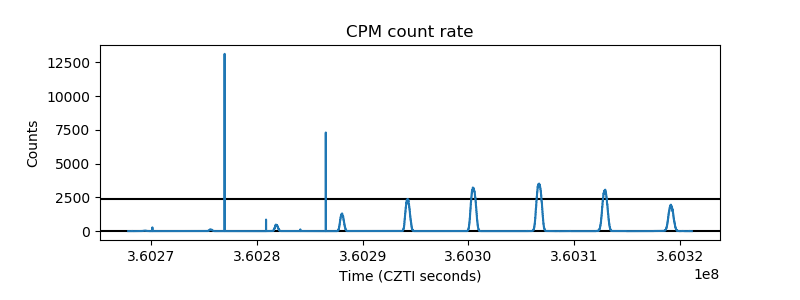 |
| CZT Counter | 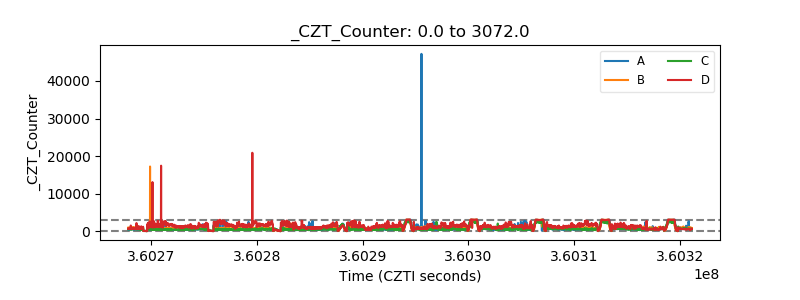 |
| +2.5 Volts monitor |  |
| +5 Volts monitor |  |
| _ROLL_ROT | 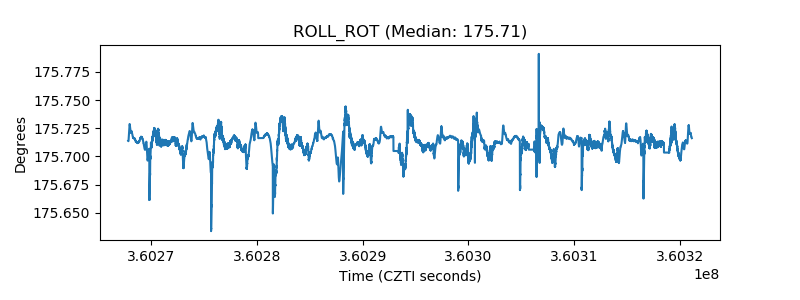 |
| _Roll_DEC | 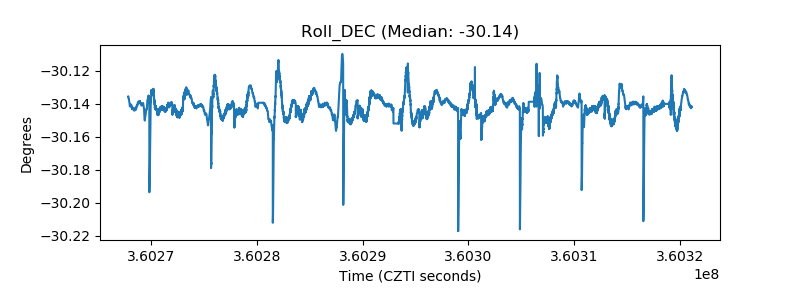 |
| _Roll_RA | 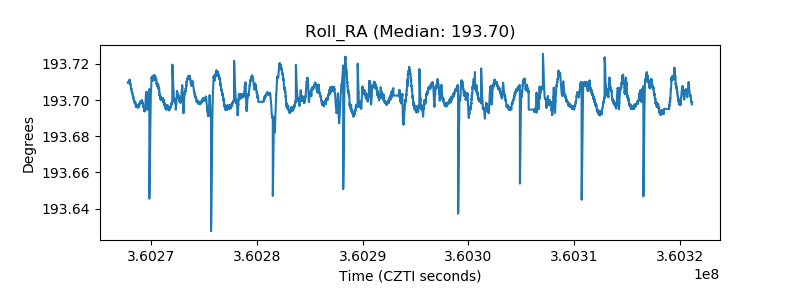 |
| Veto Counter | 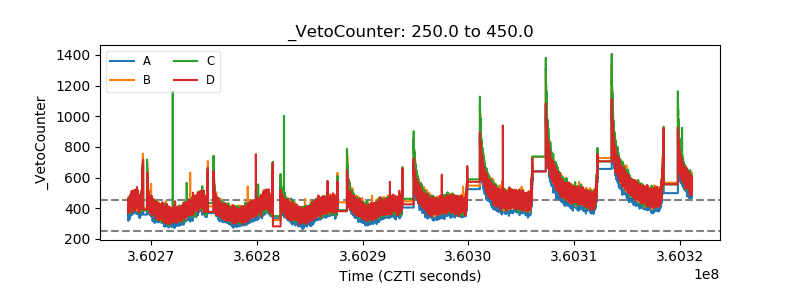 |