| Param | Original file | Final file |
|---|---|---|
| Filename | modeM0/AS1A10_058T14_9000004430_30703cztM0_level2.evt | modeM0/AS1A10_058T14_9000004430_30703cztM0_level2_quad_clean.evt |
| Size (bytes) | 677,347,200 | 94,086,720 |
| Size | 646.0 MB | 89.7 MB |
| Events in quadrant A | 3,669,102 | 626,803 |
| Events in quadrant B | 5,385,046 | 623,079 |
| Events in quadrant C | 3,658,619 | 606,325 |
| Events in quadrant D | 7,373,876 | 551,147 |
| Mode M9 | |||
|---|---|---|---|
| Quadrant | BADHDUFLAG | Total packets | Discarded packets |
| A | 0 | 22 | 0 |
| B | 0 | 23 | 0 |
| C | 0 | 23 | 0 |
| D | 0 | 23 | 0 |
| Mode SS | |||
|---|---|---|---|
| Quadrant | BADHDUFLAG | Total packets | Discarded packets |
| A | 0 | 128 | 0 |
| B | 0 | 128 | 0 |
| C | 0 | 128 | 0 |
| D | 0 | 128 | 0 |
| Mode M0 | |||
|---|---|---|---|
| Quadrant | BADHDUFLAG | Total packets | Discarded packets |
| A | 0 | 14726 | 2 |
| B | 0 | 19877 | 2 |
| C | 0 | 14783 | 2 |
| D | 0 | 26140 | 2 |
| Quadrant | Total seconds | Saturated seconds | Saturation percentage |
|---|---|---|---|
| A | 6331 | 163 | 2.574633% |
| B | 6331 | 190 | 3.001106% |
| C | 6331 | 257 | 4.059390% |
| D | 6331 | 786 | 12.415100% |
Noise dominated data is calculated using 1-second bins in cleaned event files. If a bin has >2000 counts, and if more than 50% of those come from <1% of pixels, then it is considered to be noise-dominated and hence unusable.
| Quadrant | # 1 sec bins | Bins with >0 counts | Bins with >2000 counts | High rate bins dominated by noise | Noise dominated (total time) | Noise dominated (detector-on time) | Marked lightcurve |
|---|---|---|---|---|---|---|---|
| A | 7591 | 6331 | 25 | 25 | 0.33% | 0.39% | 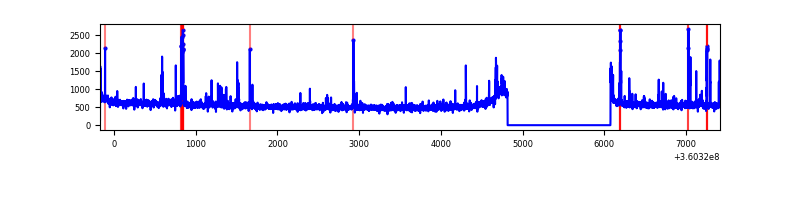 |
| B | 7591 | 6331 | 19 | 19 | 0.25% | 0.30% | 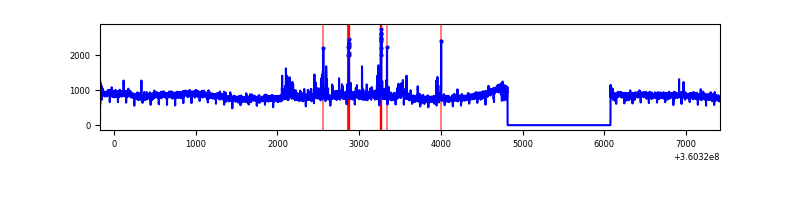 |
| C | 7590 | 6330 | 1 | 1 | 0.01% | 0.02% | 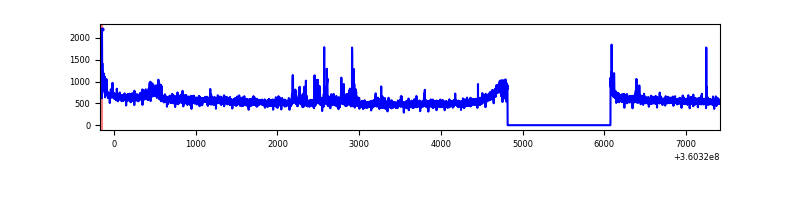 |
| D | 7591 | 6331 | 708 | 708 | 9.33% | 11.18% | 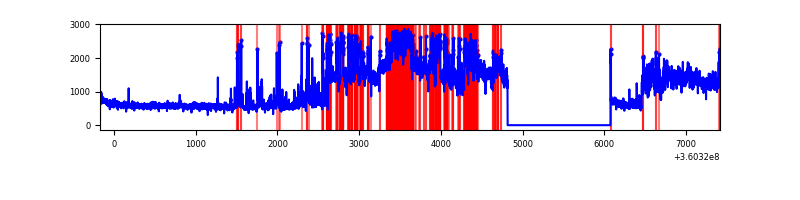 |
Top three noisy pixels from each quadrant. If the there are fewer than three noisy pixels in the level2.evt file, extra rows are filled as -1
| Pixel properties | Quadrant properties | ||||||
|---|---|---|---|---|---|---|---|
| Quadrant | DetID | PixID | Counts | Sigma | Mean | Median | Sigma |
| A | 0 | 13 | 221485 | 1247.97 | 891 | 878 | 176.8 |
| A | 8 | 192 | 12753 | 67.18 | 891 | 878 | 176.8 |
| A | 13 | 254 | 12127 | 63.64 | 891 | 878 | 176.8 |
| B | 6 | 159 | 1758827 | 10765.76 | 873 | 855 | 163.3 |
| B | 0 | 190 | 82032 | 497.13 | 873 | 855 | 163.3 |
| B | 0 | 230 | 60051 | 362.51 | 873 | 855 | 163.3 |
| C | 14 | 238 | 159411 | 813.39 | 848 | 858 | 194.9 |
| C | 3 | 233 | 95184 | 483.9 | 848 | 858 | 194.9 |
| C | 0 | 10 | 41415 | 208.06 | 848 | 858 | 194.9 |
| D | 8 | 195 | 3657521 | 16606.79 | 834 | 820 | 220.2 |
| D | 13 | 249 | 182728 | 826.13 | 834 | 820 | 220.2 |
| D | 12 | 33 | 182210 | 823.78 | 834 | 820 | 220.2 |
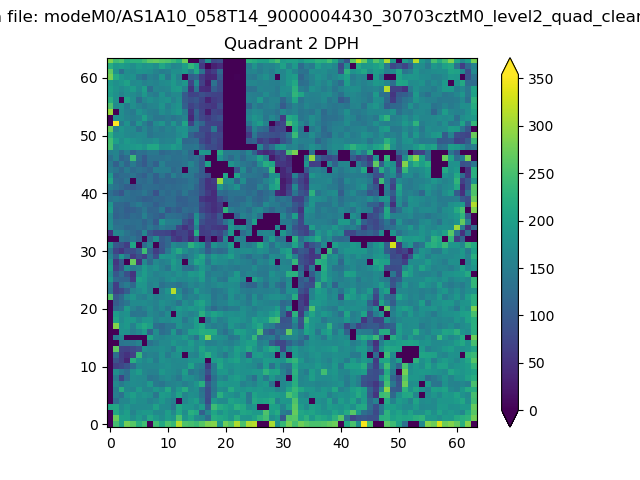
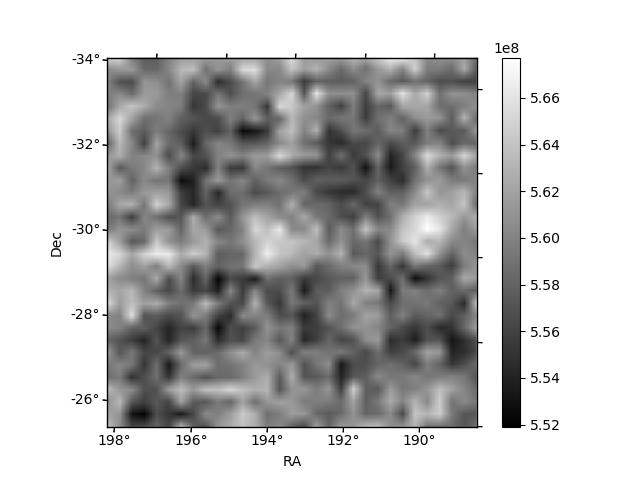
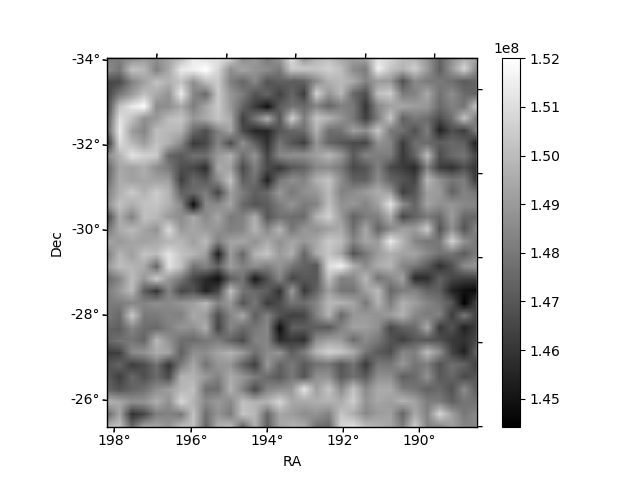
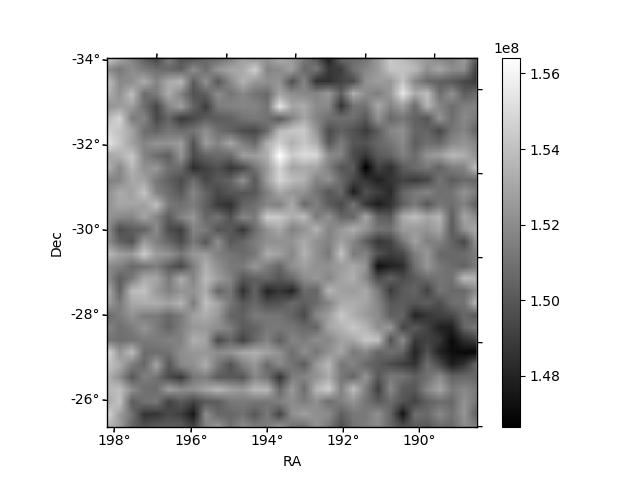
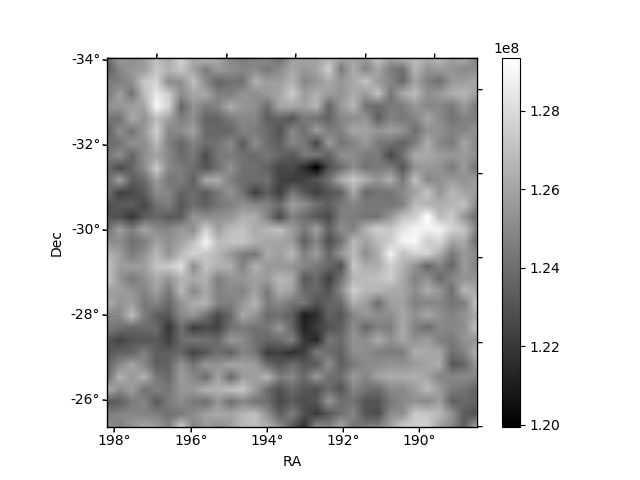
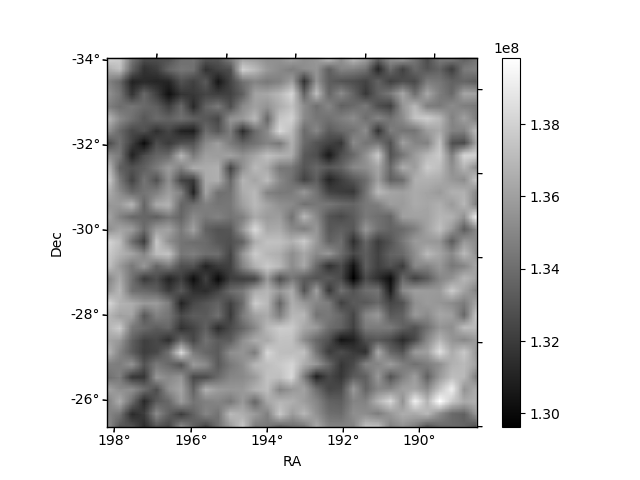
Histogram calculated using DETX and DETY for each event in the final _common_clean file
| Quadrant A | 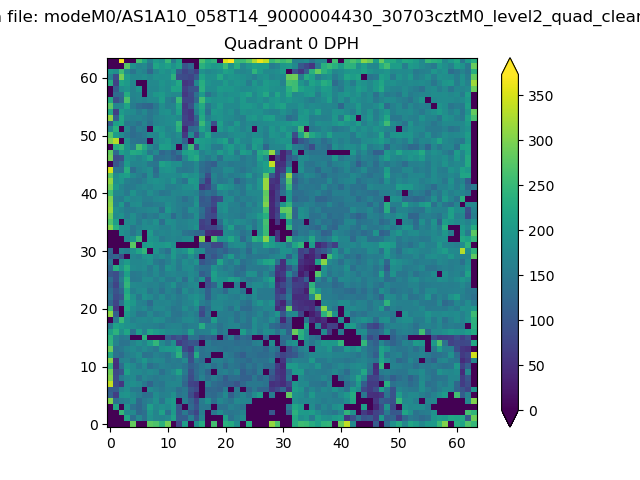 |
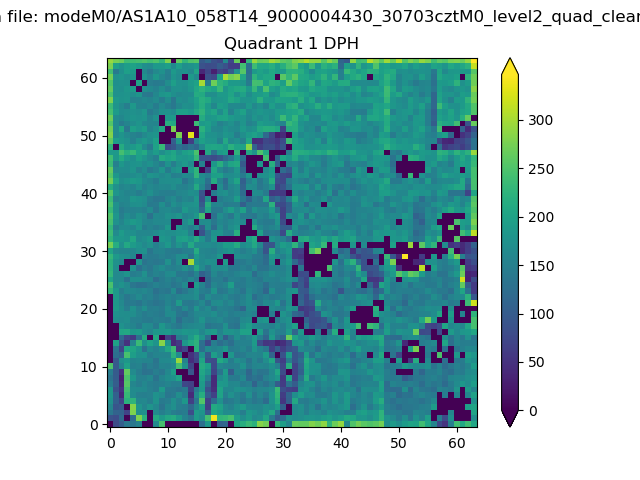 |
Quadrant B |
|---|---|---|---|
| Quadrant D | 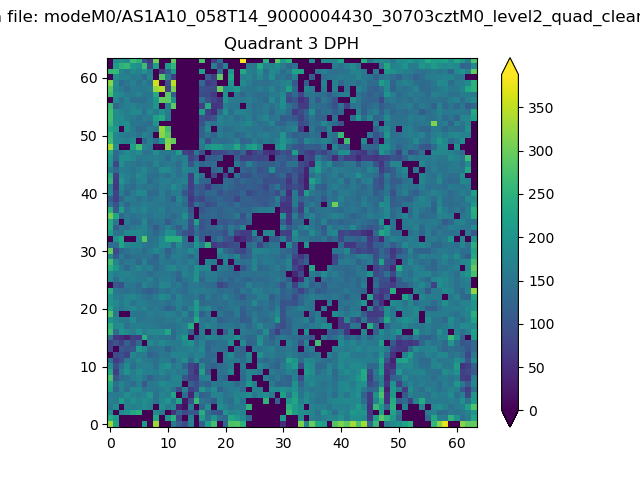 |
 |
Quadrant C |
| Plot type | Count rate plots | Images |
|---|---|---|
| Comparison with Poisson distribution Blue bars denote a histogram of data divided into 1 sec bins. Red curve is a Poisson curve with rate = median count rate of data. |
 |
 |
| Quadrant-wise count rates Data is divided into 100 sec bins |
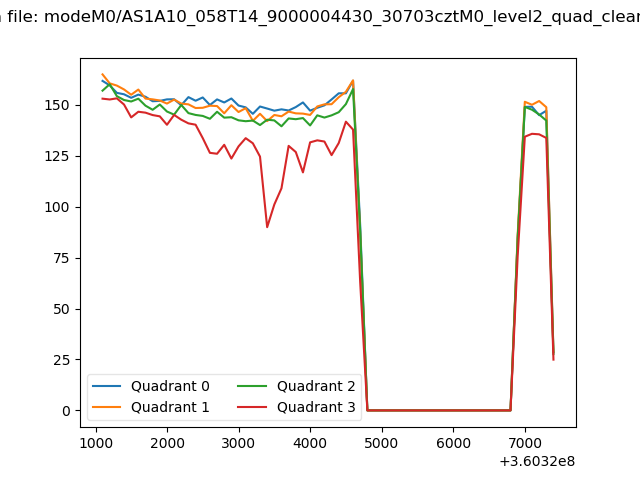 |
|
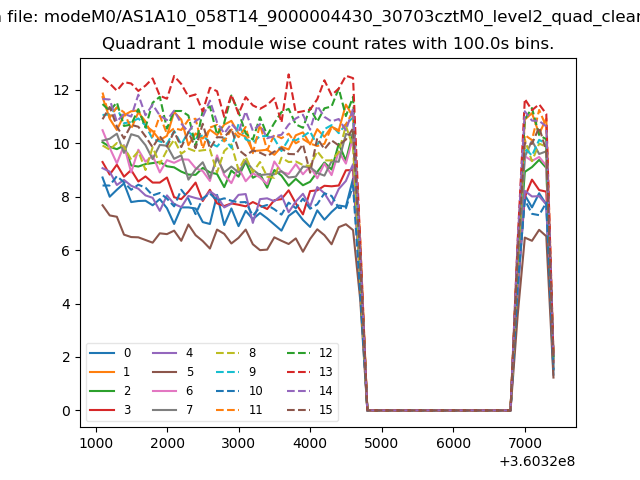
| Module-wise count rates for Quadrant A Data is divided into 100 sec bins |
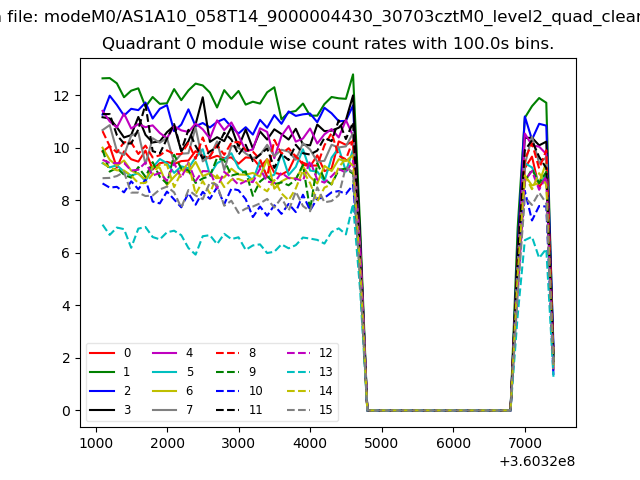 |
 |
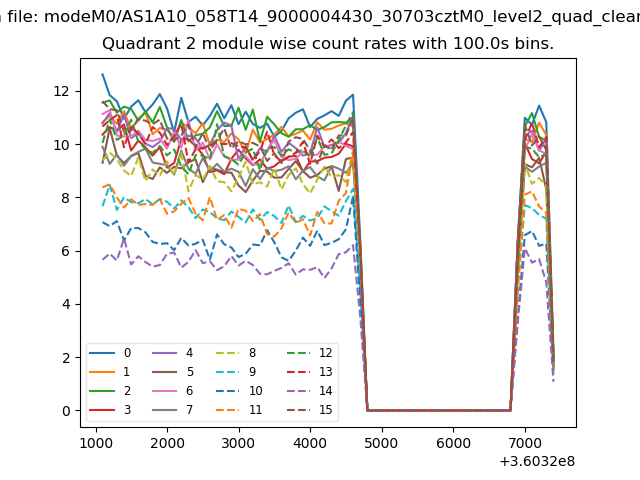
| Module-wise count rates for Quadrant B Data is divided into 100 sec bins |
 |
 |
| Module-wise count rates for Quadrant C Data is divided into 100 sec bins |
 |
 |
| Module-wise count rates for Quadrant D Data is divided into 100 sec bins |
 |
 |
| Parameter | Plot |
|---|---|
| CZT HV Monitor | 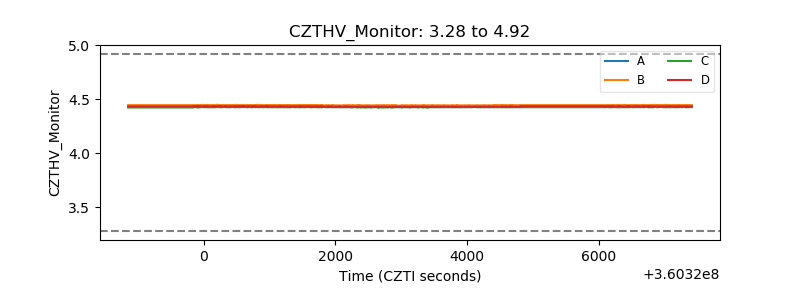 |
| D_VDD | 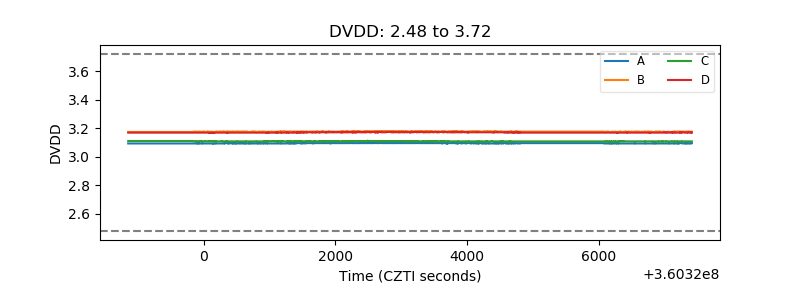 |
| Temperature 1 | 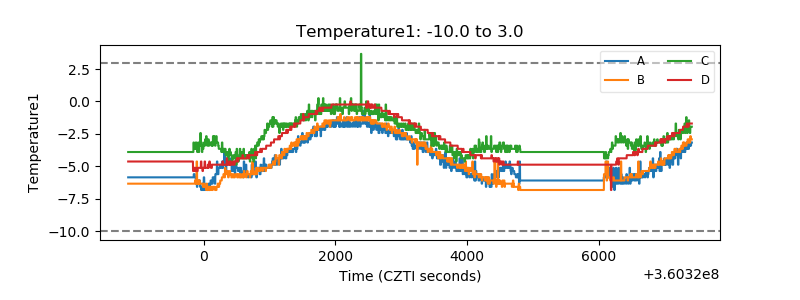 |
| Veto HV Monitor |  |
| Veto LLD | 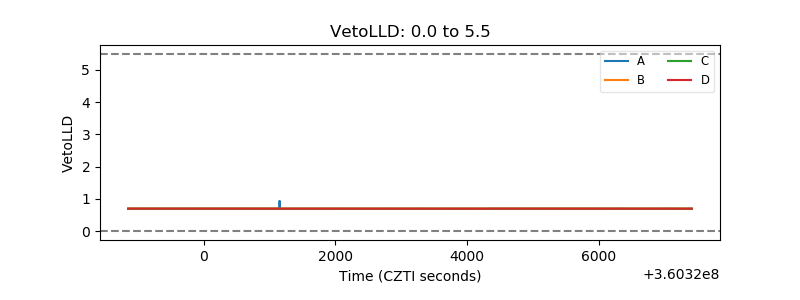 |
| Alpha Counter | 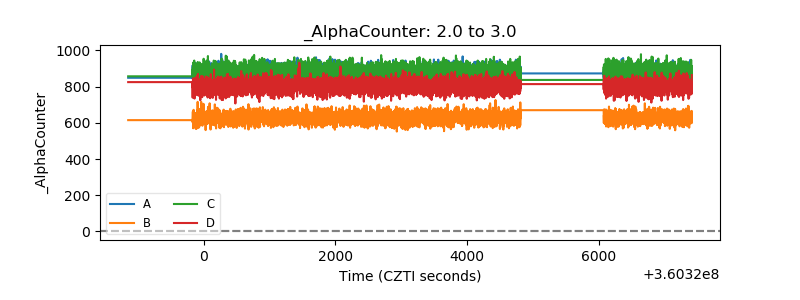 |
| _CPM_Rate | 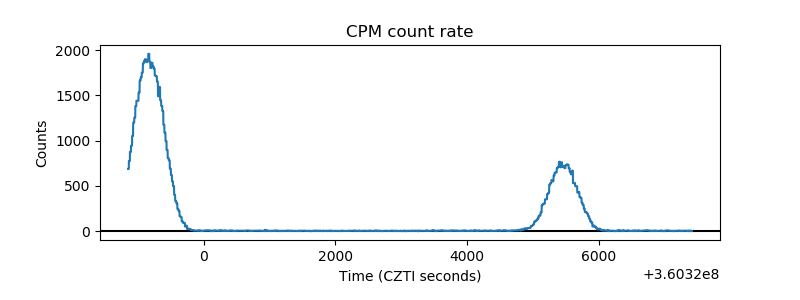 |
| CZT Counter | 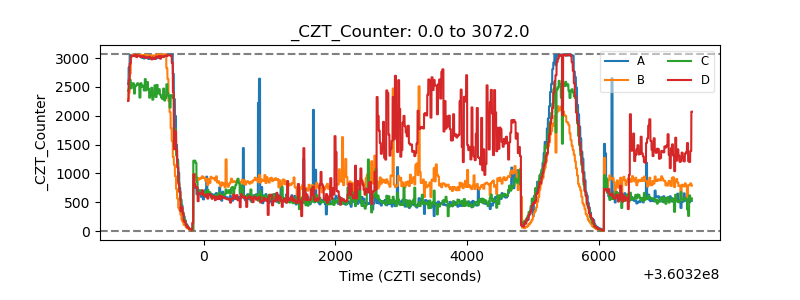 |
| +2.5 Volts monitor |  |
| +5 Volts monitor |  |
| _ROLL_ROT |  |
| _Roll_DEC |  |
| _Roll_RA | 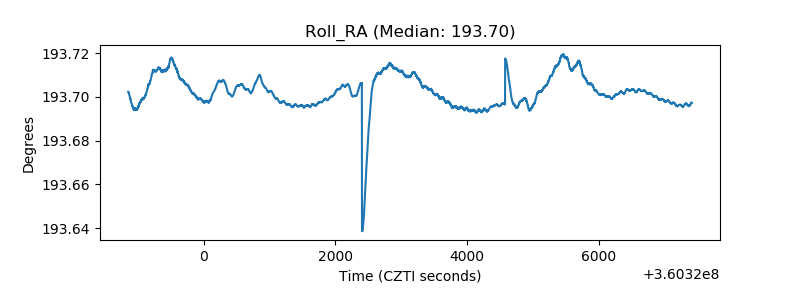 |
| Veto Counter | 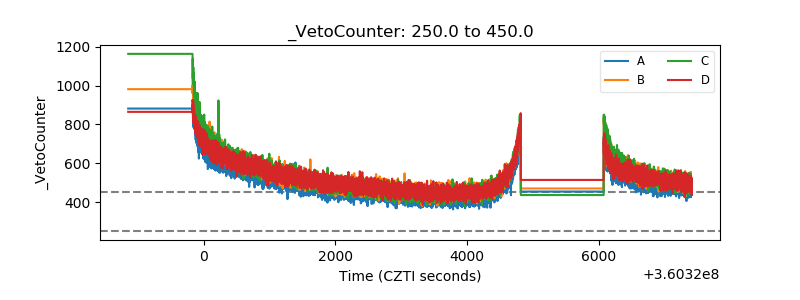 |