| Param | Original file | Final file |
|---|---|---|
| Filename | modeM0/AS1A10_058T14_9000004430_30704cztM0_level2.evt | modeM0/AS1A10_058T14_9000004430_30704cztM0_level2_quad_clean.evt |
| Size (bytes) | 730,244,160 | 98,297,280 |
| Size | 696.4 MB | 93.7 MB |
| Events in quadrant A | 3,648,674 | 655,682 |
| Events in quadrant B | 5,387,402 | 652,761 |
| Events in quadrant C | 3,842,945 | 626,193 |
| Events in quadrant D | 8,784,806 | 574,524 |
| Mode M9 | |||
|---|---|---|---|
| Quadrant | BADHDUFLAG | Total packets | Discarded packets |
| A | 0 | 9 | 0 |
| B | 0 | 9 | 0 |
| C | 0 | 9 | 0 |
| D | 0 | 9 | 0 |
| Mode SS | |||
|---|---|---|---|
| Quadrant | BADHDUFLAG | Total packets | Discarded packets |
| A | 0 | 136 | 0 |
| B | 0 | 136 | 0 |
| C | 0 | 136 | 0 |
| D | 0 | 136 | 0 |
| Mode M0 | |||
|---|---|---|---|
| Quadrant | BADHDUFLAG | Total packets | Discarded packets |
| A | 0 | 14748 | 2 |
| B | 0 | 20530 | 2 |
| C | 0 | 15439 | 2 |
| D | 0 | 30849 | 2 |
| Quadrant | Total seconds | Saturated seconds | Saturation percentage |
|---|---|---|---|
| A | 6707 | 170 | 2.534665% |
| B | 6707 | 230 | 3.429253% |
| C | 6707 | 275 | 4.100194% |
| D | 6708 | 612 | 9.123435% |
Noise dominated data is calculated using 1-second bins in cleaned event files. If a bin has >2000 counts, and if more than 50% of those come from <1% of pixels, then it is considered to be noise-dominated and hence unusable.
| Quadrant | # 1 sec bins | Bins with >0 counts | Bins with >2000 counts | High rate bins dominated by noise | Noise dominated (total time) | Noise dominated (detector-on time) | Marked lightcurve |
|---|---|---|---|---|---|---|---|
| A | 7597 | 6707 | 11 | 11 | 0.14% | 0.16% | 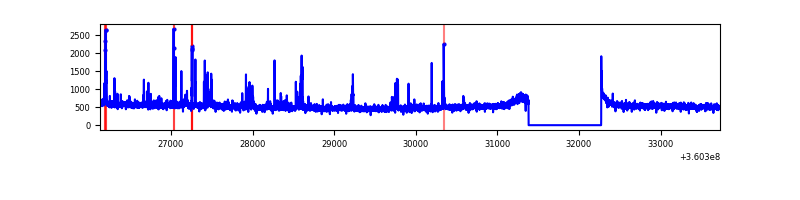 |
| B | 7597 | 6707 | 12 | 12 | 0.16% | 0.18% | 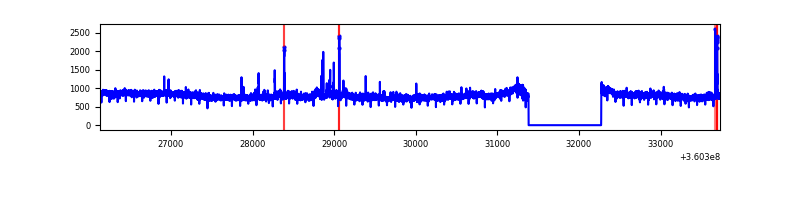 |
| C | 7597 | 6707 | 63 | 63 | 0.83% | 0.94% | 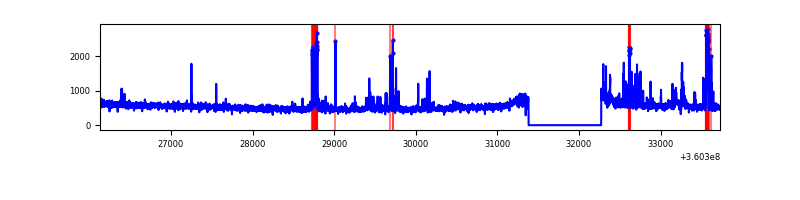 |
| D | 7598 | 6708 | 528 | 528 | 6.95% | 7.87% | 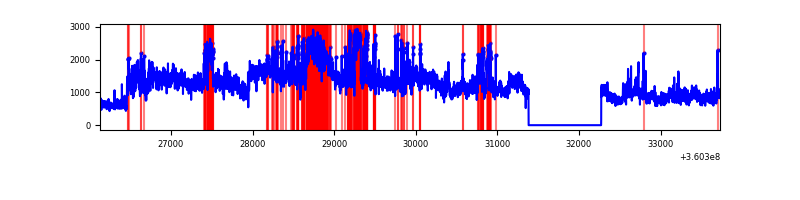 |
Top three noisy pixels from each quadrant. If the there are fewer than three noisy pixels in the level2.evt file, extra rows are filled as -1
| Pixel properties | Quadrant properties | ||||||
|---|---|---|---|---|---|---|---|
| Quadrant | DetID | PixID | Counts | Sigma | Mean | Median | Sigma |
| A | 0 | 13 | 203920 | 1144.58 | 891 | 876 | 177.4 |
| A | 13 | 254 | 12865 | 67.58 | 891 | 876 | 177.4 |
| A | 3 | 137 | 8481 | 42.87 | 891 | 876 | 177.4 |
| B | 6 | 159 | 1838510 | 11032.45 | 871 | 850 | 166.6 |
| B | 0 | 190 | 58915 | 348.6 | 871 | 850 | 166.6 |
| B | 12 | 111 | 20147 | 115.85 | 871 | 850 | 166.6 |
| C | 10 | 22 | 363201 | 1840.96 | 844 | 851 | 196.8 |
| C | 14 | 238 | 136293 | 688.13 | 844 | 851 | 196.8 |
| C | 2 | 114 | 15391 | 73.87 | 844 | 851 | 196.8 |
| D | 8 | 195 | 4892298 | 23125.33 | 833 | 817 | 211.5 |
| D | 1 | 52 | 286980 | 1352.89 | 833 | 817 | 211.5 |
| D | 13 | 249 | 157300 | 739.8 | 833 | 817 | 211.5 |
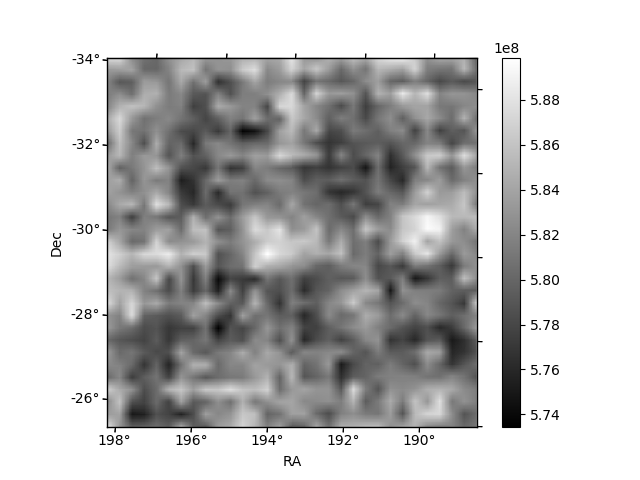
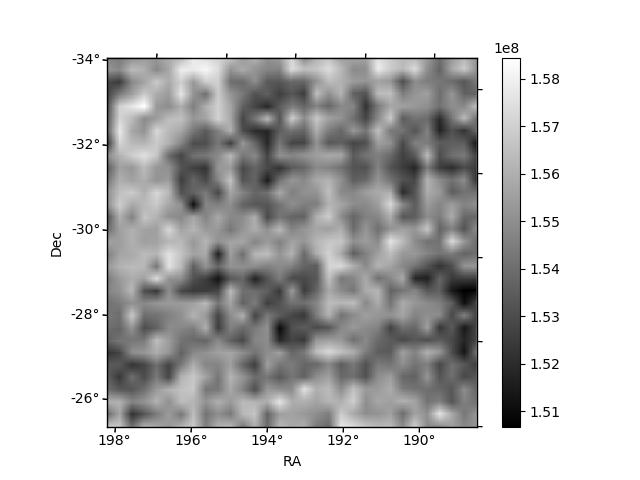
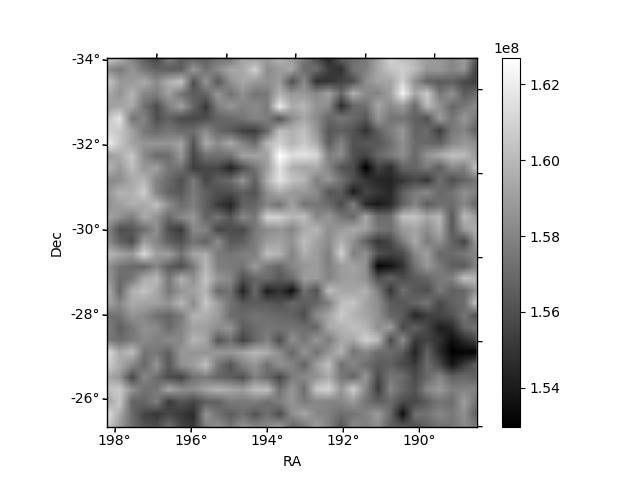
Histogram calculated using DETX and DETY for each event in the final _common_clean file
| Quadrant A | 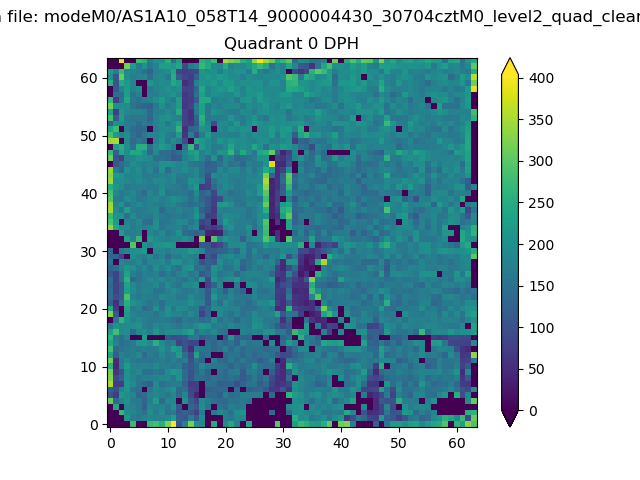 |
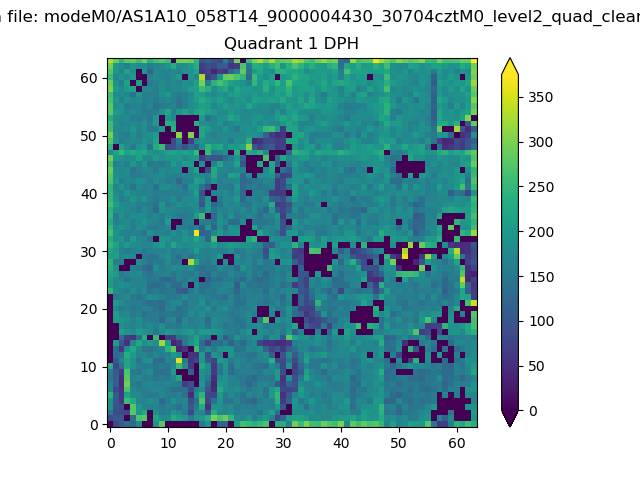 |
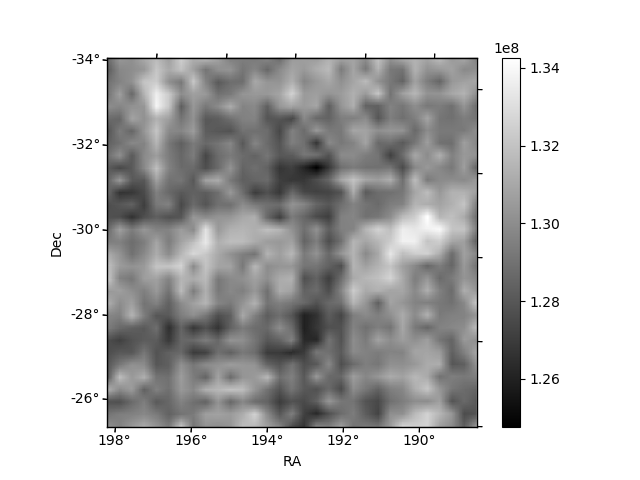
Quadrant B |
|---|---|---|---|
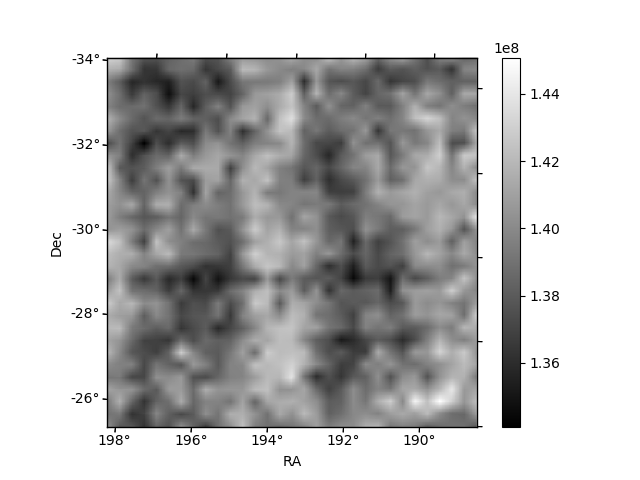
| Quadrant D | 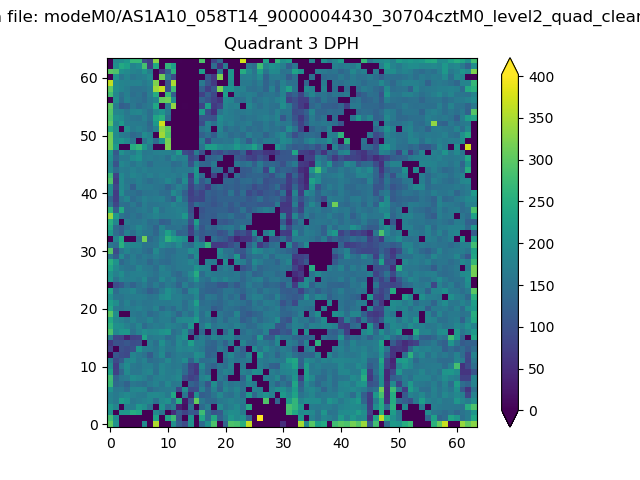 |
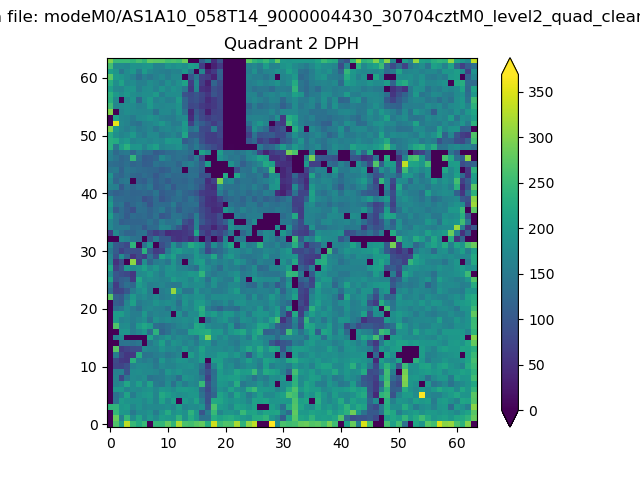 |
Quadrant C |
| Plot type | Count rate plots | Images |
|---|---|---|
| Comparison with Poisson distribution Blue bars denote a histogram of data divided into 1 sec bins. Red curve is a Poisson curve with rate = median count rate of data. |
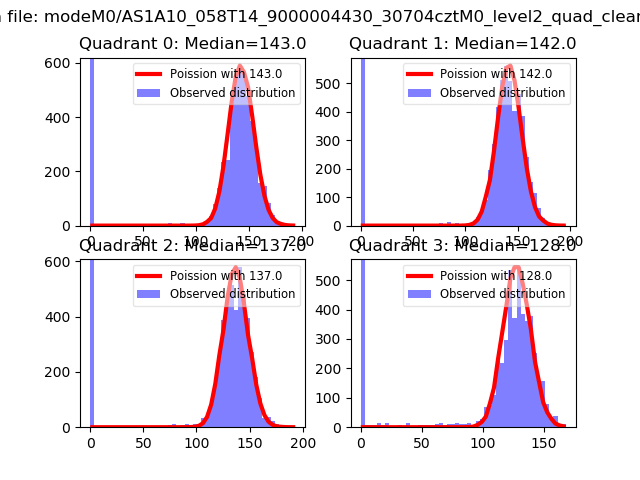 |
 |
| Quadrant-wise count rates Data is divided into 100 sec bins |
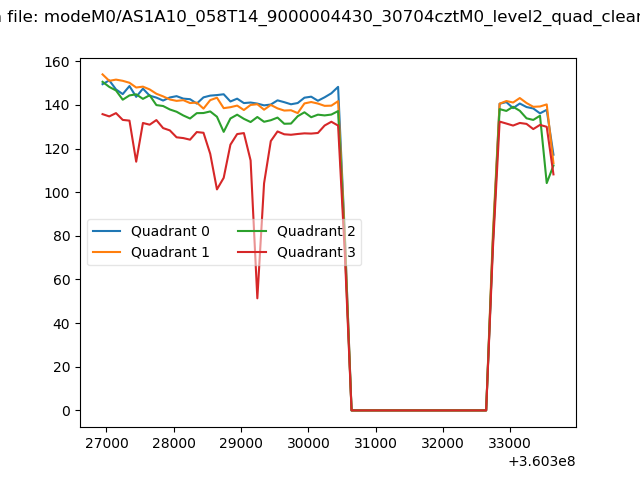 |
|
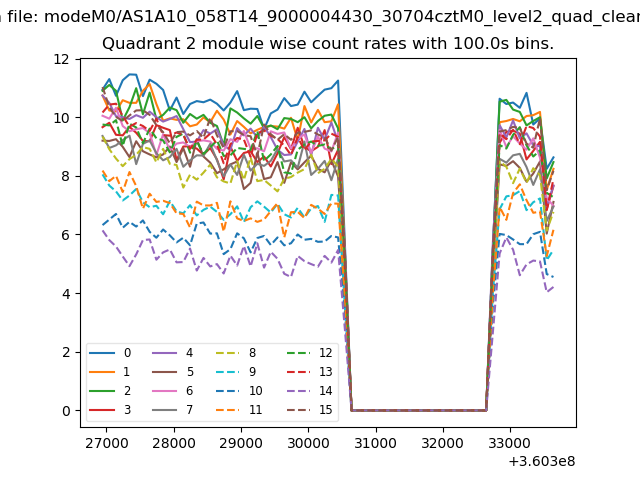
| Module-wise count rates for Quadrant A Data is divided into 100 sec bins |
 |
 |
| Module-wise count rates for Quadrant B Data is divided into 100 sec bins |
 |
 |
| Module-wise count rates for Quadrant C Data is divided into 100 sec bins |
 |
 |
| Module-wise count rates for Quadrant D Data is divided into 100 sec bins |
 |
 |
| Parameter | Plot |
|---|---|
| CZT HV Monitor | 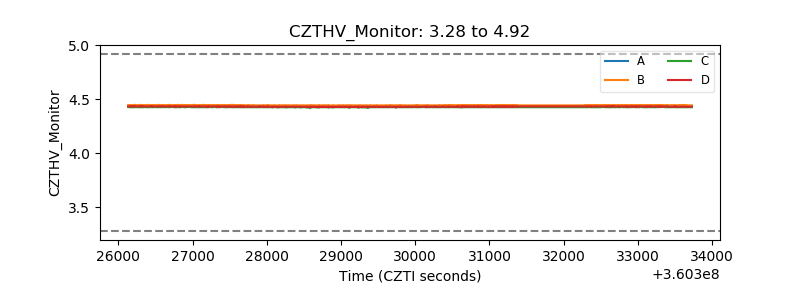 |
| D_VDD | 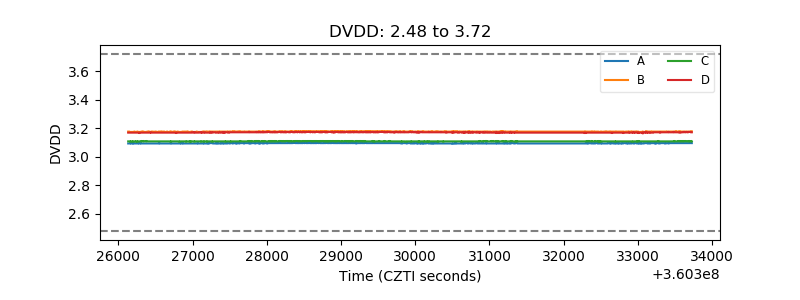 |
| Temperature 1 | 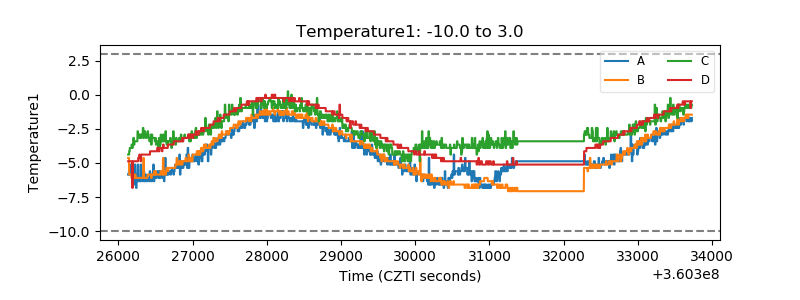 |
| Veto HV Monitor | 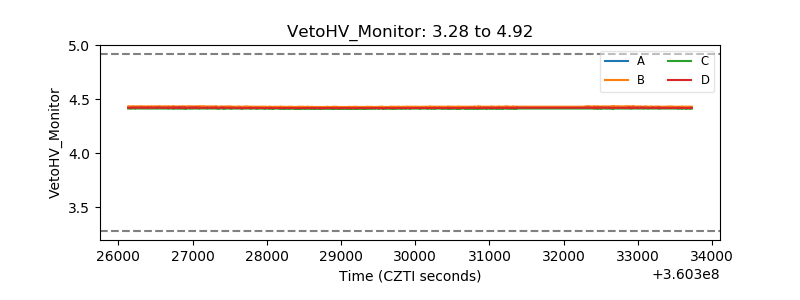 |
| Veto LLD |  |
| Alpha Counter | 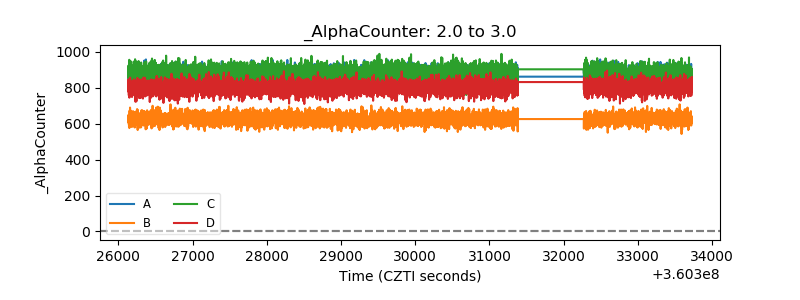 |
| _CPM_Rate | 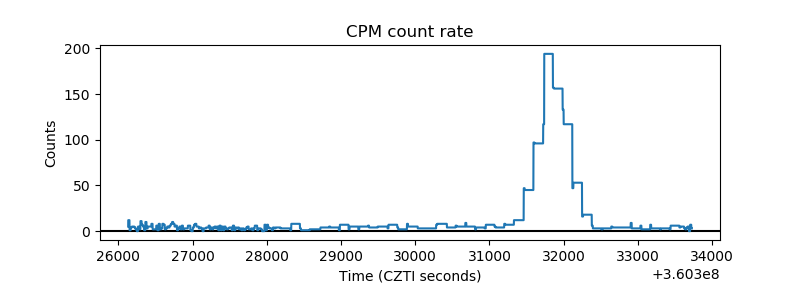 |
| CZT Counter | 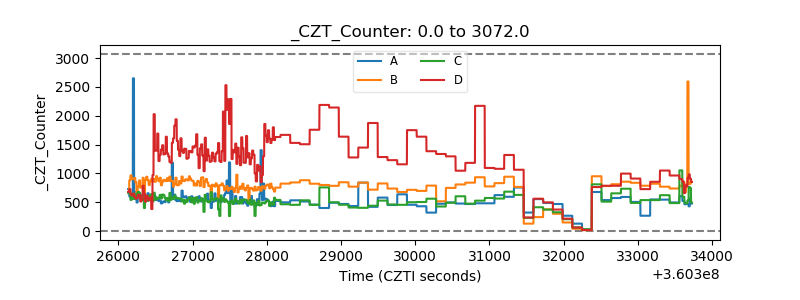 |
| +2.5 Volts monitor |  |
| +5 Volts monitor | 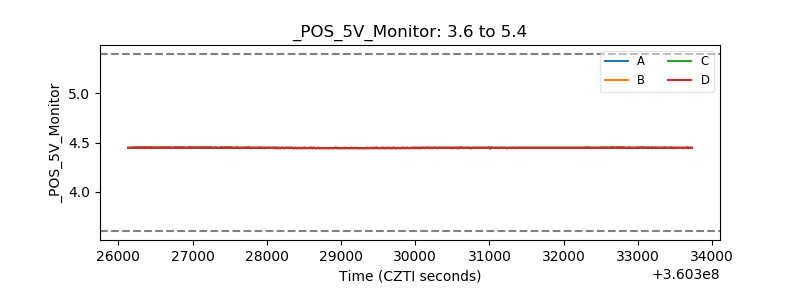 |
| _ROLL_ROT | 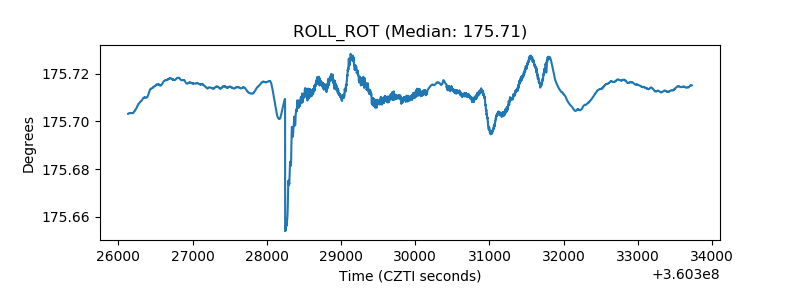 |
| _Roll_DEC | 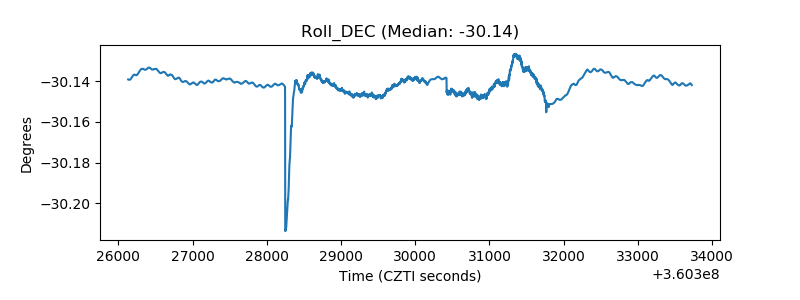 |
| _Roll_RA | 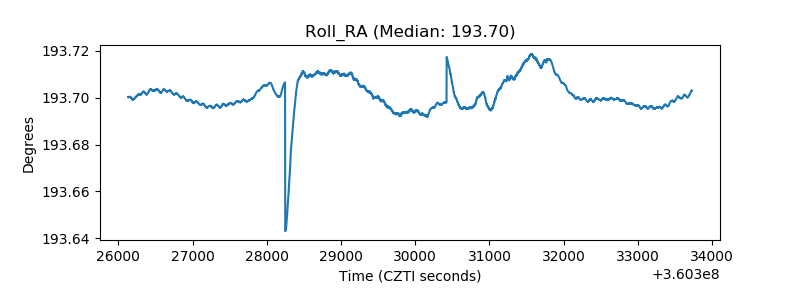 |
| Veto Counter | 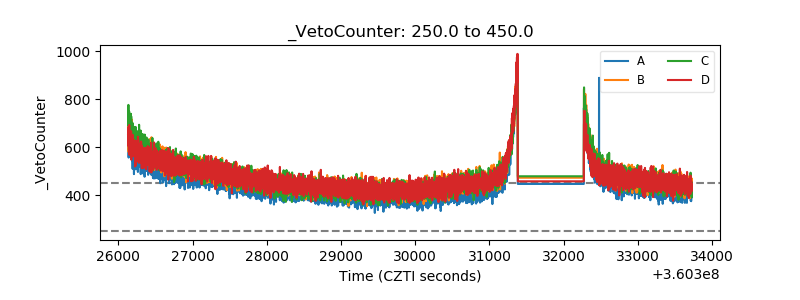 |