| Param | Original file | Final file |
|---|---|---|
| Filename | modeM0/AS1A10_058T14_9000004430_30705cztM0_level2.evt | modeM0/AS1A10_058T14_9000004430_30705cztM0_level2_quad_clean.evt |
| Size (bytes) | 746,573,760 | 104,656,320 |
| Size | 712.0 MB | 99.8 MB |
| Events in quadrant A | 3,852,838 | 688,707 |
| Events in quadrant B | 6,070,240 | 682,005 |
| Events in quadrant C | 4,089,829 | 658,835 |
| Events in quadrant D | 8,099,518 | 626,282 |
| Mode M9 | |||
|---|---|---|---|
| Quadrant | BADHDUFLAG | Total packets | Discarded packets |
| A | 0 | 13 | 0 |
| B | 0 | 13 | 0 |
| C | 0 | 13 | 0 |
| D | 0 | 13 | 0 |
| Mode SS | |||
|---|---|---|---|
| Quadrant | BADHDUFLAG | Total packets | Discarded packets |
| A | 0 | 152 | 0 |
| B | 0 | 150 | 0 |
| C | 0 | 150 | 0 |
| D | 0 | 150 | 0 |
| Mode M0 | |||
|---|---|---|---|
| Quadrant | BADHDUFLAG | Total packets | Discarded packets |
| A | 0 | 15932 | 2 |
| B | 0 | 23162 | 2 |
| C | 0 | 16736 | 2 |
| D | 0 | 29307 | 2 |
| Quadrant | Total seconds | Saturated seconds | Saturation percentage |
|---|---|---|---|
| A | 7383 | 267 | 3.616416% |
| B | 7383 | 381 | 5.160504% |
| C | 7383 | 389 | 5.268861% |
| D | 7383 | 500 | 6.772315% |
Noise dominated data is calculated using 1-second bins in cleaned event files. If a bin has >2000 counts, and if more than 50% of those come from <1% of pixels, then it is considered to be noise-dominated and hence unusable.
| Quadrant | # 1 sec bins | Bins with >0 counts | Bins with >2000 counts | High rate bins dominated by noise | Noise dominated (total time) | Noise dominated (detector-on time) | Marked lightcurve |
|---|---|---|---|---|---|---|---|
| A | 8678 | 7383 | 14 | 14 | 0.16% | 0.19% | 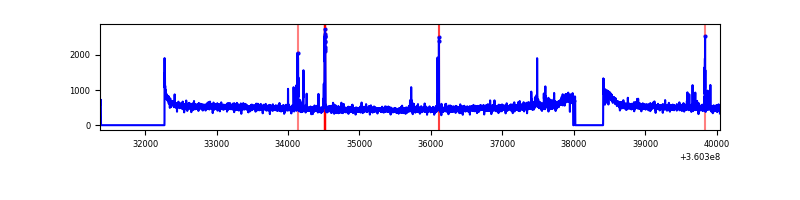 |
| B | 8678 | 7383 | 26 | 26 | 0.30% | 0.35% | 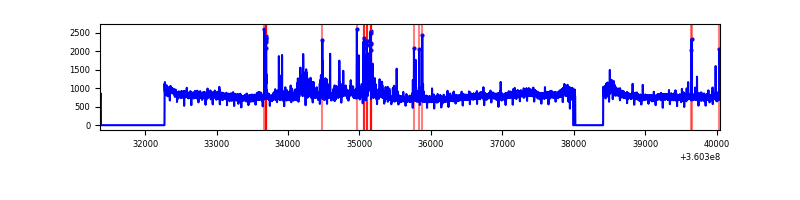 |
| C | 8678 | 7383 | 41 | 41 | 0.47% | 0.56% | 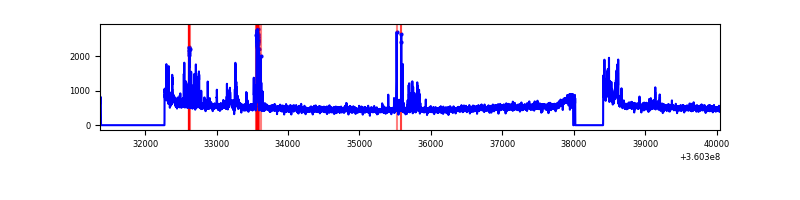 |
| D | 8678 | 7383 | 298 | 298 | 3.43% | 4.04% | 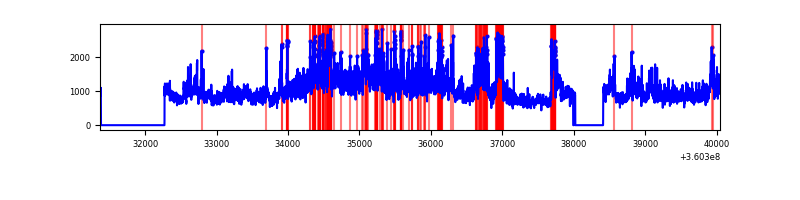 |
Top three noisy pixels from each quadrant. If the there are fewer than three noisy pixels in the level2.evt file, extra rows are filled as -1
| Pixel properties | Quadrant properties | ||||||
|---|---|---|---|---|---|---|---|
| Quadrant | DetID | PixID | Counts | Sigma | Mean | Median | Sigma |
| A | 0 | 13 | 135619 | 703.17 | 960 | 940 | 191.5 |
| A | 13 | 254 | 14394 | 70.24 | 960 | 940 | 191.5 |
| A | 8 | 192 | 11693 | 56.14 | 960 | 940 | 191.5 |
| B | 6 | 159 | 2008257 | 11068.83 | 939 | 912 | 181.4 |
| B | 0 | 230 | 139349 | 763.36 | 939 | 912 | 181.4 |
| B | 0 | 190 | 85521 | 466.55 | 939 | 912 | 181.4 |
| C | 10 | 22 | 350241 | 1653.22 | 907 | 914 | 211.3 |
| C | 14 | 238 | 144706 | 680.51 | 907 | 914 | 211.3 |
| C | 2 | 114 | 17076 | 76.49 | 907 | 914 | 211.3 |
| D | 8 | 195 | 3419638 | 15512.46 | 921 | 894 | 220.4 |
| D | 1 | 52 | 641500 | 2906.73 | 921 | 894 | 220.4 |
| D | 12 | 218 | 232426 | 1050.57 | 921 | 894 | 220.4 |
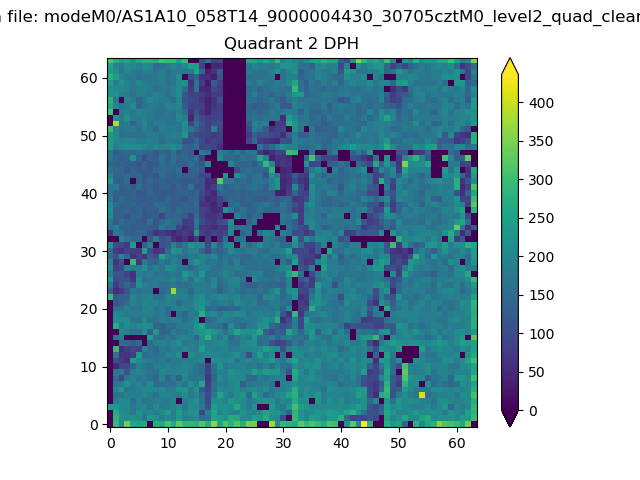
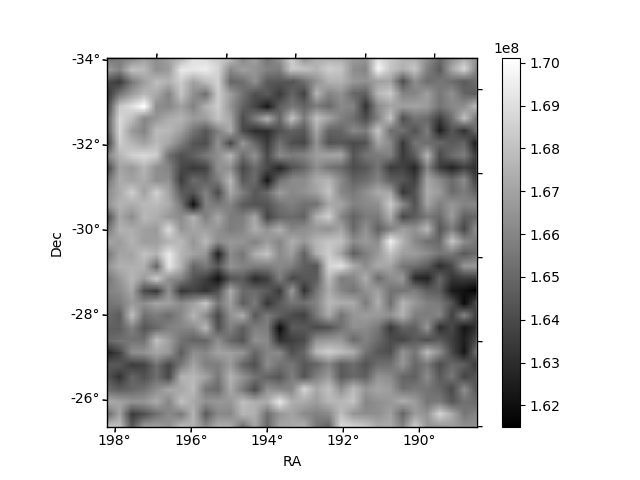
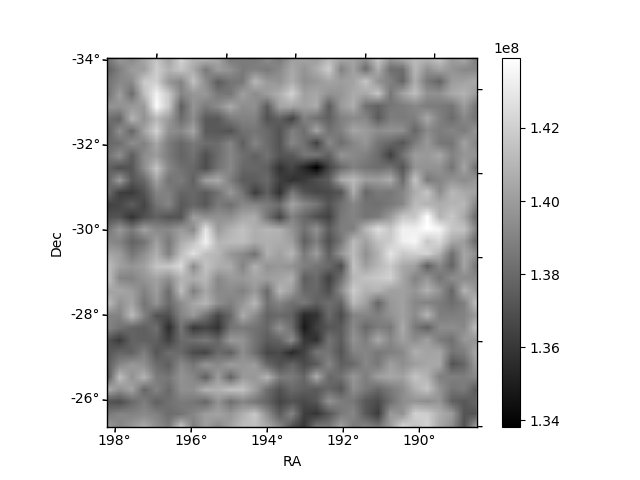
Histogram calculated using DETX and DETY for each event in the final _common_clean file
| Quadrant A | 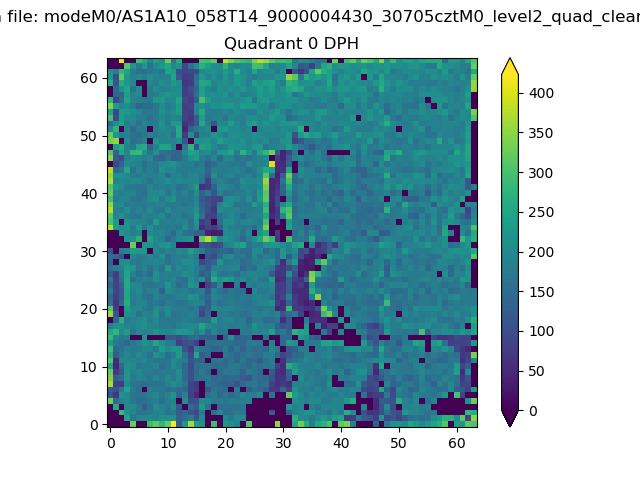 |
 |
Quadrant B |
|---|---|---|---|
| Quadrant D |  |
 |
Quadrant C |
| Plot type | Count rate plots | Images |
|---|---|---|
| Comparison with Poisson distribution Blue bars denote a histogram of data divided into 1 sec bins. Red curve is a Poisson curve with rate = median count rate of data. |
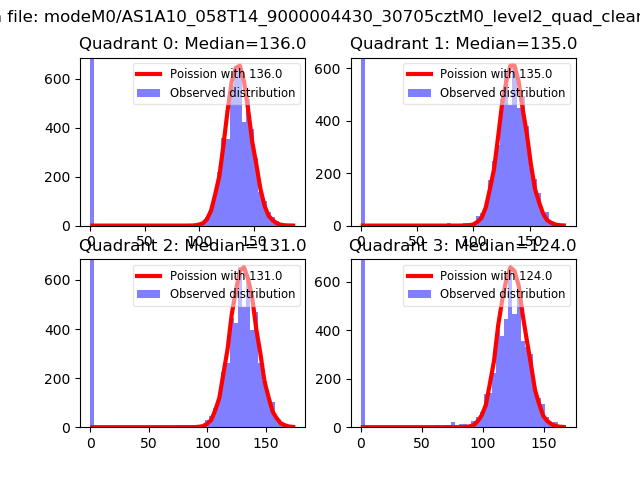 |
 |
| Quadrant-wise count rates Data is divided into 100 sec bins |
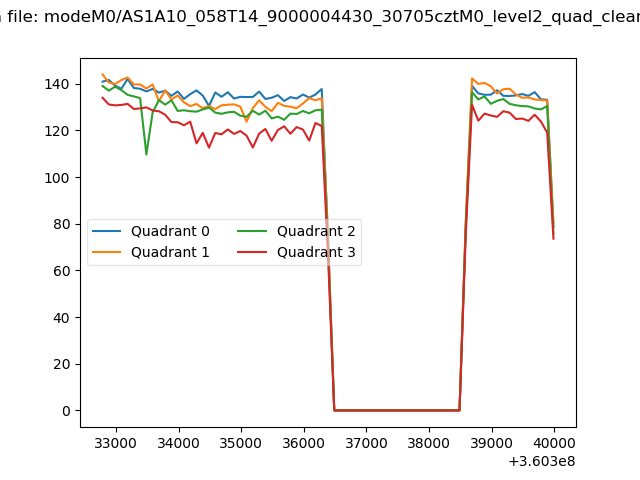 |
|
| Module-wise count rates for Quadrant A Data is divided into 100 sec bins |
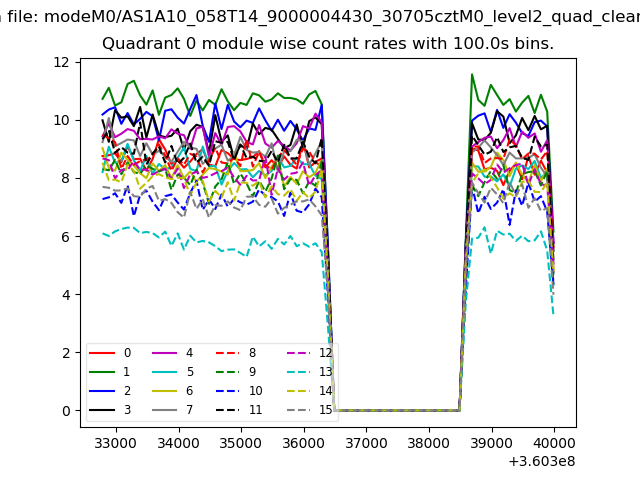 |
 |
| Module-wise count rates for Quadrant B Data is divided into 100 sec bins |
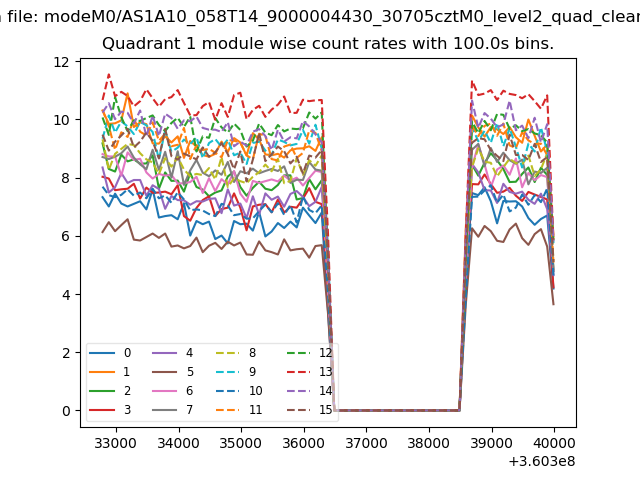 |
 |
| Module-wise count rates for Quadrant C Data is divided into 100 sec bins |
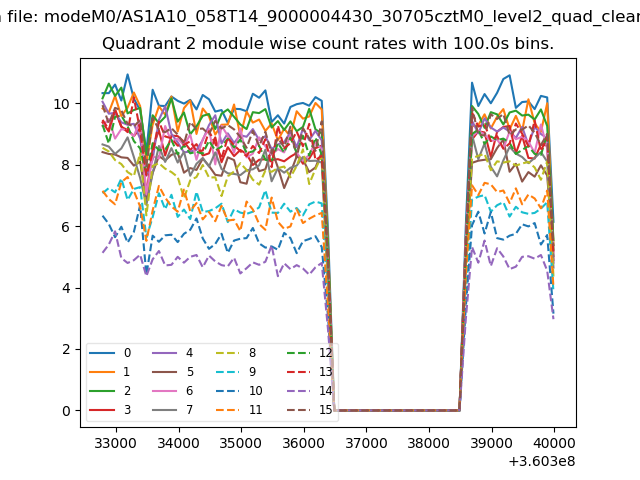 |
 |
| Module-wise count rates for Quadrant D Data is divided into 100 sec bins |
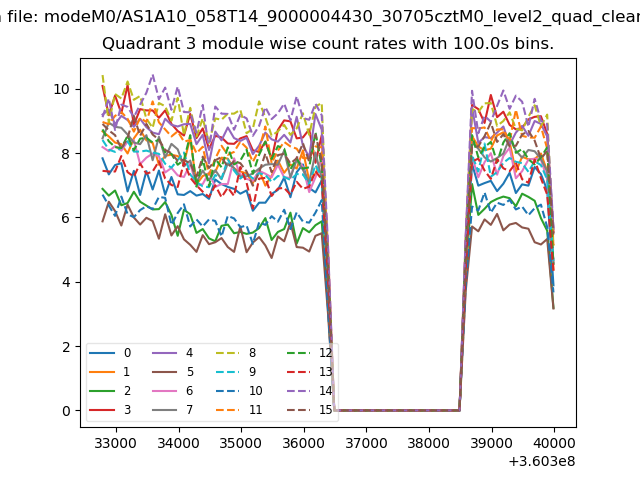 |
 |
| Parameter | Plot |
|---|---|
| CZT HV Monitor | 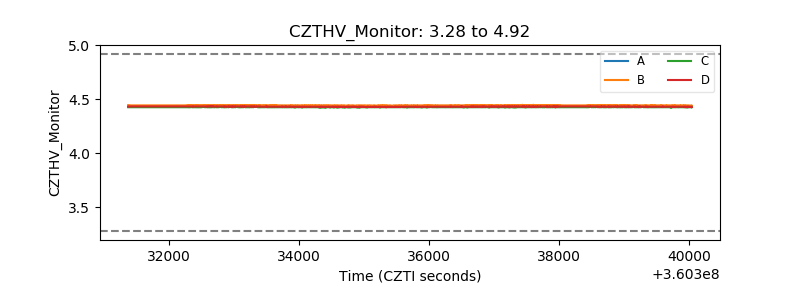 |
| D_VDD | 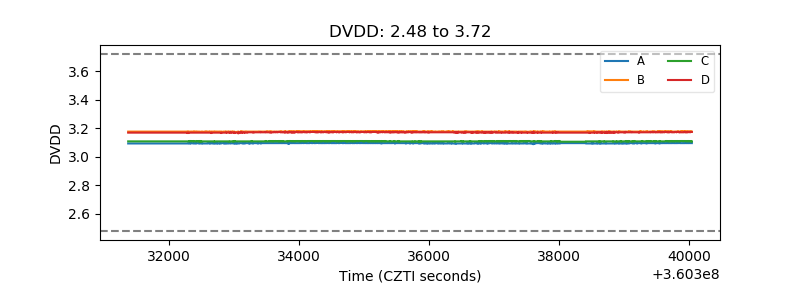 |
| Temperature 1 |  |
| Veto HV Monitor | 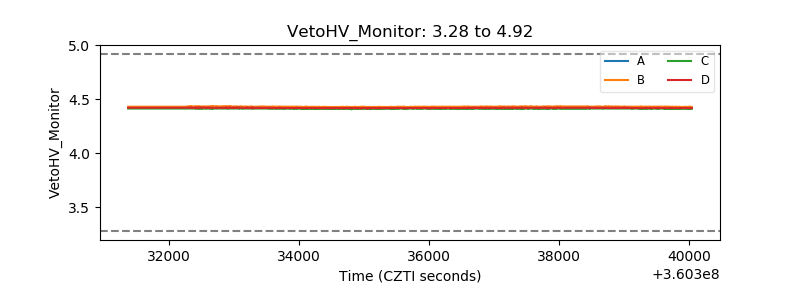 |
| Veto LLD | 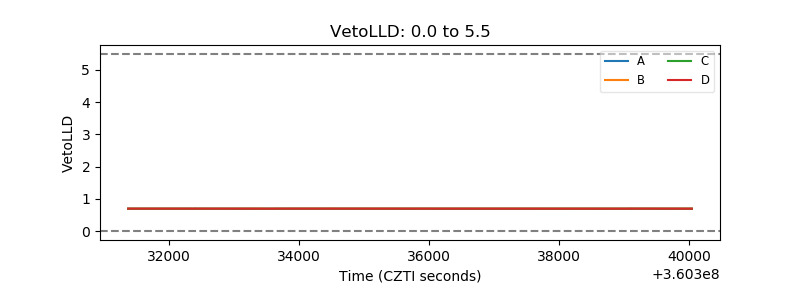 |
| Alpha Counter | 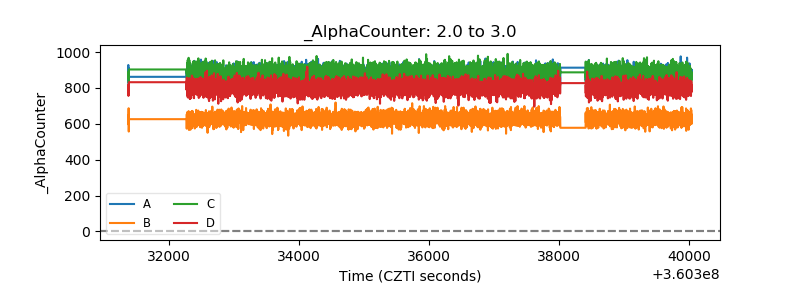 |
| _CPM_Rate | 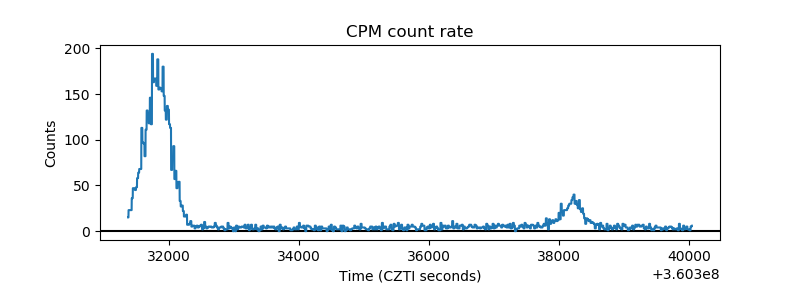 |
| CZT Counter |  |
| +2.5 Volts monitor |  |
| +5 Volts monitor |  |
| _ROLL_ROT | 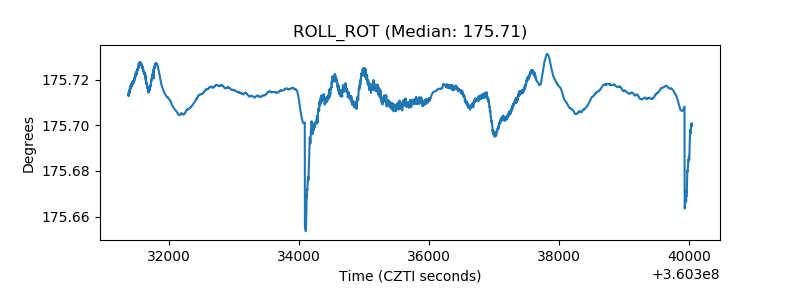 |
| _Roll_DEC | 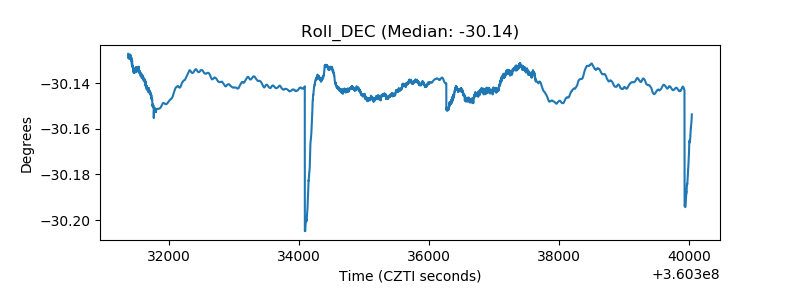 |
| _Roll_RA |  |
| Veto Counter | 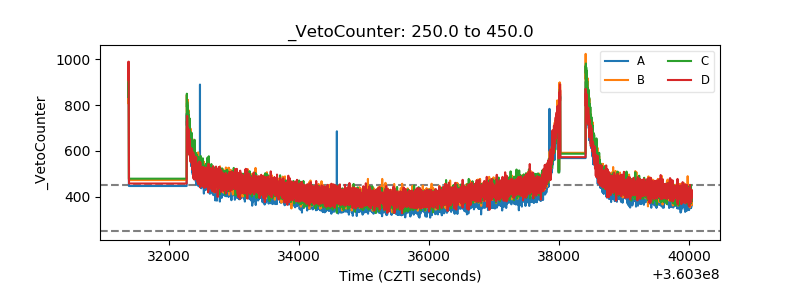 |