| Param | Original file | Final file |
|---|---|---|
| Filename | modeM0/AS1A10_058T14_9000004430_30706cztM0_level2.evt | modeM0/AS1A10_058T14_9000004430_30706cztM0_level2_quad_clean.evt |
| Size (bytes) | 853,992,000 | 106,421,760 |
| Size | 814.4 MB | 101.5 MB |
| Events in quadrant A | 4,204,878 | 709,883 |
| Events in quadrant B | 6,000,303 | 702,686 |
| Events in quadrant C | 4,238,798 | 674,735 |
| Events in quadrant D | 10,913,264 | 611,713 |
| Mode M9 | |||
|---|---|---|---|
| Quadrant | BADHDUFLAG | Total packets | Discarded packets |
| A | 0 | 1 | 0 |
| B | 0 | 1 | 0 |
| C | 0 | 1 | 0 |
| D | 0 | 1 | 0 |
| Mode SS | |||
|---|---|---|---|
| Quadrant | BADHDUFLAG | Total packets | Discarded packets |
| A | 0 | 154 | 0 |
| B | 0 | 154 | 0 |
| C | 0 | 154 | 0 |
| D | 0 | 154 | 0 |
| Mode M0 | |||
|---|---|---|---|
| Quadrant | BADHDUFLAG | Total packets | Discarded packets |
| A | 0 | 17238 | 2 |
| B | 0 | 23259 | 2 |
| C | 0 | 17347 | 2 |
| D | 0 | 37657 | 5 |
| Quadrant | Total seconds | Saturated seconds | Saturation percentage |
|---|---|---|---|
| A | 7515 | 258 | 3.433134% |
| B | 7515 | 290 | 3.858949% |
| C | 7516 | 310 | 4.124534% |
| D | 7515 | 1175 | 15.635396% |
Noise dominated data is calculated using 1-second bins in cleaned event files. If a bin has >2000 counts, and if more than 50% of those come from <1% of pixels, then it is considered to be noise-dominated and hence unusable.
| Quadrant | # 1 sec bins | Bins with >0 counts | Bins with >2000 counts | High rate bins dominated by noise | Noise dominated (total time) | Noise dominated (detector-on time) | Marked lightcurve |
|---|---|---|---|---|---|---|---|
| A | 7645 | 7515 | 68 | 68 | 0.89% | 0.90% | 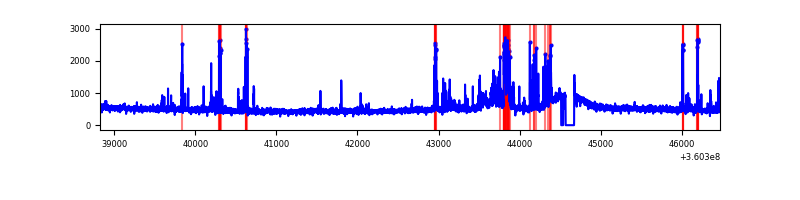 |
| B | 7645 | 7515 | 22 | 22 | 0.29% | 0.29% | 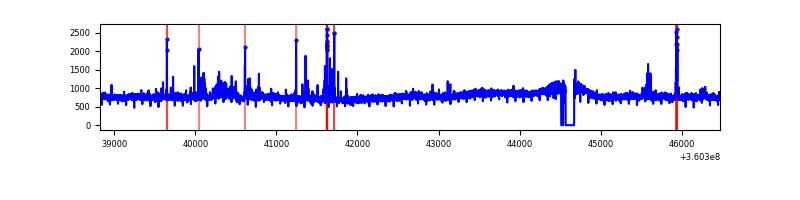 |
| C | 7646 | 7516 | 39 | 39 | 0.51% | 0.52% | 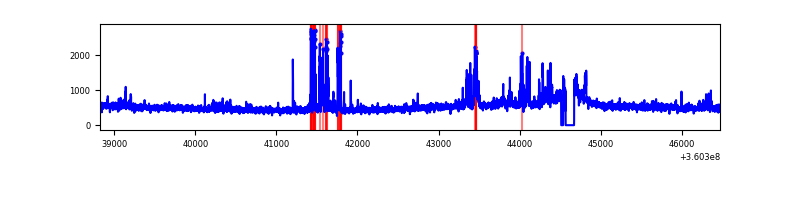 |
| D | 7644 | 7514 | 931 | 931 | 12.18% | 12.39% | 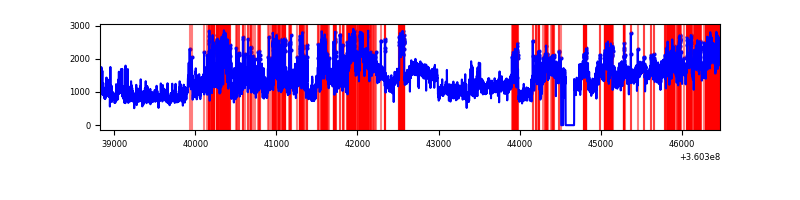 |
Top three noisy pixels from each quadrant. If the there are fewer than three noisy pixels in the level2.evt file, extra rows are filled as -1
| Pixel properties | Quadrant properties | ||||||
|---|---|---|---|---|---|---|---|
| Quadrant | DetID | PixID | Counts | Sigma | Mean | Median | Sigma |
| A | 0 | 13 | 515051 | 2666.33 | 955 | 935 | 192.8 |
| A | 13 | 254 | 14812 | 71.97 | 955 | 935 | 192.8 |
| A | 3 | 137 | 9780 | 45.87 | 955 | 935 | 192.8 |
| B | 6 | 159 | 2094295 | 11678.56 | 936 | 912 | 179.3 |
| B | 0 | 190 | 64900 | 356.98 | 936 | 912 | 179.3 |
| B | 5 | 172 | 64384 | 354.1 | 936 | 912 | 179.3 |
| C | 10 | 22 | 417803 | 1971.98 | 904 | 911 | 211.4 |
| C | 14 | 238 | 146622 | 689.24 | 904 | 911 | 211.4 |
| C | 3 | 233 | 115138 | 540.31 | 904 | 911 | 211.4 |
| D | 8 | 195 | 6063525 | 28554.83 | 885 | 862 | 212.3 |
| D | 12 | 218 | 482801 | 2269.91 | 885 | 862 | 212.3 |
| D | 13 | 174 | 441559 | 2075.66 | 885 | 862 | 212.3 |
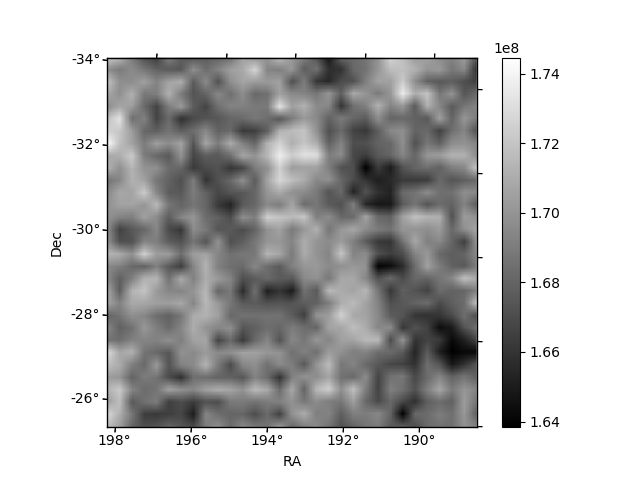
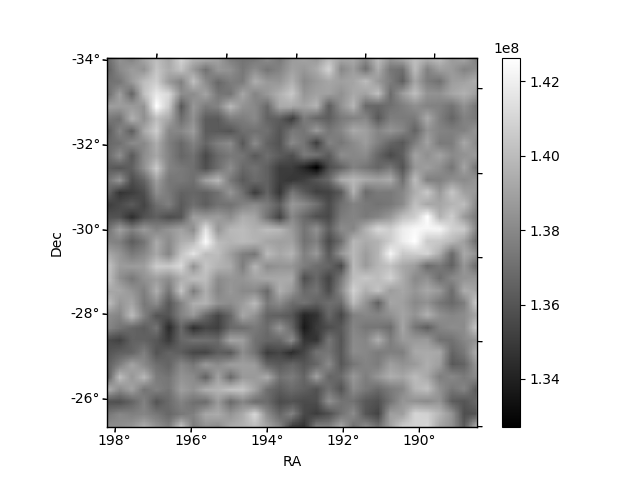
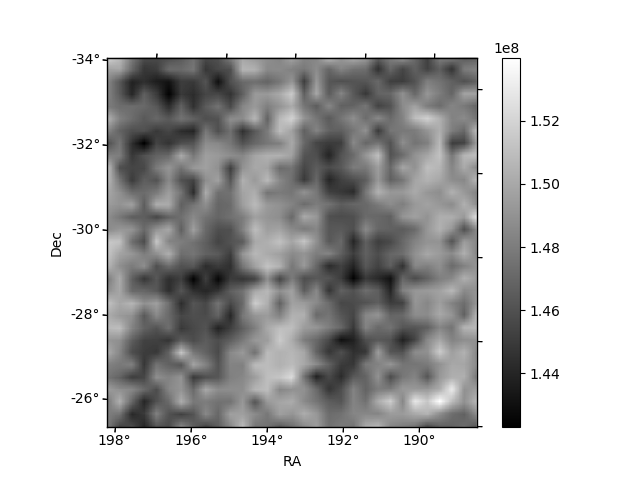
Histogram calculated using DETX and DETY for each event in the final _common_clean file
| Quadrant A | 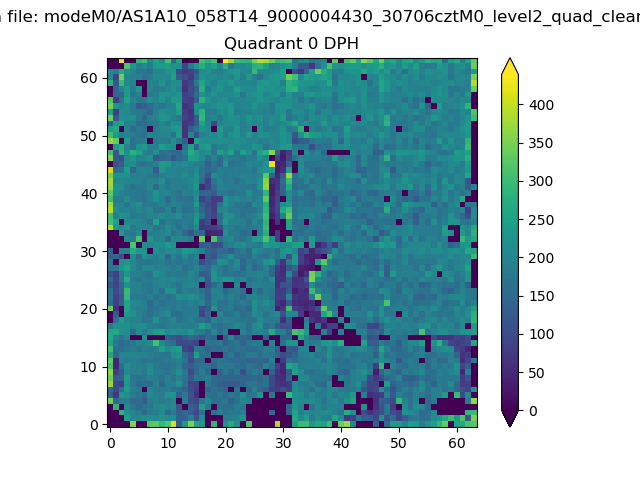 |
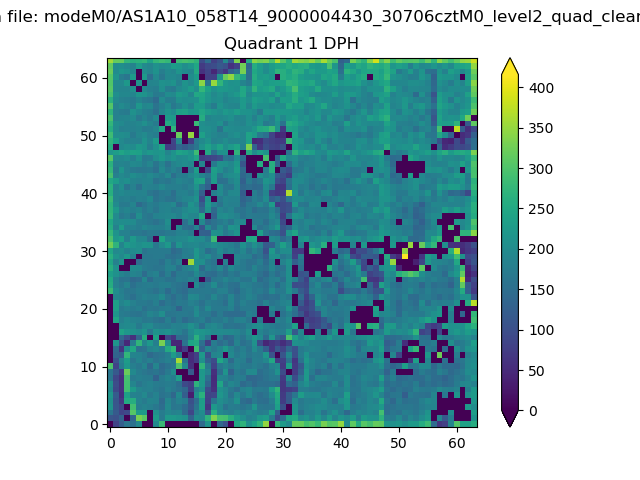 |
Quadrant B |
|---|---|---|---|
| Quadrant D | 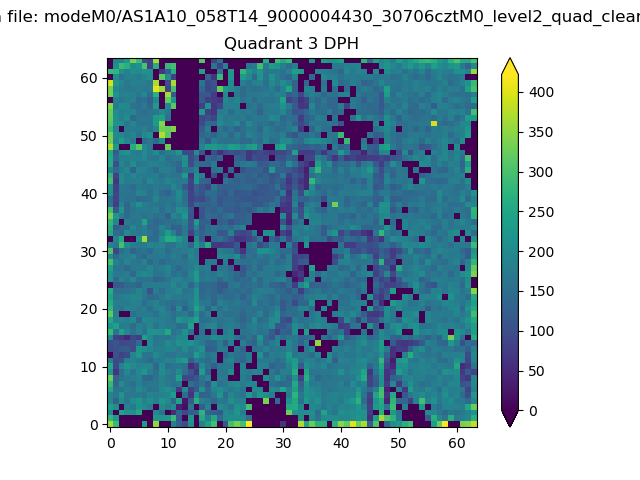 |
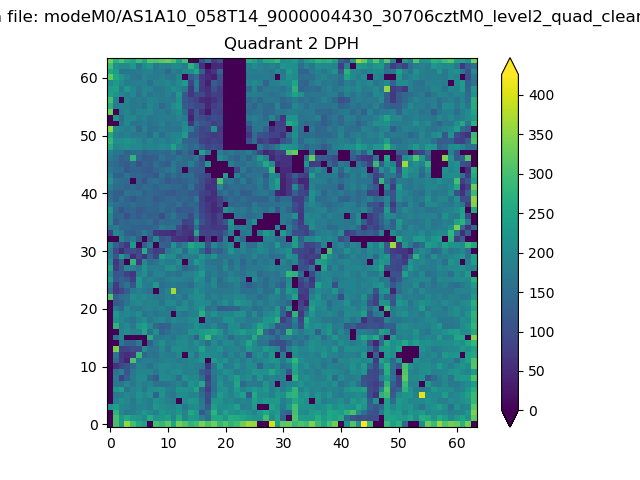 |
Quadrant C |
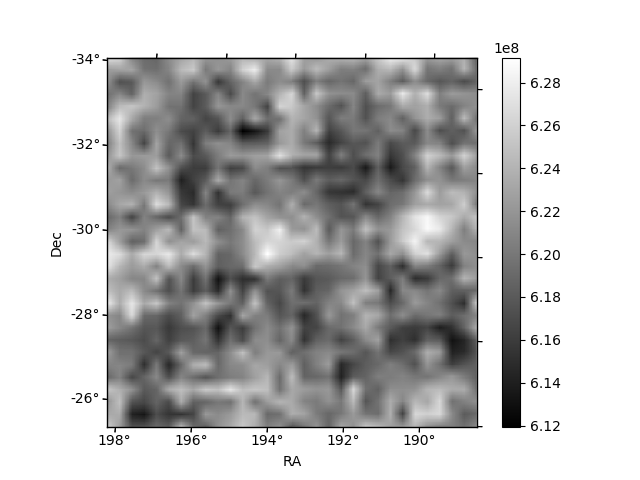
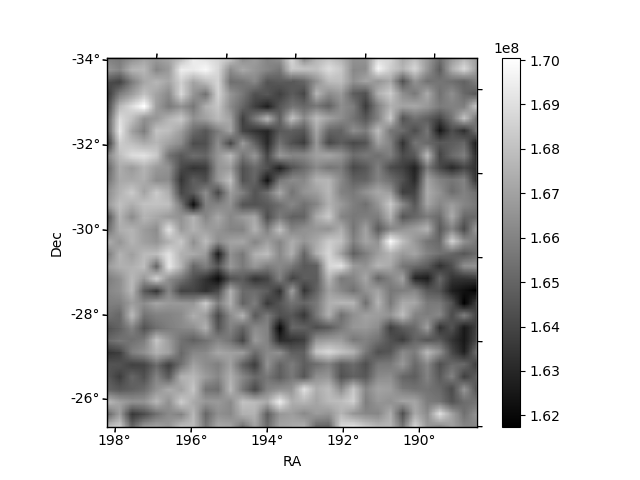
| Plot type | Count rate plots | Images |
|---|---|---|
| Comparison with Poisson distribution Blue bars denote a histogram of data divided into 1 sec bins. Red curve is a Poisson curve with rate = median count rate of data. |
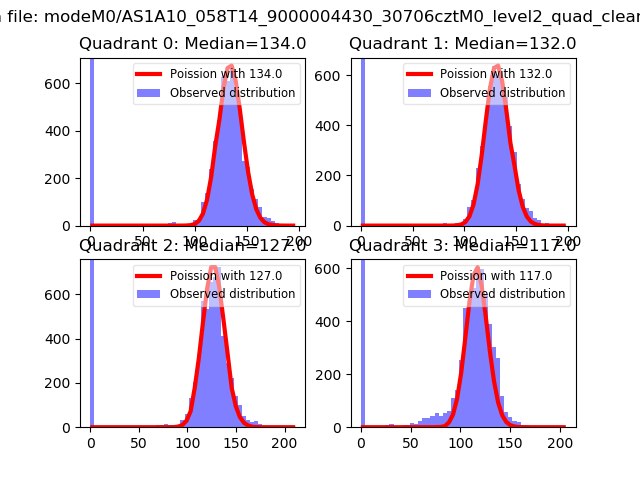 |
 |
| Quadrant-wise count rates Data is divided into 100 sec bins |
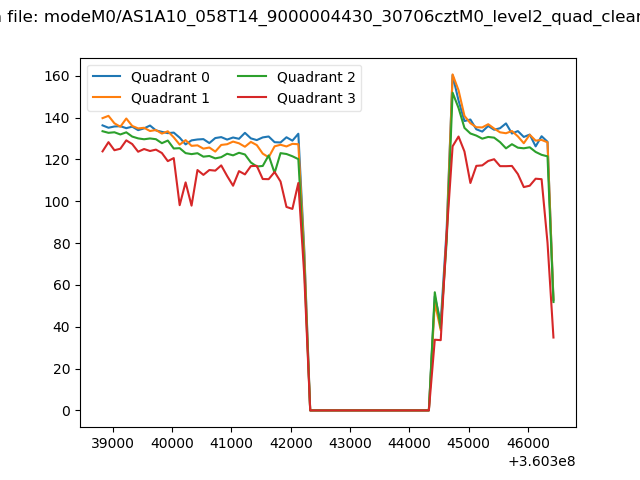 |
|
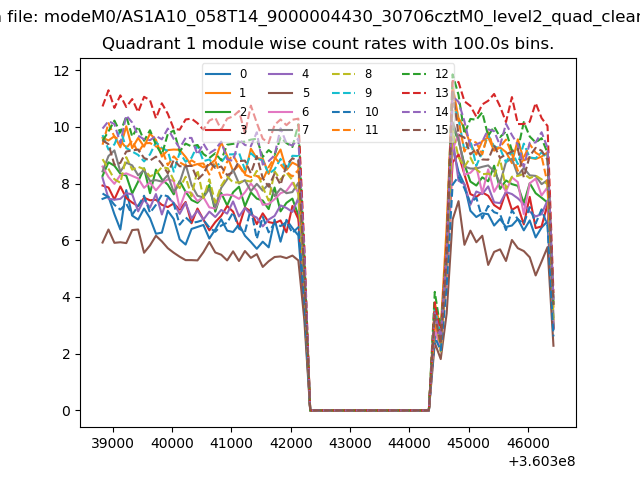
| Module-wise count rates for Quadrant A Data is divided into 100 sec bins |
 |
 |
| Module-wise count rates for Quadrant B Data is divided into 100 sec bins |
 |
 |
| Module-wise count rates for Quadrant C Data is divided into 100 sec bins |
 |
 |
| Module-wise count rates for Quadrant D Data is divided into 100 sec bins |
 |
 |
| Parameter | Plot |
|---|---|
| CZT HV Monitor | 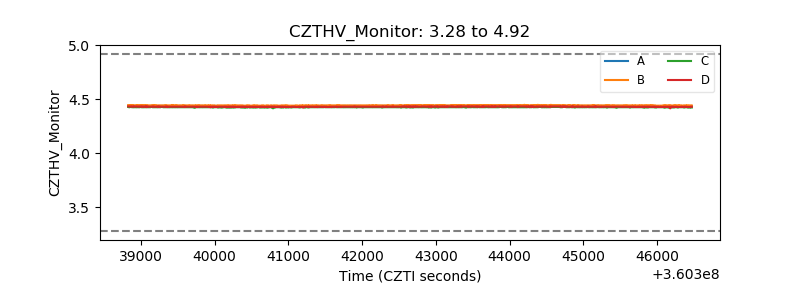 |
| D_VDD | 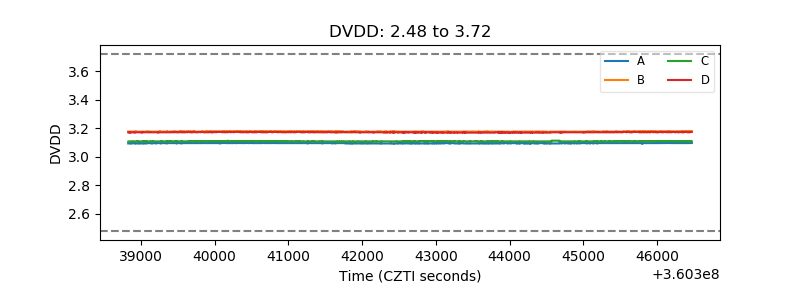 |
| Temperature 1 |  |
| Veto HV Monitor | 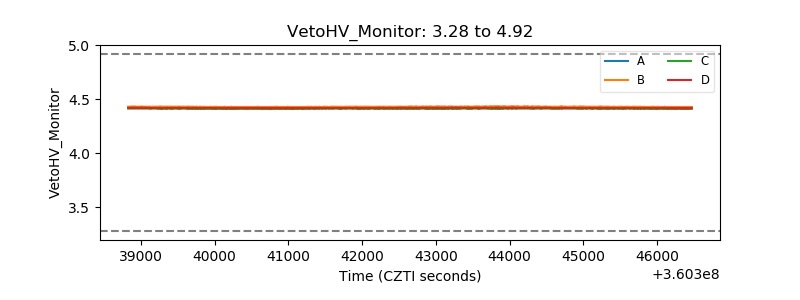 |
| Veto LLD |  |
| Alpha Counter | 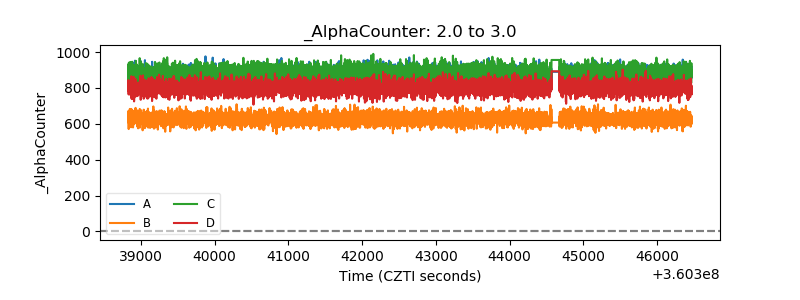 |
| _CPM_Rate | 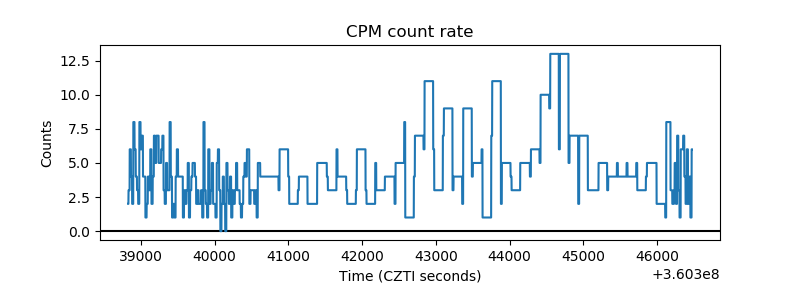 |
| CZT Counter | 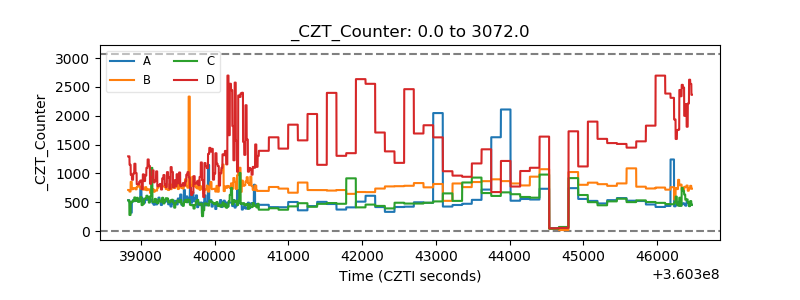 |
| +2.5 Volts monitor |  |
| +5 Volts monitor |  |
| _ROLL_ROT | 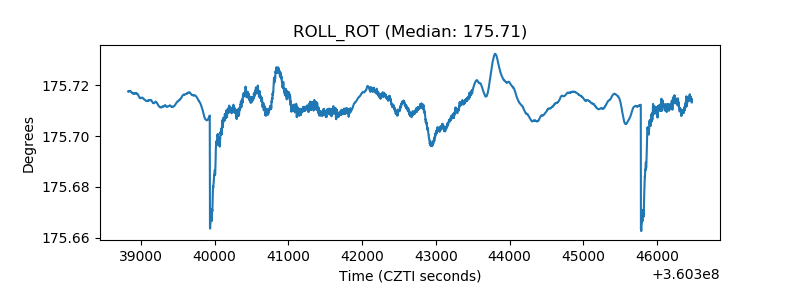 |
| _Roll_DEC | 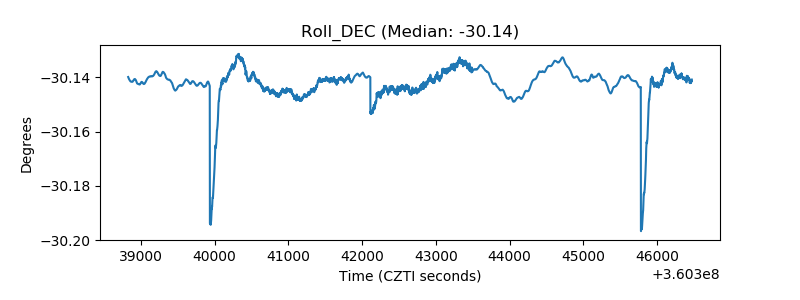 |
| _Roll_RA | 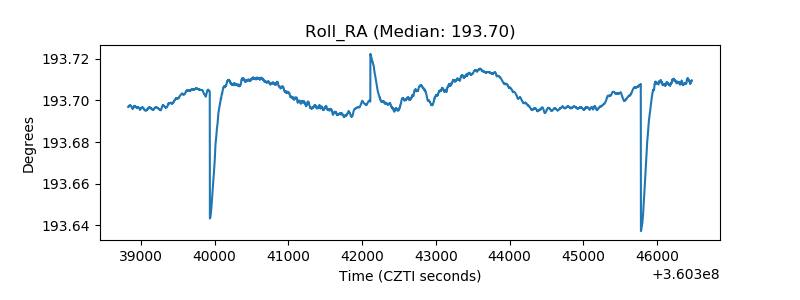 |
| Veto Counter |  |