| Param | Original file | Final file |
|---|---|---|
| Filename | modeM0/AS1A10_094T82_9000004428cztM0_level2.fits | modeM0/AS1A10_094T82_9000004428cztM0_level2_quad_clean.evt |
| Size (bytes) | 48,738,240 | 25,853,760 |
| Size | 46.5 MB | 24.7 MB |
| Events in quadrant A | 323,932 | 137,179 |
| Events in quadrant B | 293,816 | 131,576 |
| Events in quadrant C | 307,614 | 130,039 |
| Events in quadrant D | 257,562 | 90,730 |
| Mode M0 | |||
|---|---|---|---|
| Quadrant | BADHDUFLAG | Total packets | Discarded packets |
| A | 0 | 9815 | 0 |
| B | 0 | 13016 | 0 |
| C | 0 | 10278 | 0 |
| D | 0 | 17777 | 0 |
| Mode SS | |||
|---|---|---|---|
| Quadrant | BADHDUFLAG | Total packets | Discarded packets |
| A | 0 | 80 | 0 |
| B | 0 | 76 | 0 |
| C | 0 | 72 | 0 |
| D | 0 | 79 | 0 |
| Mode M9 | |||
|---|---|---|---|
| Quadrant | BADHDUFLAG | Total packets | Discarded packets |
| A | 0 | 18 | 0 |
| B | 0 | 18 | 0 |
| C | 0 | 18 | 0 |
| D | 0 | 18 | 0 |
| Quadrant | Total seconds | Saturated seconds | Saturation percentage |
|---|---|---|---|
| A | 4209 | 84 | 1.995723% |
| B | 4161 | 132 | 3.172314% |
| C | 4213 | 220 | 5.221932% |
| D | 4125 | 570 | 13.818182% |
Noise dominated data is calculated using 1-second bins in cleaned event files. If a bin has >2000 counts, and if more than 50% of those come from <1% of pixels, then it is considered to be noise-dominated and hence unusable.
| Quadrant | # 1 sec bins | Bins with >0 counts | Bins with >2000 counts | High rate bins dominated by noise | Noise dominated (total time) | Noise dominated (detector-on time) | Marked lightcurve |
|---|---|---|---|---|---|---|---|
| A | 22097 | 4426 | 0 | 0 | 0.00% | 0.00% | 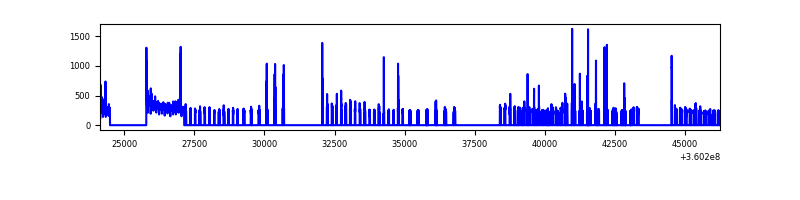 |
| B | 22097 | 4365 | 0 | 0 | 0.00% | 0.00% |  |
| C | 22099 | 4421 | 0 | 0 | 0.00% | 0.00% | 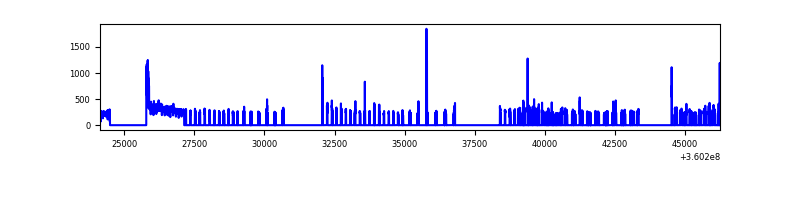 |
| D | 22097 | 4293 | 0 | 0 | 0.00% | 0.00% | 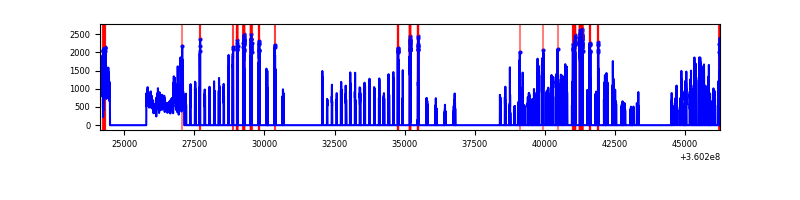 |
Top three noisy pixels from each quadrant. If the there are fewer than three noisy pixels in the level2.evt file, extra rows are filled as -1
| Pixel properties | Quadrant properties | ||||||
|---|---|---|---|---|---|---|---|
| Quadrant | DetID | PixID | Counts | Sigma | Mean | Median | Sigma |
| A | 7 | 110 | 262 | 8.25 | 84 | 80 | 22.1 |
| A | 0 | 29 | 262 | 8.25 | 84 | 80 | 22.1 |
| A | 14 | 79 | 251 | 7.75 | 84 | 80 | 22.1 |
| B | 2 | 9 | 239 | 9.52 | 77 | 75 | 17.2 |
| B | 2 | 8 | 194 | 6.91 | 77 | 75 | 17.2 |
| B | 3 | 80 | 189 | 6.62 | 77 | 75 | 17.2 |
| C | 3 | 203 | 243 | 7.54 | 81 | 77 | 22.0 |
| C | 3 | 202 | 243 | 7.54 | 81 | 77 | 22.0 |
| C | 3 | 126 | 222 | 6.59 | 81 | 77 | 22.0 |
| D | 6 | 67 | 214 | 7.08 | 73 | 67 | 20.8 |
| D | 15 | 46 | 201 | 6.46 | 73 | 67 | 20.8 |
| D | 4 | 246 | 193 | 6.07 | 73 | 67 | 20.8 |
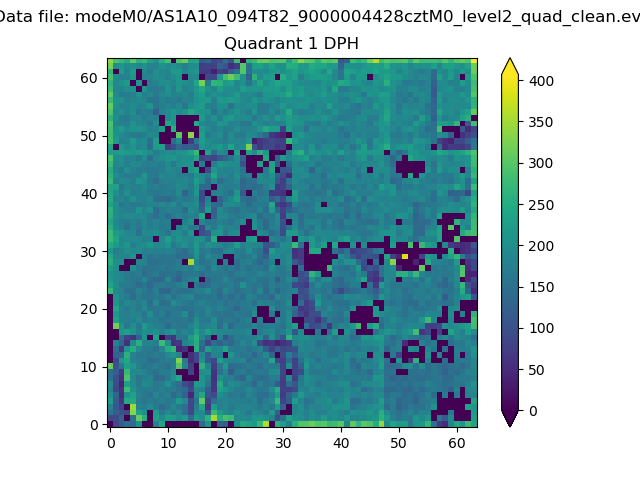
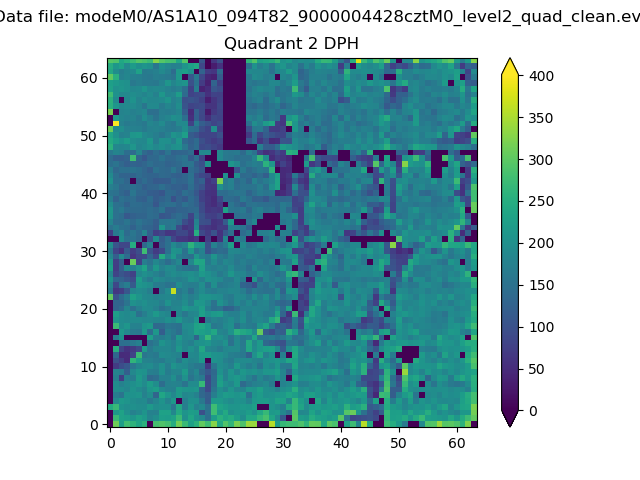
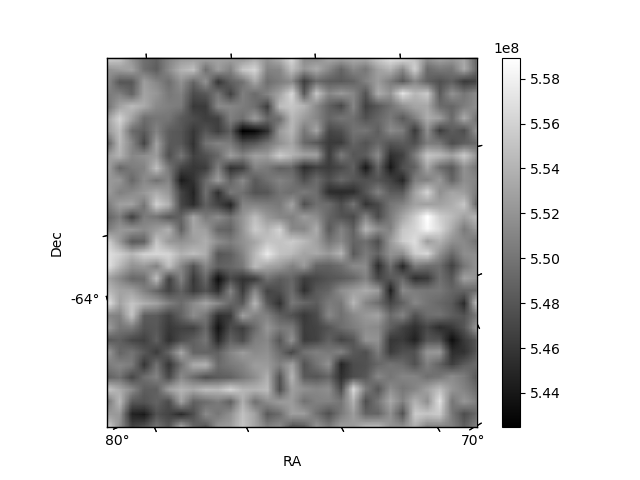
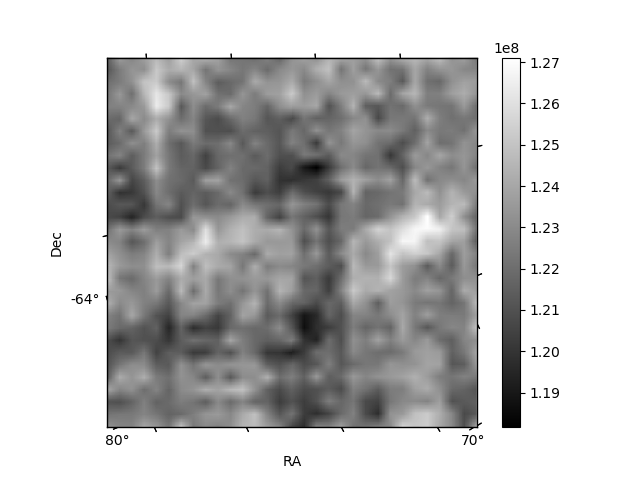
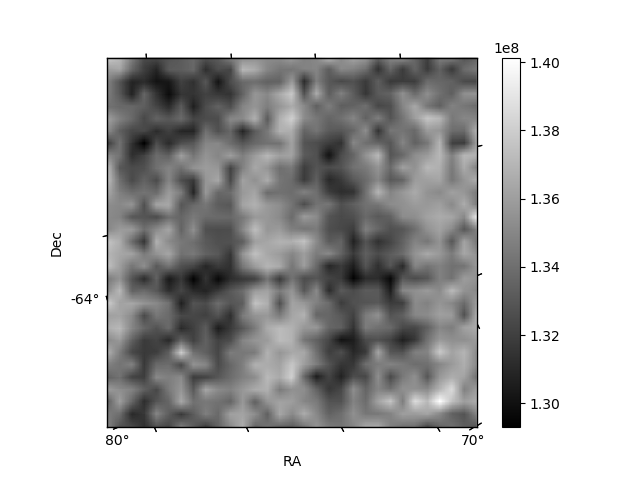
Histogram calculated using DETX and DETY for each event in the final _common_clean file
| Quadrant A | 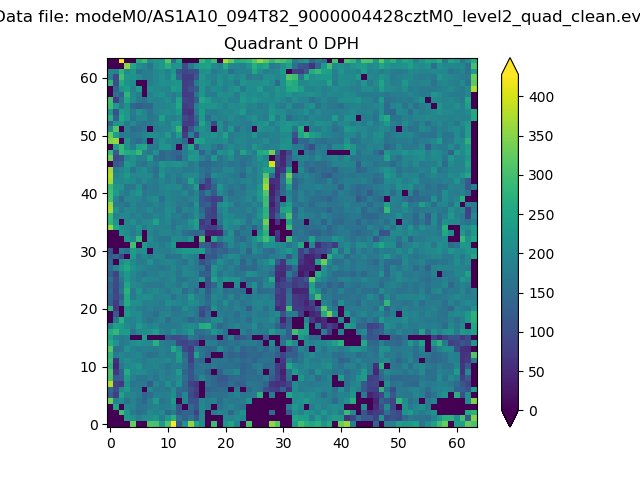 |
 |
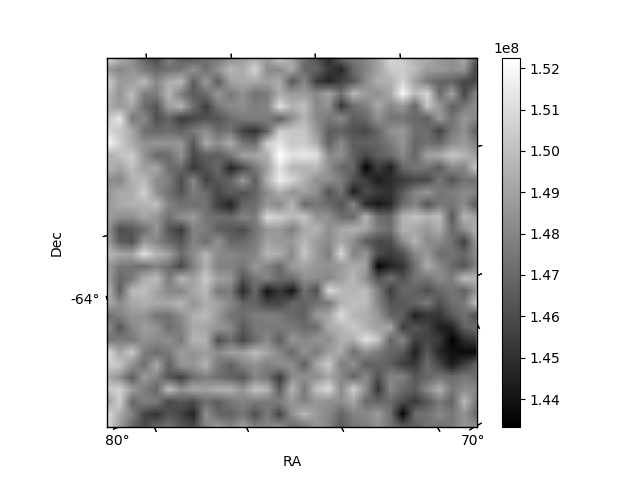
Quadrant B |
|---|---|---|---|
| Quadrant D | 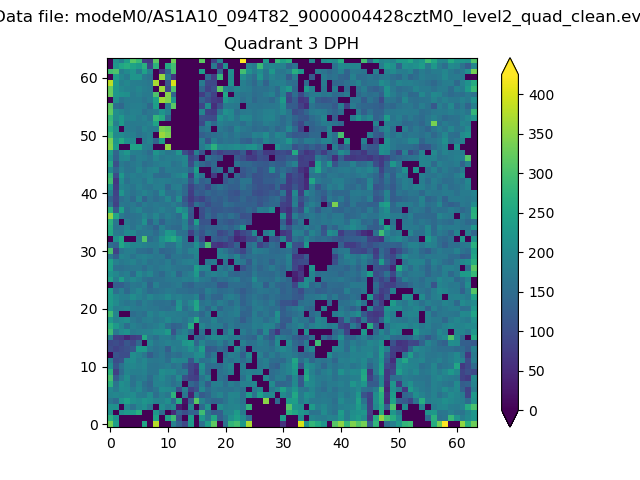 |
 |
Quadrant C |
| Plot type | Count rate plots | Images |
|---|---|---|
| Comparison with Poisson distribution Blue bars denote a histogram of data divided into 1 sec bins. Red curve is a Poisson curve with rate = median count rate of data. |
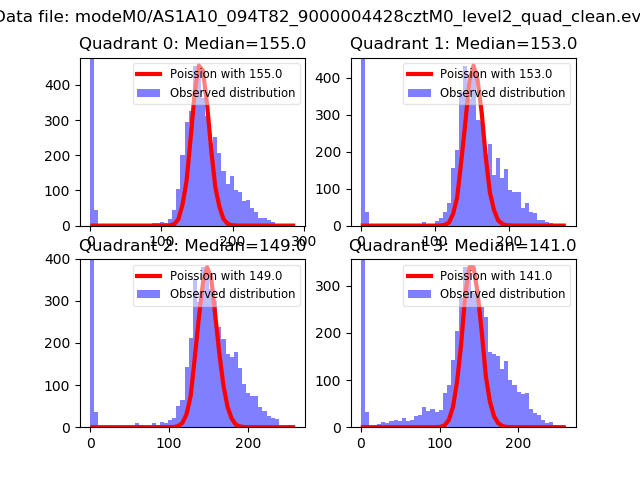 |
 |
| Quadrant-wise count rates Data is divided into 100 sec bins |
 |
|
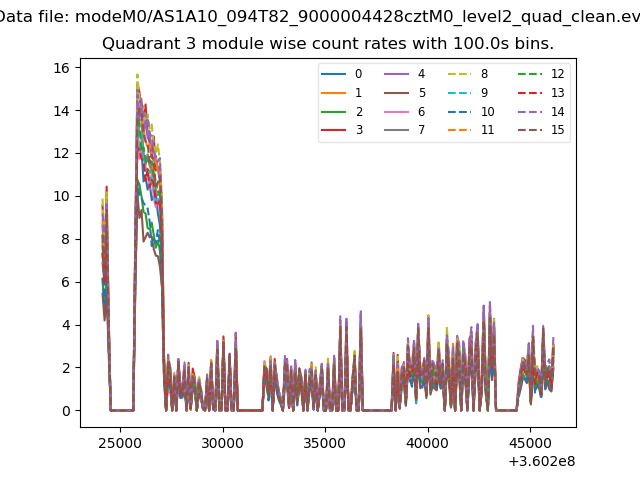
| Module-wise count rates for Quadrant A Data is divided into 100 sec bins |
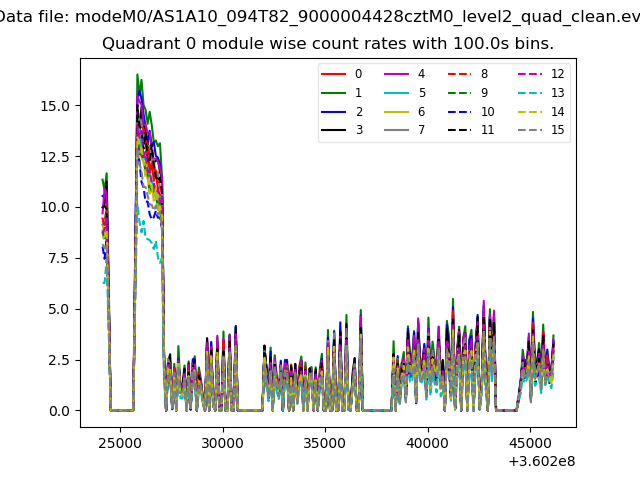 |
 |
| Module-wise count rates for Quadrant B Data is divided into 100 sec bins |
 |
 |
| Module-wise count rates for Quadrant C Data is divided into 100 sec bins |
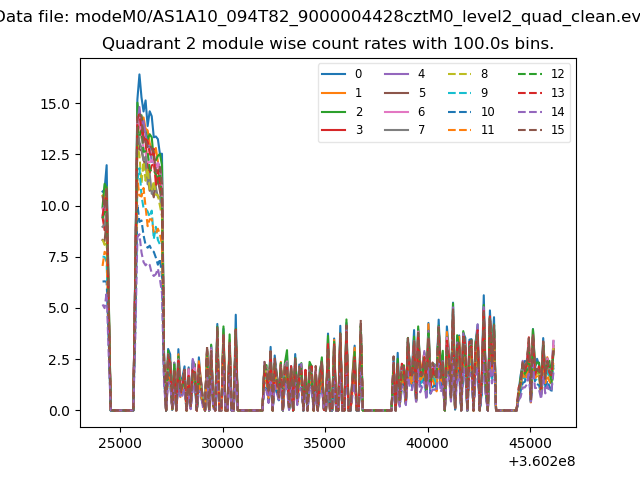 |
 |
| Module-wise count rates for Quadrant D Data is divided into 100 sec bins |
 |
 |
| Parameter | Plot |
|---|---|
| CZT HV Monitor |  |
| D_VDD | 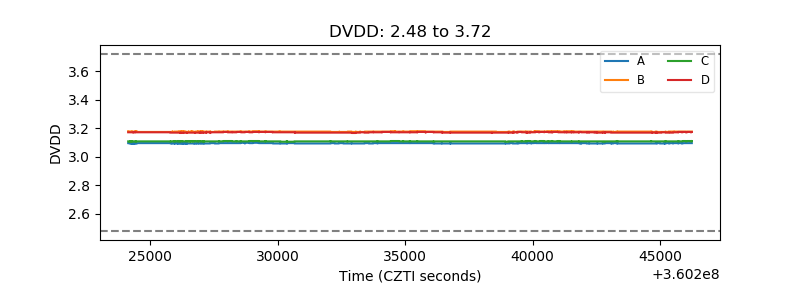 |
| Temperature 1 | 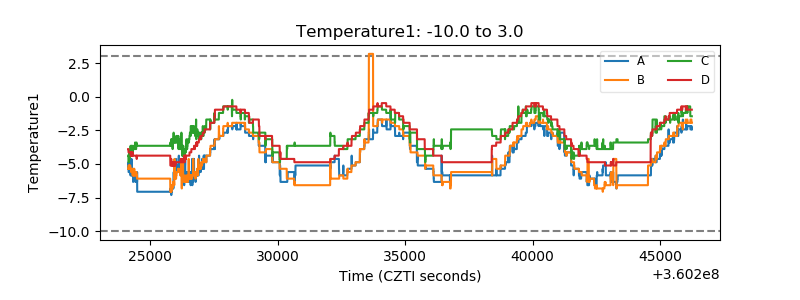 |
| Veto HV Monitor |  |
| Veto LLD | 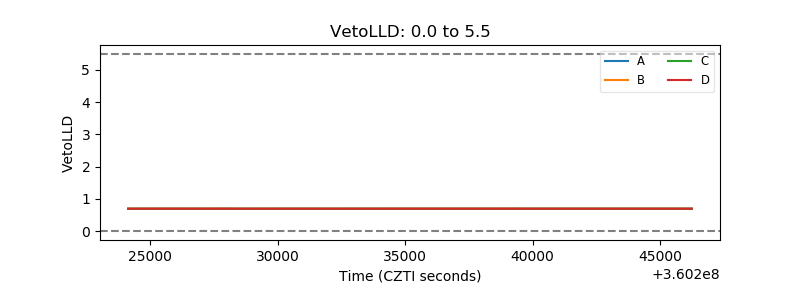 |
| Alpha Counter |  |
| _CPM_Rate | 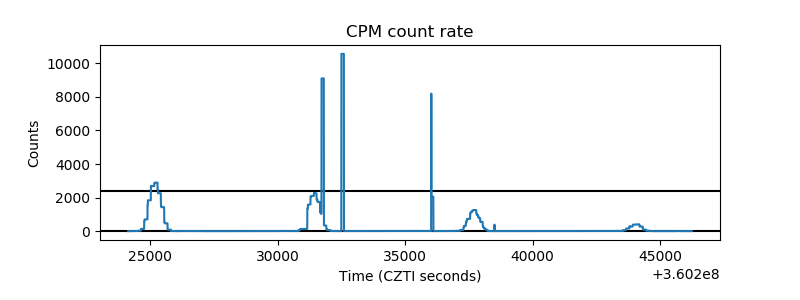 |
| CZT Counter |  |
| +2.5 Volts monitor |  |
| +5 Volts monitor |  |
| _ROLL_ROT | 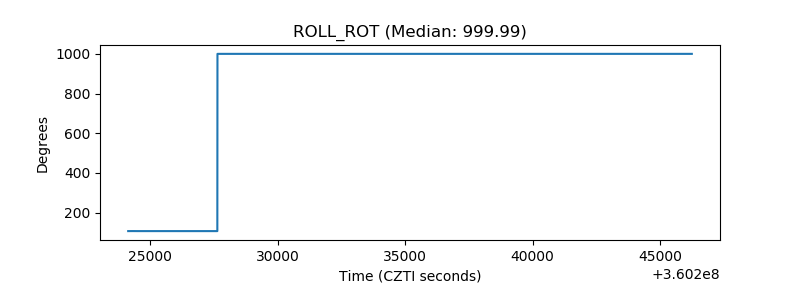 |
| _Roll_DEC | 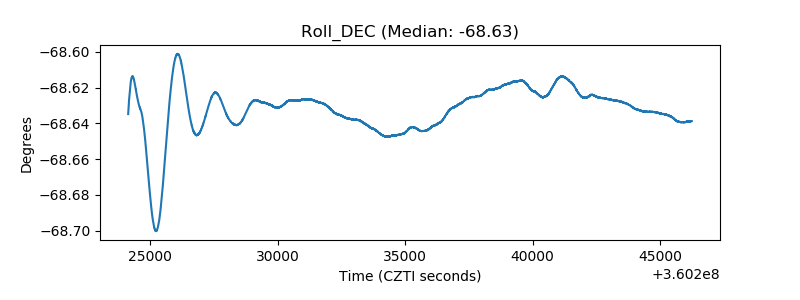 |
| _Roll_RA |  |
| Veto Counter | 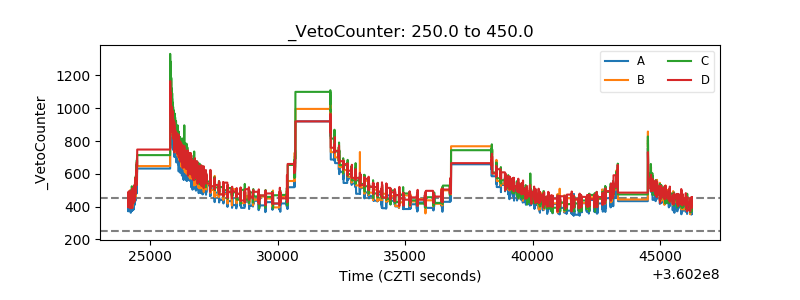 |