| Param | Original file | Final file |
|---|---|---|
| Filename | modeM0/AS1A10_094T82_9000004428_30686cztM0_level2.evt | modeM0/AS1A10_094T82_9000004428_30686cztM0_level2_quad_clean.evt |
| Size (bytes) | 188,438,400 | 43,974,720 |
| Size | 179.7 MB | 41.9 MB |
| Events in quadrant A | 1,064,419 | 312,172 |
| Events in quadrant B | 1,497,939 | 311,294 |
| Events in quadrant C | 1,115,767 | 299,956 |
| Events in quadrant D | 1,911,276 | 283,078 |
| Mode M0 | |||
|---|---|---|---|
| Quadrant | BADHDUFLAG | Total packets | Discarded packets |
| A | 0 | 4342 | 1 |
| B | 0 | 5429 | 1 |
| C | 0 | 4596 | 1 |
| D | 0 | 6856 | 1 |
| Mode SS | |||
|---|---|---|---|
| Quadrant | BADHDUFLAG | Total packets | Discarded packets |
| A | 0 | 36 | 0 |
| B | 0 | 36 | 0 |
| C | 0 | 36 | 0 |
| D | 0 | 36 | 0 |
| Mode M9 | |||
|---|---|---|---|
| Quadrant | BADHDUFLAG | Total packets | Discarded packets |
| A | 0 | 13 | 0 |
| B | 0 | 13 | 0 |
| C | 0 | 13 | 0 |
| D | 0 | 13 | 0 |
| Quadrant | Total seconds | Saturated seconds | Saturation percentage |
|---|---|---|---|
| A | 1703 | 44 | 2.583676% |
| B | 1703 | 72 | 4.227833% |
| C | 1703 | 106 | 6.224310% |
| D | 1703 | 209 | 12.272460% |
Noise dominated data is calculated using 1-second bins in cleaned event files. If a bin has >2000 counts, and if more than 50% of those come from <1% of pixels, then it is considered to be noise-dominated and hence unusable.
| Quadrant | # 1 sec bins | Bins with >0 counts | Bins with >2000 counts | High rate bins dominated by noise | Noise dominated (total time) | Noise dominated (detector-on time) | Marked lightcurve |
|---|---|---|---|---|---|---|---|
| A | 2998 | 1704 | 0 | 0 | 0.00% | 0.00% | 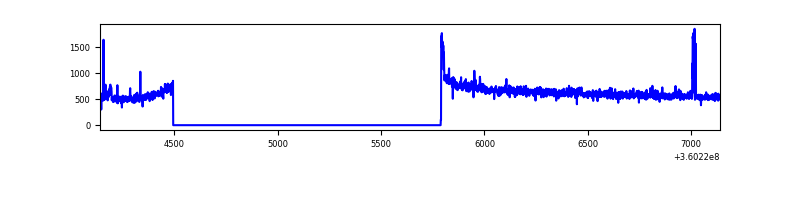 |
| B | 2998 | 1704 | 1 | 1 | 0.03% | 0.06% | 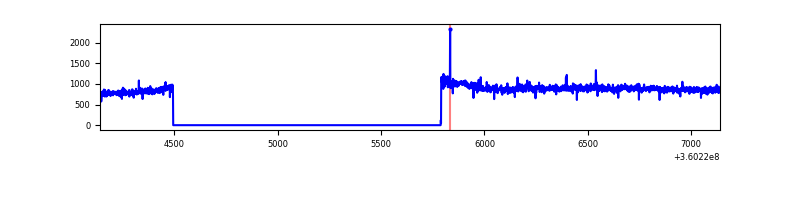 |
| C | 2998 | 1704 | 0 | 0 | 0.00% | 0.00% | 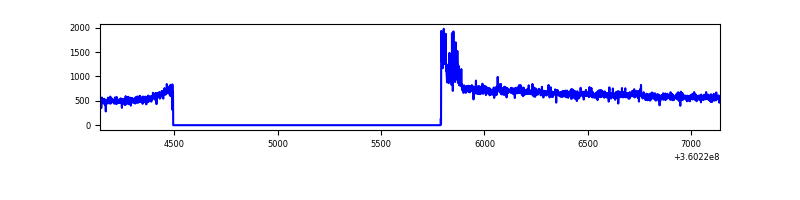 |
| D | 2998 | 1704 | 126 | 126 | 4.20% | 7.39% | 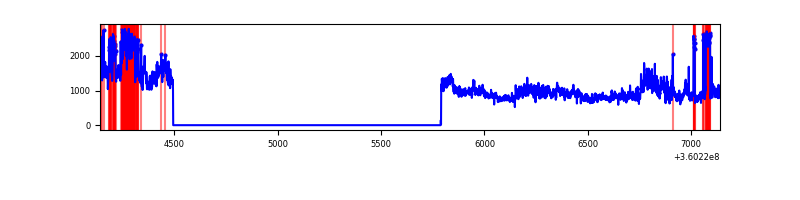 |
Top three noisy pixels from each quadrant. If the there are fewer than three noisy pixels in the level2.evt file, extra rows are filled as -1
| Pixel properties | Quadrant properties | ||||||
|---|---|---|---|---|---|---|---|
| Quadrant | DetID | PixID | Counts | Sigma | Mean | Median | Sigma |
| A | 0 | 13 | 27453 | 505.49 | 266 | 261 | 53.8 |
| A | 8 | 192 | 11039 | 200.36 | 266 | 261 | 53.8 |
| A | 13 | 254 | 3067 | 52.16 | 266 | 261 | 53.8 |
| B | 6 | 159 | 460410 | 9312.71 | 261 | 254 | 49.4 |
| B | 12 | 111 | 5541 | 107.0 | 261 | 254 | 49.4 |
| B | 6 | 36 | 5319 | 102.51 | 261 | 254 | 49.4 |
| C | 0 | 10 | 49137 | 810.7 | 257 | 259 | 60.3 |
| C | 14 | 238 | 42876 | 706.85 | 257 | 259 | 60.3 |
| C | 3 | 233 | 15304 | 249.54 | 257 | 259 | 60.3 |
| D | 8 | 195 | 684022 | 11348.8 | 255 | 250 | 60.3 |
| D | 1 | 52 | 128754 | 2132.83 | 255 | 250 | 60.3 |
| D | 2 | 250 | 121923 | 2019.45 | 255 | 250 | 60.3 |
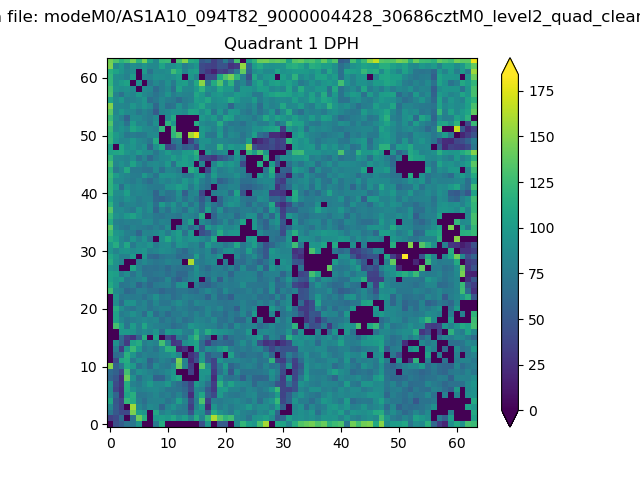
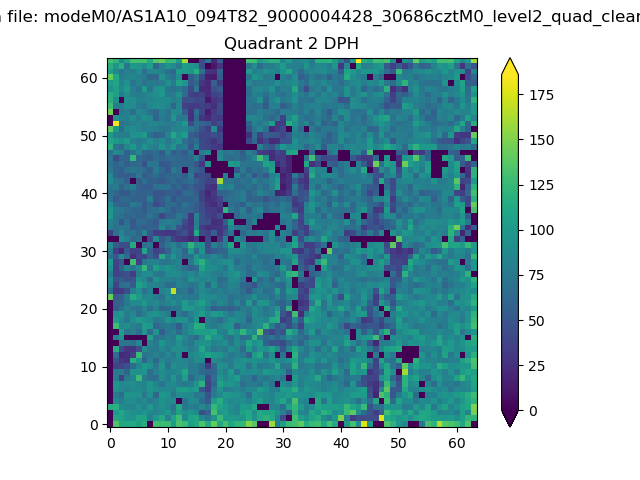
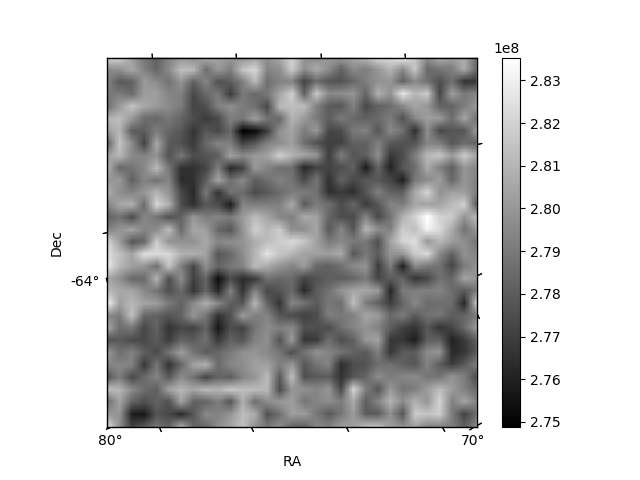
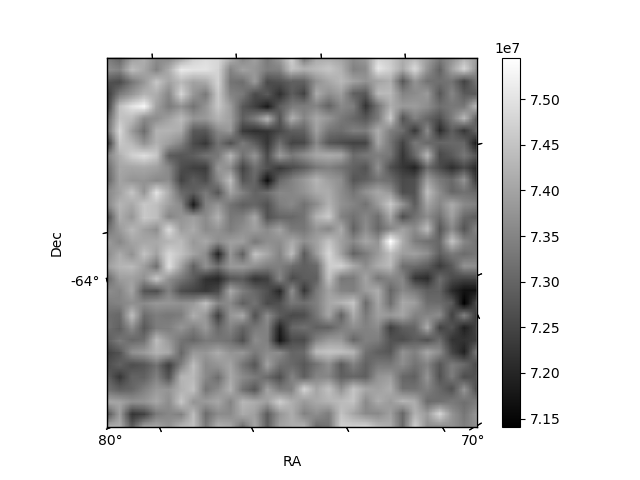
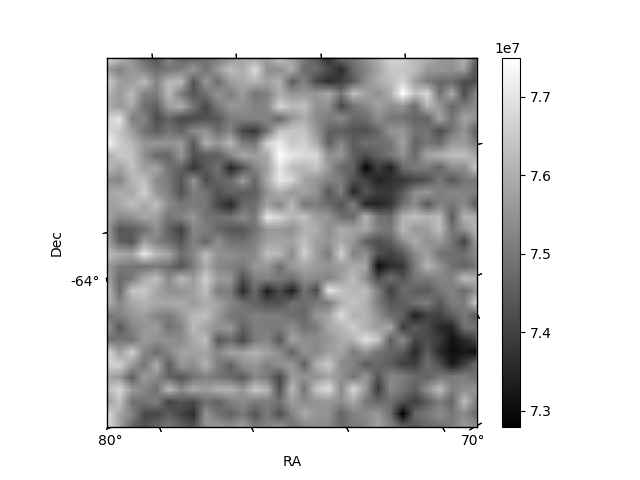
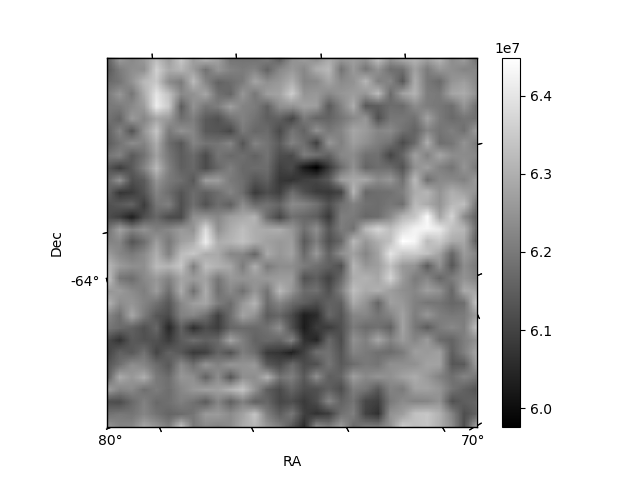
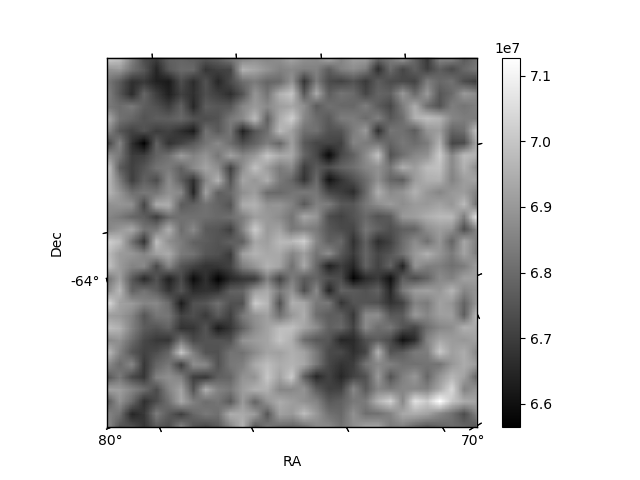
Histogram calculated using DETX and DETY for each event in the final _common_clean file
| Quadrant A |  |
 |
Quadrant B |
|---|---|---|---|
| Quadrant D | 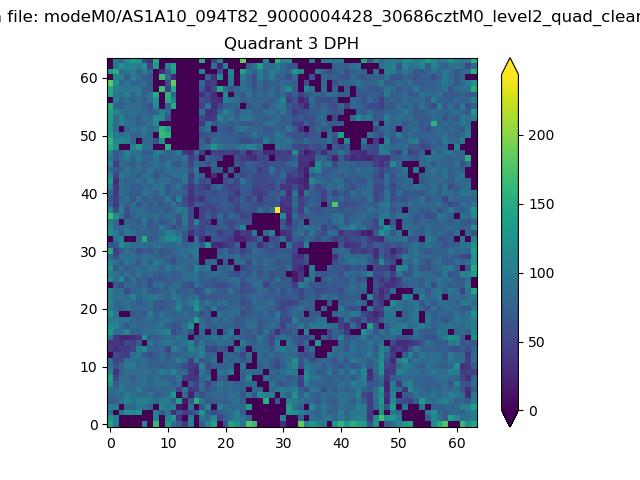 |
 |
Quadrant C |
| Plot type | Count rate plots | Images |
|---|---|---|
| Comparison with Poisson distribution Blue bars denote a histogram of data divided into 1 sec bins. Red curve is a Poisson curve with rate = median count rate of data. |
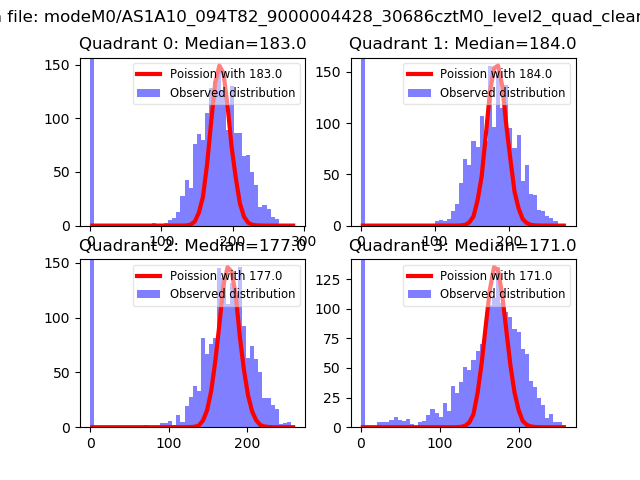 |
 |
| Quadrant-wise count rates Data is divided into 100 sec bins |
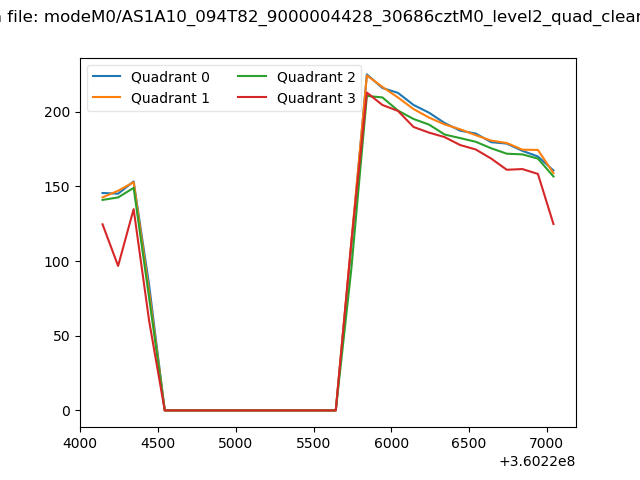 |
|
| Module-wise count rates for Quadrant A Data is divided into 100 sec bins |
 |
 |
| Module-wise count rates for Quadrant B Data is divided into 100 sec bins |
 |
 |
| Module-wise count rates for Quadrant C Data is divided into 100 sec bins |
 |
 |
| Module-wise count rates for Quadrant D Data is divided into 100 sec bins |
 |
 |
| Parameter | Plot |
|---|---|
| CZT HV Monitor | 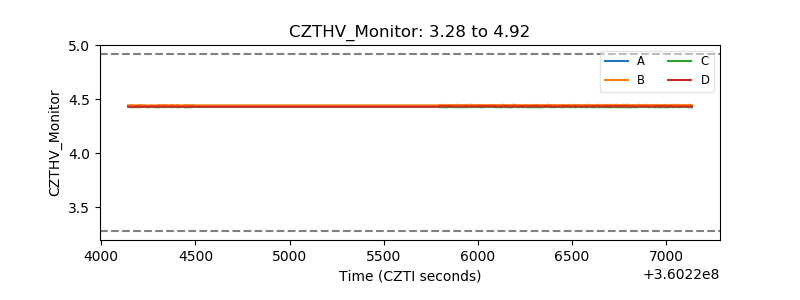 |
| D_VDD | 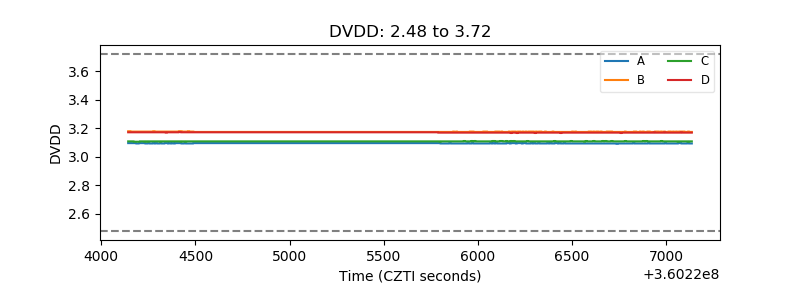 |
| Temperature 1 | 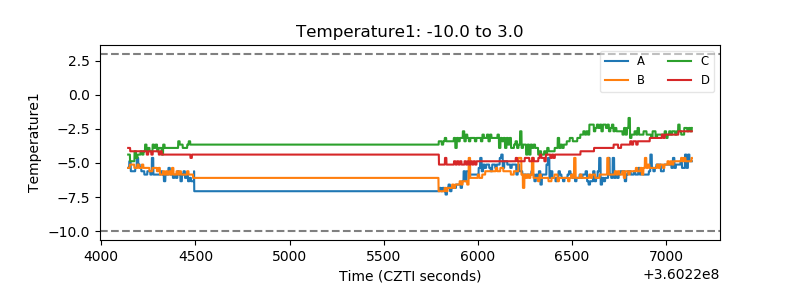 |
| Veto HV Monitor | 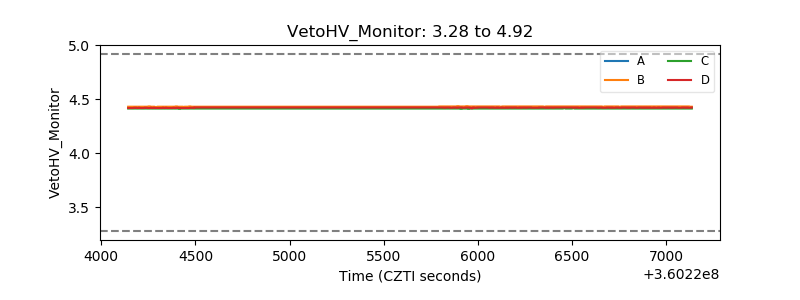 |
| Veto LLD | 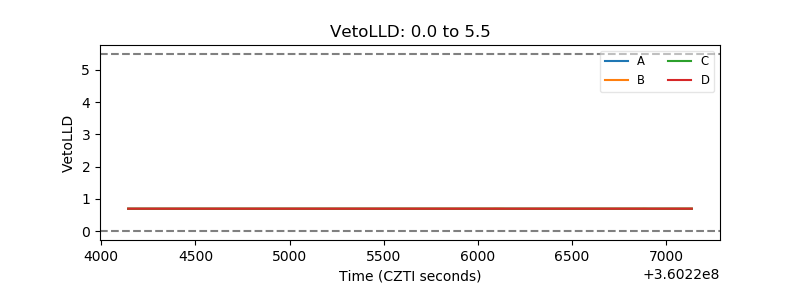 |
| Alpha Counter | 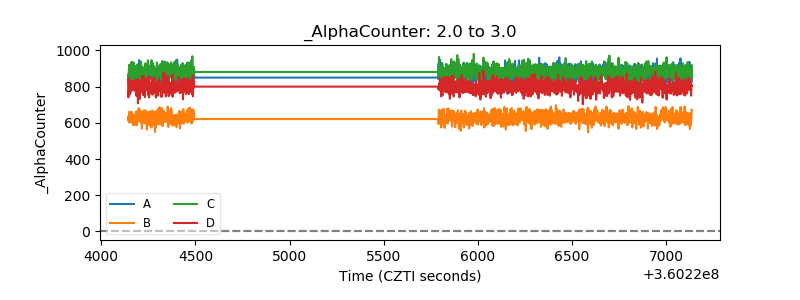 |
| _CPM_Rate | 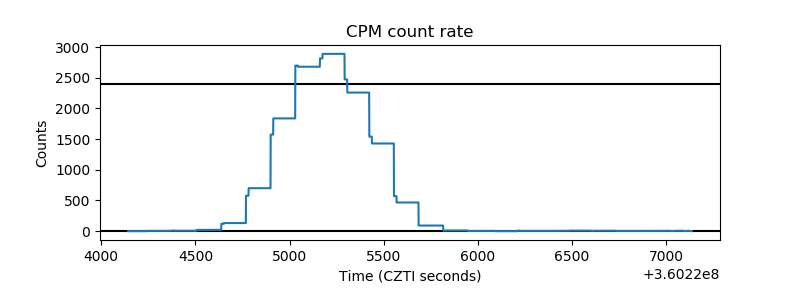 |
| CZT Counter | 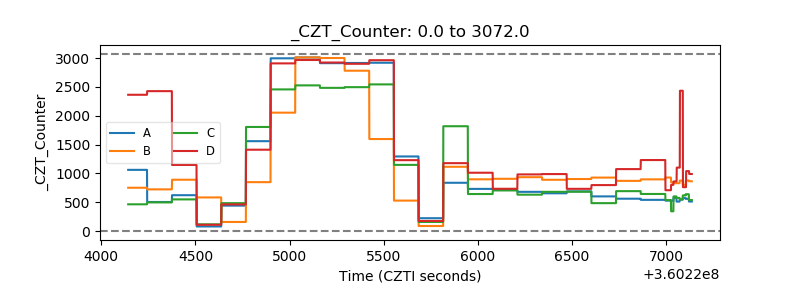 |
| +2.5 Volts monitor | 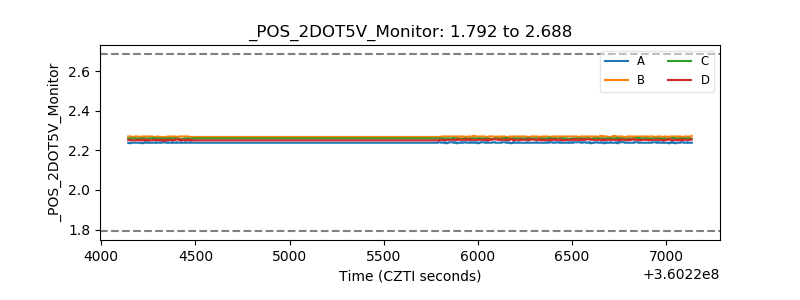 |
| +5 Volts monitor |  |
| _ROLL_ROT | 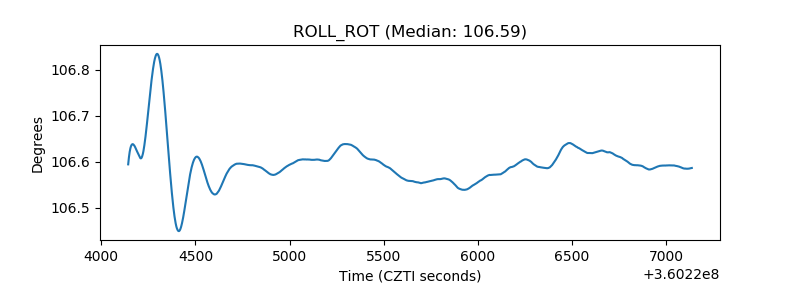 |
| _Roll_DEC |  |
| _Roll_RA | 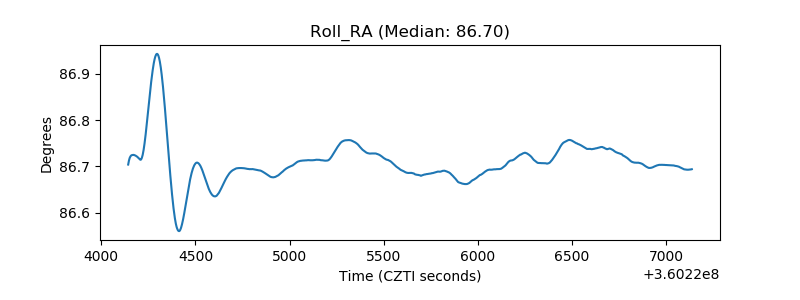 |
| Veto Counter | 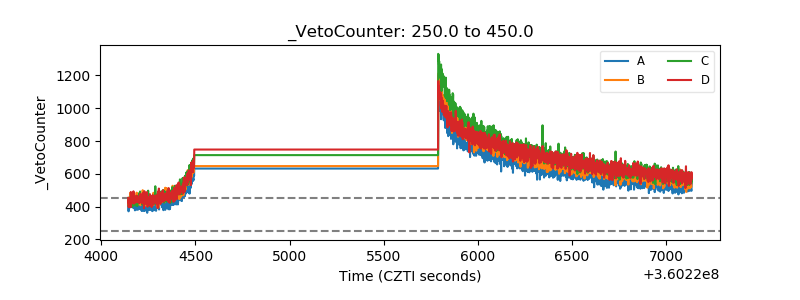 |