| Param | Original file | Final file |
|---|---|---|
| Filename | modeM0/AS1A10_071T44_9000004434cztM0_level2.fits | modeM0/AS1A10_071T44_9000004434cztM0_level2_quad_clean.evt |
| Size (bytes) | 655,358,400 | 466,067,520 |
| Size | 625.0 MB | 444.5 MB |
| Events in quadrant A | 4,216,252 | 2,634,474 |
| Events in quadrant B | 3,919,212 | 2,573,247 |
| Events in quadrant C | 3,938,568 | 2,418,793 |
| Events in quadrant D | 3,445,112 | 2,159,834 |
| Mode SS | |||
|---|---|---|---|
| Quadrant | BADHDUFLAG | Total packets | Discarded packets |
| A | 0 | 1282 | 0 |
| B | 0 | 1282 | 0 |
| C | 0 | 1282 | 0 |
| D | 0 | 1282 | 0 |
| Mode M0 | |||
|---|---|---|---|
| Quadrant | BADHDUFLAG | Total packets | Discarded packets |
| A | 0 | 148167 | 0 |
| B | 0 | 200248 | 0 |
| C | 0 | 158484 | 0 |
| D | 0 | 229514 | 0 |
| Mode M9 | |||
|---|---|---|---|
| Quadrant | BADHDUFLAG | Total packets | Discarded packets |
| A | 0 | 102 | 0 |
| B | 0 | 102 | 0 |
| C | 0 | 102 | 0 |
| D | 0 | 102 | 0 |
| Quadrant | Total seconds | Saturated seconds | Saturation percentage |
|---|---|---|---|
| A | 63069 | 1760 | 2.790594% |
| B | 63067 | 2617 | 4.149555% |
| C | 63068 | 3072 | 4.870933% |
| D | 63069 | 4313 | 6.838542% |
Noise dominated data is calculated using 1-second bins in cleaned event files. If a bin has >2000 counts, and if more than 50% of those come from <1% of pixels, then it is considered to be noise-dominated and hence unusable.
| Quadrant | # 1 sec bins | Bins with >0 counts | Bins with >2000 counts | High rate bins dominated by noise | Noise dominated (total time) | Noise dominated (detector-on time) | Marked lightcurve |
|---|---|---|---|---|---|---|---|
| A | 73244 | 63053 | 0 | 0 | 0.00% | 0.00% | 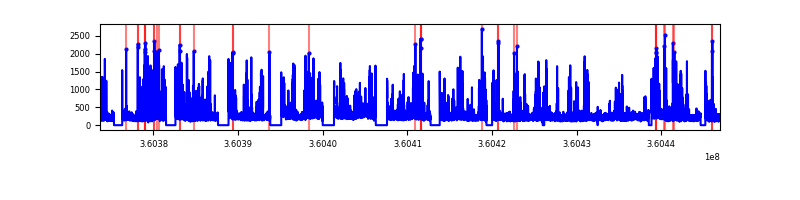 |
| B | 73244 | 63050 | 0 | 0 | 0.00% | 0.00% |  |
| C | 73244 | 63049 | 0 | 0 | 0.00% | 0.00% |  |
| D | 73244 | 63031 | 0 | 0 | 0.00% | 0.00% |  |
Top three noisy pixels from each quadrant. If the there are fewer than three noisy pixels in the level2.evt file, extra rows are filled as -1
| Pixel properties | Quadrant properties | ||||||
|---|---|---|---|---|---|---|---|
| Quadrant | DetID | PixID | Counts | Sigma | Mean | Median | Sigma |
| A | 0 | 29 | 3446 | 9.08 | 1099 | 1036 | 265.4 |
| A | 7 | 110 | 3255 | 8.36 | 1099 | 1036 | 265.4 |
| A | 9 | 19 | 3108 | 7.81 | 1099 | 1036 | 265.4 |
| B | 2 | 9 | 3164 | 10.63 | 1037 | 992 | 204.3 |
| B | 5 | 225 | 2584 | 7.79 | 1037 | 992 | 204.3 |
| B | 2 | 8 | 2558 | 7.66 | 1037 | 992 | 204.3 |
| C | 9 | 209 | 2687 | 6.49 | 1043 | 978 | 263.1 |
| C | 12 | 241 | 2657 | 6.38 | 1043 | 978 | 263.1 |
| C | 3 | 126 | 2644 | 6.33 | 1043 | 978 | 263.1 |
| D | 15 | 46 | 2557 | 6.41 | 984 | 900 | 258.4 |
| D | 7 | 3 | 2399 | 5.8 | 984 | 900 | 258.4 |
| D | 10 | 189 | 2386 | 5.75 | 984 | 900 | 258.4 |
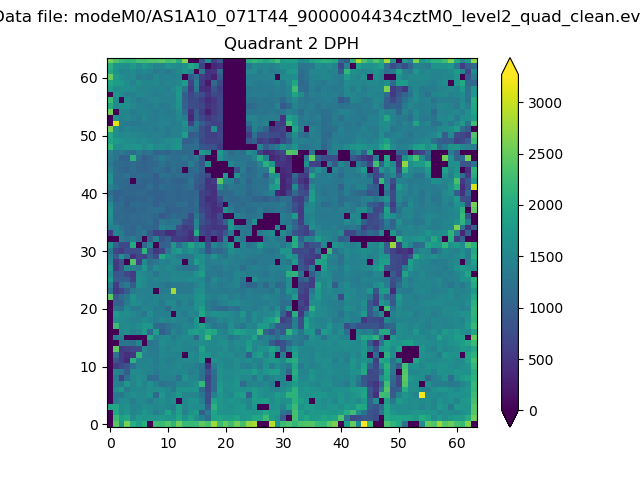
Histogram calculated using DETX and DETY for each event in the final _common_clean file
| Quadrant A | 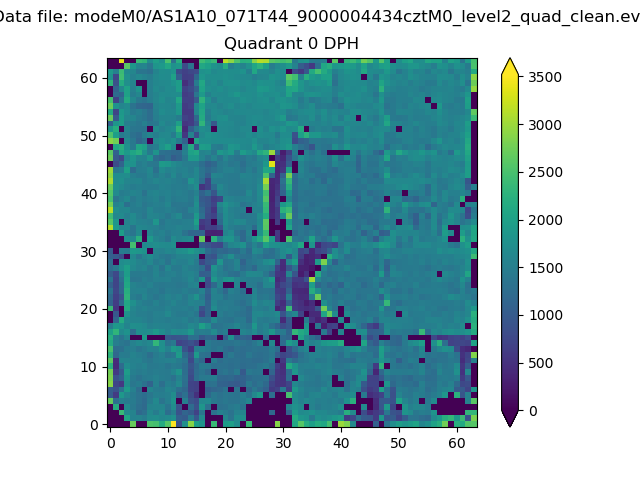 |
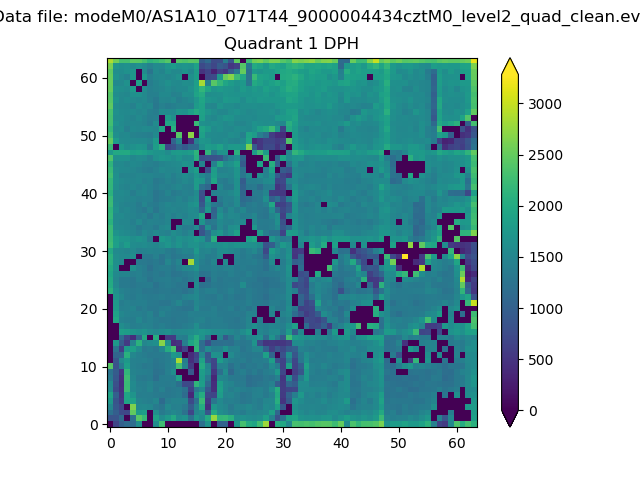 |
Quadrant B |
|---|---|---|---|
| Quadrant D | 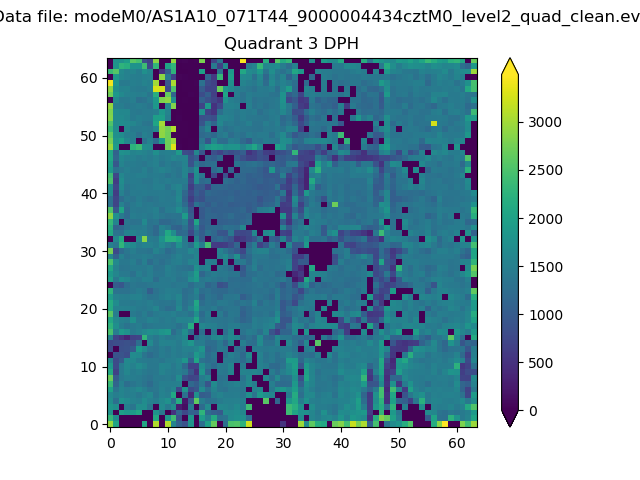 |
 |
Quadrant C |
| Plot type | Count rate plots | Images |
|---|---|---|
| Comparison with Poisson distribution Blue bars denote a histogram of data divided into 1 sec bins. Red curve is a Poisson curve with rate = median count rate of data. |
 |
 |
| Quadrant-wise count rates Data is divided into 100 sec bins |
 |
|
| Module-wise count rates for Quadrant A Data is divided into 100 sec bins |
 |
 |
| Module-wise count rates for Quadrant B Data is divided into 100 sec bins |
 |
 |
| Module-wise count rates for Quadrant C Data is divided into 100 sec bins |
 |
 |
| Module-wise count rates for Quadrant D Data is divided into 100 sec bins |
 |
 |
| Parameter | Plot |
|---|---|
| CZT HV Monitor |  |
| D_VDD |  |
| Temperature 1 |  |
| Veto HV Monitor | 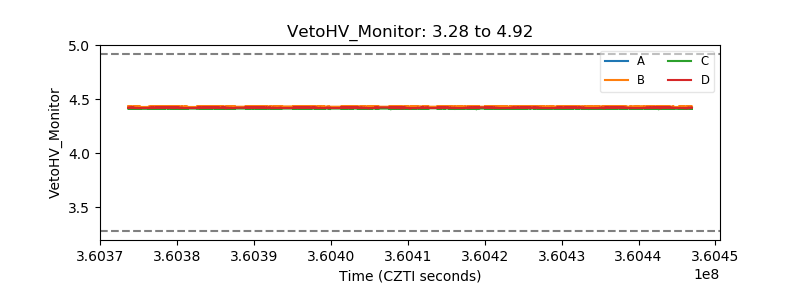 |
| Veto LLD |  |
| Alpha Counter |  |
| _CPM_Rate |  |
| CZT Counter |  |
| +2.5 Volts monitor |  |
| +5 Volts monitor |  |
| _ROLL_ROT | 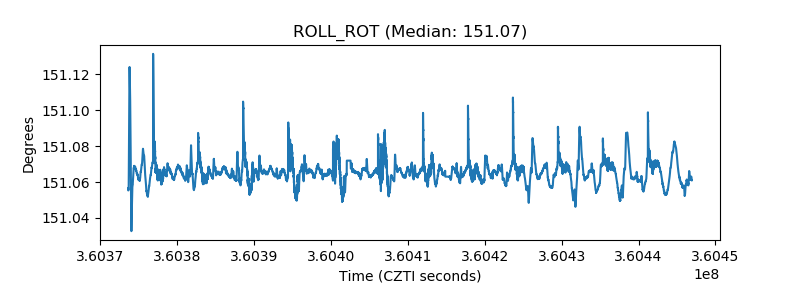 |
| _Roll_DEC |  |
| _Roll_RA | 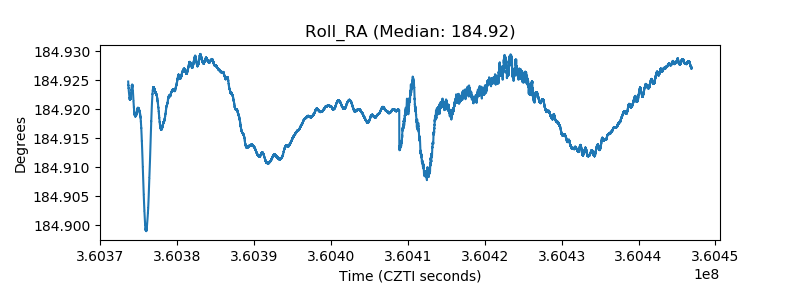 |
| Veto Counter |  |