| Param | Original file | Final file |
|---|---|---|
| Filename | modeM0/AS1A10_071T44_9000004434_30711cztM0_level2.evt | modeM0/AS1A10_071T44_9000004434_30711cztM0_level2_quad_clean.evt |
| Size (bytes) | 332,349,120 | 50,581,440 |
| Size | 317.0 MB | 48.2 MB |
| Events in quadrant A | 1,631,854 | 345,007 |
| Events in quadrant B | 2,525,524 | 342,989 |
| Events in quadrant C | 1,867,090 | 324,735 |
| Events in quadrant D | 3,831,496 | 299,606 |
| Mode SS | |||
|---|---|---|---|
| Quadrant | BADHDUFLAG | Total packets | Discarded packets |
| A | 0 | 62 | 0 |
| B | 0 | 62 | 0 |
| C | 0 | 62 | 0 |
| D | 0 | 62 | 0 |
| Mode M0 | |||
|---|---|---|---|
| Quadrant | BADHDUFLAG | Total packets | Discarded packets |
| A | 0 | 6559 | 1 |
| B | 0 | 9595 | 3 |
| C | 0 | 7276 | 1 |
| D | 0 | 13558 | 1 |
| Mode M9 | |||
|---|---|---|---|
| Quadrant | BADHDUFLAG | Total packets | Discarded packets |
| A | 0 | 10 | 0 |
| B | 0 | 10 | 0 |
| C | 0 | 10 | 0 |
| D | 0 | 10 | 0 |
| Quadrant | Total seconds | Saturated seconds | Saturation percentage |
|---|---|---|---|
| A | 3081 | 35 | 1.135995% |
| B | 3080 | 71 | 2.305195% |
| C | 3080 | 117 | 3.798701% |
| D | 3080 | 394 | 12.792208% |
Noise dominated data is calculated using 1-second bins in cleaned event files. If a bin has >2000 counts, and if more than 50% of those come from <1% of pixels, then it is considered to be noise-dominated and hence unusable.
| Quadrant | # 1 sec bins | Bins with >0 counts | Bins with >2000 counts | High rate bins dominated by noise | Noise dominated (total time) | Noise dominated (detector-on time) | Marked lightcurve |
|---|---|---|---|---|---|---|---|
| A | 4061 | 3081 | 5 | 5 | 0.12% | 0.16% | 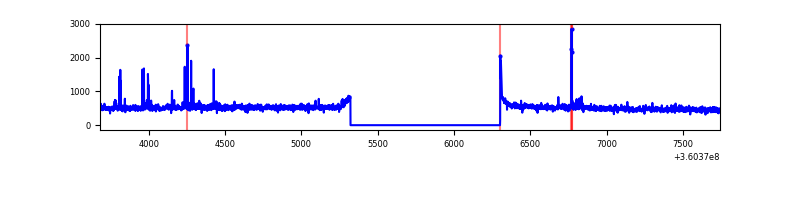 |
| B | 4060 | 3080 | 16 | 16 | 0.39% | 0.52% | 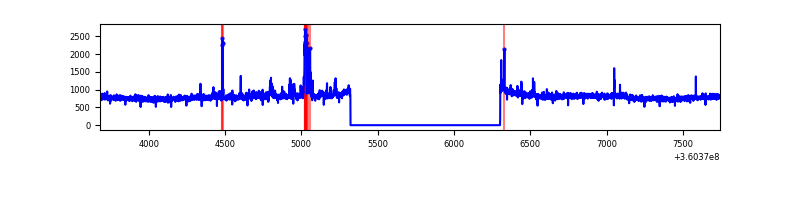 |
| C | 4060 | 3080 | 48 | 48 | 1.18% | 1.56% |  |
| D | 4060 | 3080 | 341 | 341 | 8.40% | 11.07% | 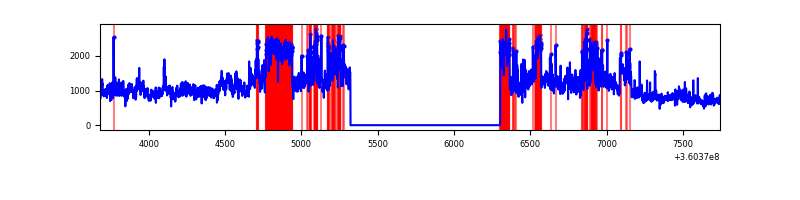 |
Top three noisy pixels from each quadrant. If the there are fewer than three noisy pixels in the level2.evt file, extra rows are filled as -1
| Pixel properties | Quadrant properties | ||||||
|---|---|---|---|---|---|---|---|
| Quadrant | DetID | PixID | Counts | Sigma | Mean | Median | Sigma |
| A | 0 | 13 | 48734 | 587.2 | 407 | 400 | 82.3 |
| A | 8 | 192 | 10455 | 122.16 | 407 | 400 | 82.3 |
| A | 13 | 254 | 5608 | 63.27 | 407 | 400 | 82.3 |
| B | 6 | 159 | 837776 | 10555.8 | 401 | 391 | 79.3 |
| B | 5 | 255 | 51395 | 642.94 | 401 | 391 | 79.3 |
| B | 0 | 190 | 16593 | 204.24 | 401 | 391 | 79.3 |
| C | 10 | 22 | 215492 | 2349.22 | 384 | 387 | 91.6 |
| C | 14 | 238 | 61673 | 669.32 | 384 | 387 | 91.6 |
| C | 3 | 233 | 50929 | 551.98 | 384 | 387 | 91.6 |
| D | 8 | 195 | 1852186 | 20246.55 | 379 | 369 | 91.5 |
| D | 13 | 174 | 313463 | 3423.16 | 379 | 369 | 91.5 |
| D | 13 | 249 | 104908 | 1142.96 | 379 | 369 | 91.5 |
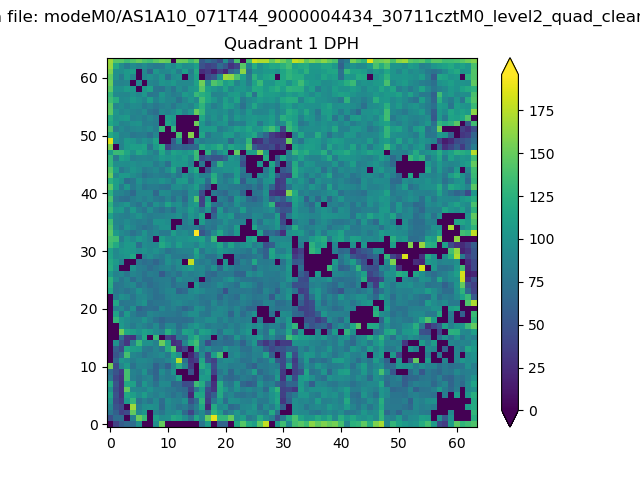
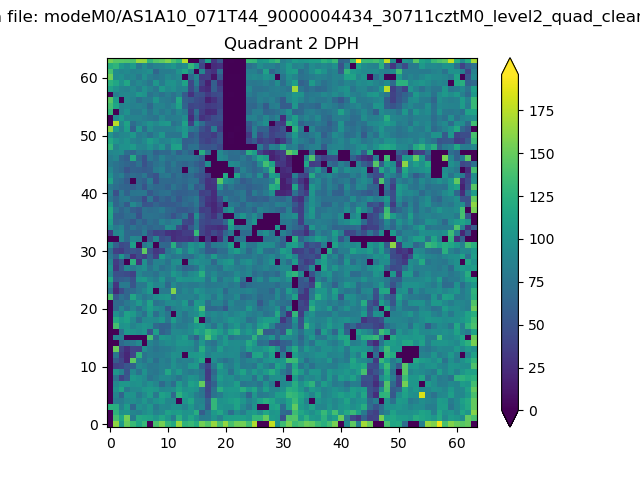
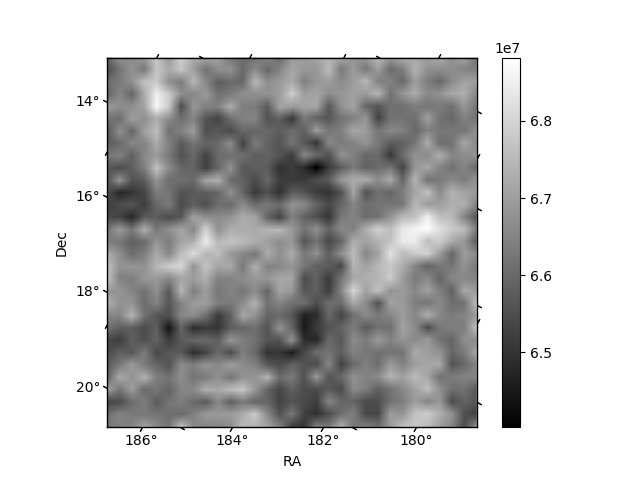
Histogram calculated using DETX and DETY for each event in the final _common_clean file
| Quadrant A | 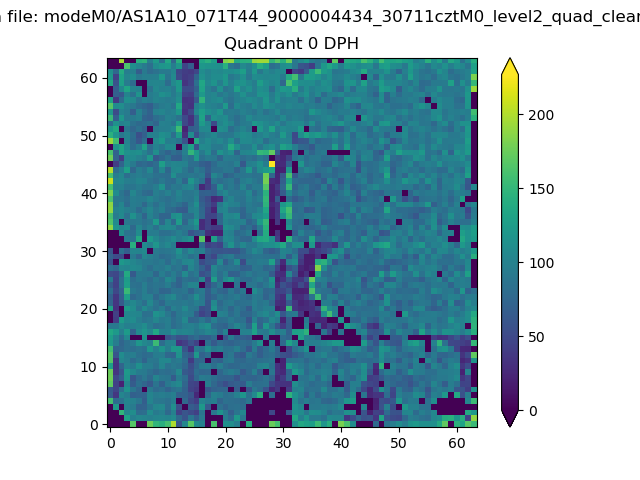 |
 |
Quadrant B |
|---|---|---|---|
| Quadrant D | 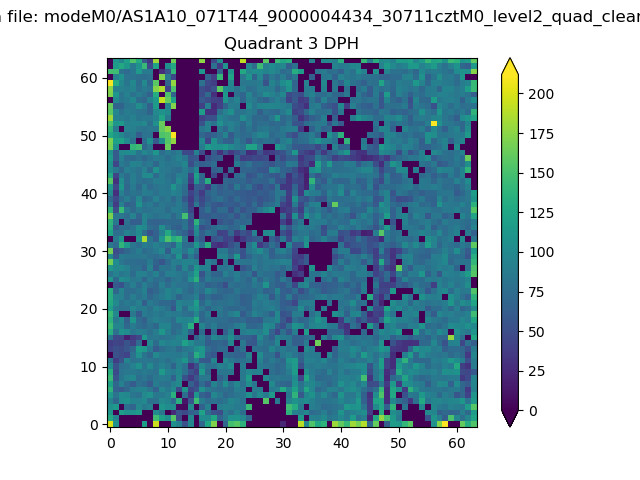 |
 |
Quadrant C |
| Plot type | Count rate plots | Images |
|---|---|---|
| Comparison with Poisson distribution Blue bars denote a histogram of data divided into 1 sec bins. Red curve is a Poisson curve with rate = median count rate of data. |
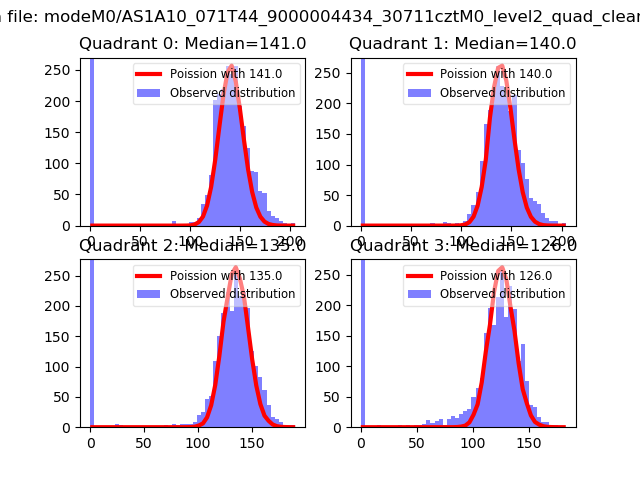 |
 |
| Quadrant-wise count rates Data is divided into 100 sec bins |
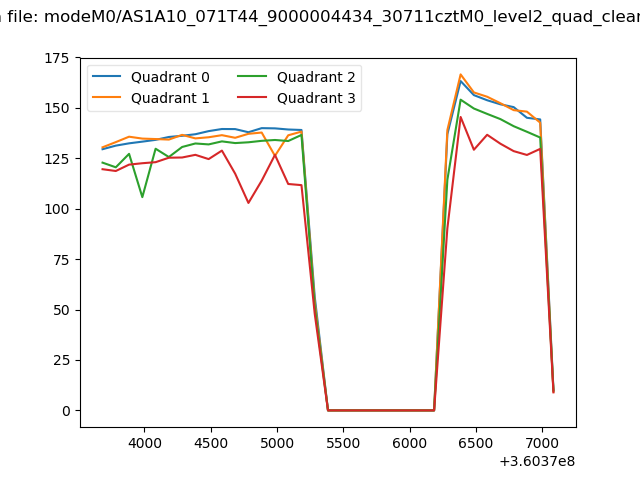 |
|
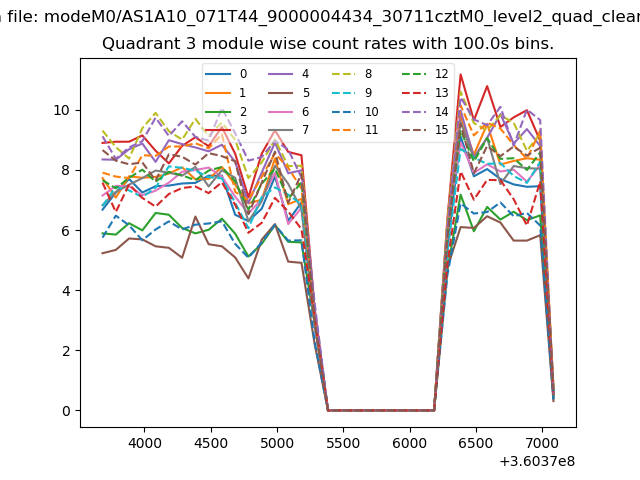
| Module-wise count rates for Quadrant A Data is divided into 100 sec bins |
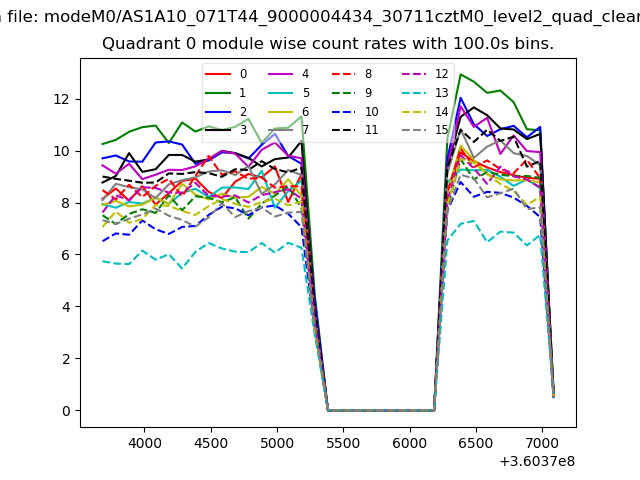 |
 |
| Module-wise count rates for Quadrant B Data is divided into 100 sec bins |
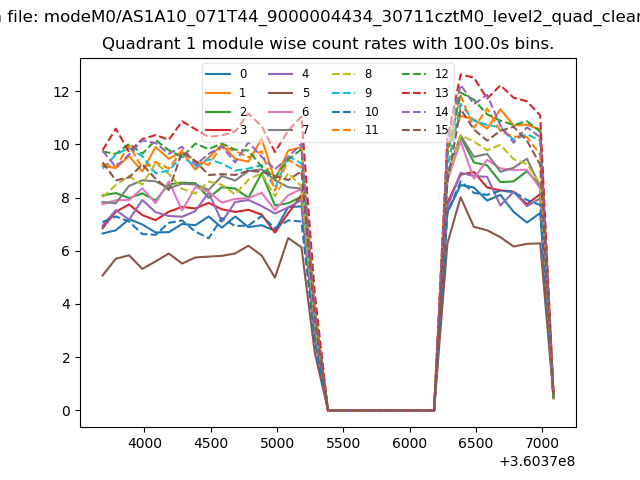 |
 |
| Module-wise count rates for Quadrant C Data is divided into 100 sec bins |
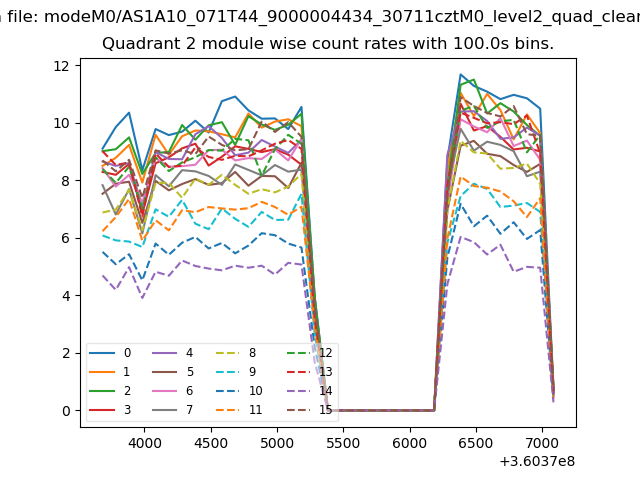 |
 |
| Module-wise count rates for Quadrant D Data is divided into 100 sec bins |
 |
 |
| Parameter | Plot |
|---|---|
| CZT HV Monitor | 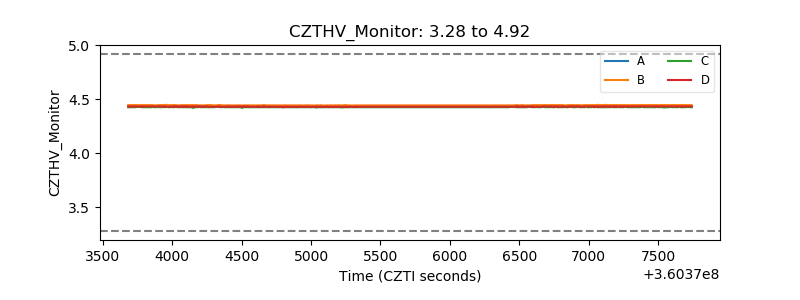 |
| D_VDD |  |
| Temperature 1 | 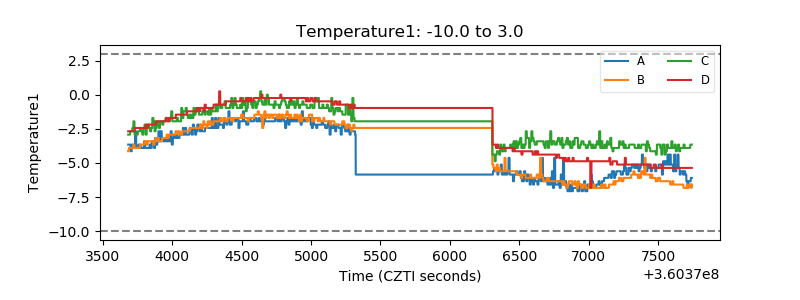 |
| Veto HV Monitor |  |
| Veto LLD | 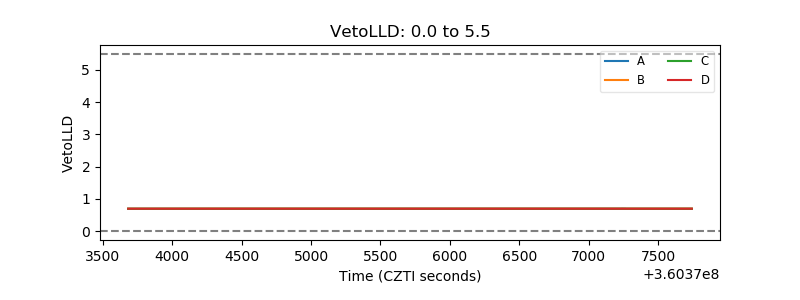 |
| Alpha Counter | 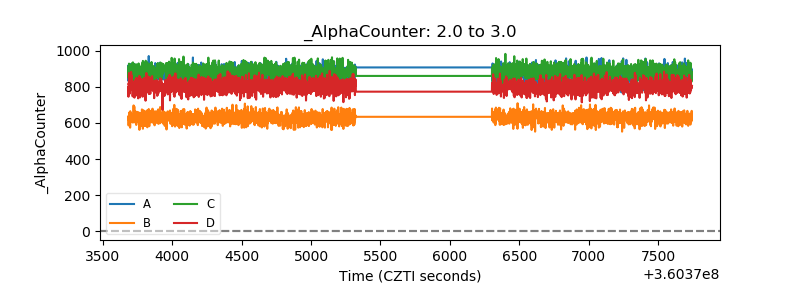 |
| _CPM_Rate | 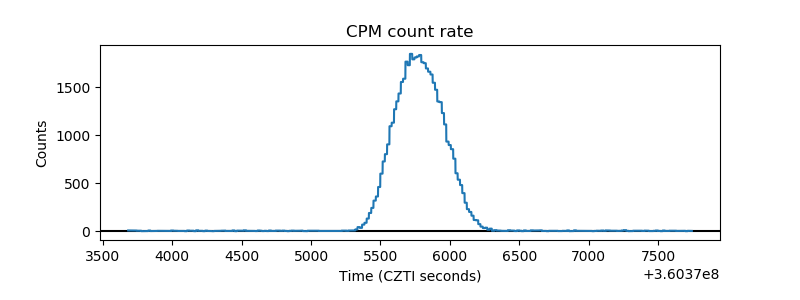 |
| CZT Counter |  |
| +2.5 Volts monitor | 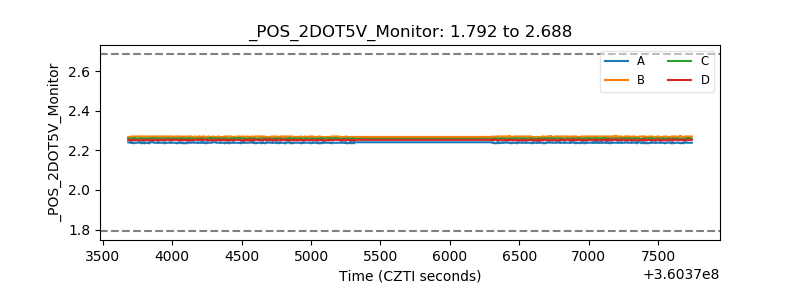 |
| +5 Volts monitor | 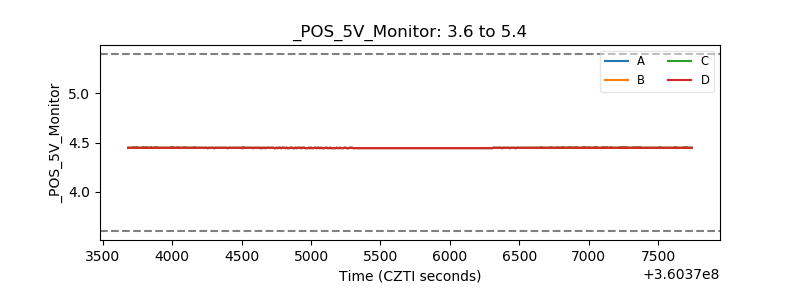 |
| _ROLL_ROT | 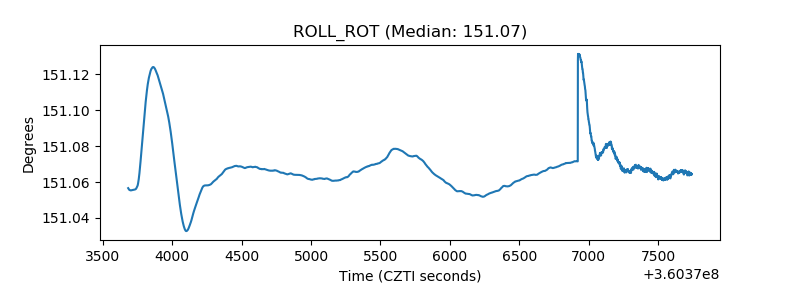 |
| _Roll_DEC |  |
| _Roll_RA |  |
| Veto Counter | 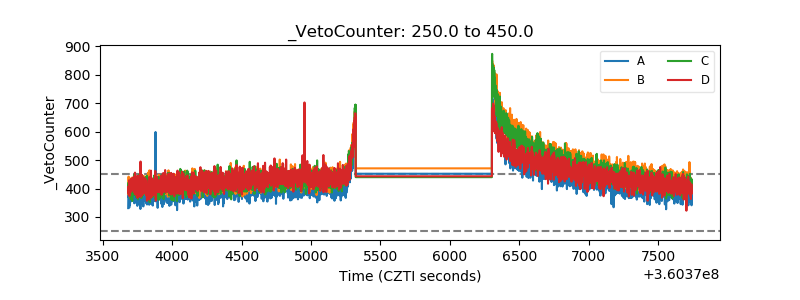 |