| Param | Original file | Final file |
|---|---|---|
| Filename | modeM0/AS1A10_071T44_9000004434_30714cztM0_level2.evt | modeM0/AS1A10_071T44_9000004434_30714cztM0_level2_quad_clean.evt |
| Size (bytes) | 681,324,480 | 66,942,720 |
| Size | 649.8 MB | 63.8 MB |
| Events in quadrant A | 3,867,868 | 409,348 |
| Events in quadrant B | 5,358,260 | 413,031 |
| Events in quadrant C | 4,472,999 | 383,245 |
| Events in quadrant D | 6,496,818 | 367,544 |
| Mode SS | |||
|---|---|---|---|
| Quadrant | BADHDUFLAG | Total packets | Discarded packets |
| A | 0 | 130 | 0 |
| B | 0 | 130 | 0 |
| C | 0 | 130 | 0 |
| D | 0 | 130 | 0 |
| Mode M0 | |||
|---|---|---|---|
| Quadrant | BADHDUFLAG | Total packets | Discarded packets |
| A | 0 | 15438 | 2 |
| B | 0 | 20097 | 2 |
| C | 0 | 17429 | 2 |
| D | 0 | 23975 | 5 |
| Mode M9 | |||
|---|---|---|---|
| Quadrant | BADHDUFLAG | Total packets | Discarded packets |
| A | 0 | 16 | 0 |
| B | 0 | 17 | 0 |
| C | 0 | 17 | 0 |
| D | 0 | 17 | 0 |
| Quadrant | Total seconds | Saturated seconds | Saturation percentage |
|---|---|---|---|
| A | 6508 | 109 | 1.674862% |
| B | 6508 | 104 | 1.598033% |
| C | 6508 | 275 | 4.225569% |
| D | 6507 | 234 | 3.596127% |
Noise dominated data is calculated using 1-second bins in cleaned event files. If a bin has >2000 counts, and if more than 50% of those come from <1% of pixels, then it is considered to be noise-dominated and hence unusable.
| Quadrant | # 1 sec bins | Bins with >0 counts | Bins with >2000 counts | High rate bins dominated by noise | Noise dominated (total time) | Noise dominated (detector-on time) | Marked lightcurve |
|---|---|---|---|---|---|---|---|
| A | 7753 | 6508 | 46 | 46 | 0.59% | 0.71% | 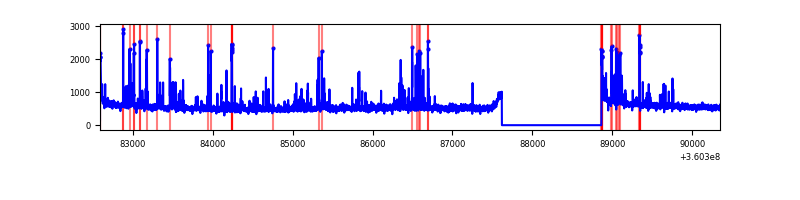 |
| B | 7753 | 6508 | 2 | 2 | 0.03% | 0.03% | 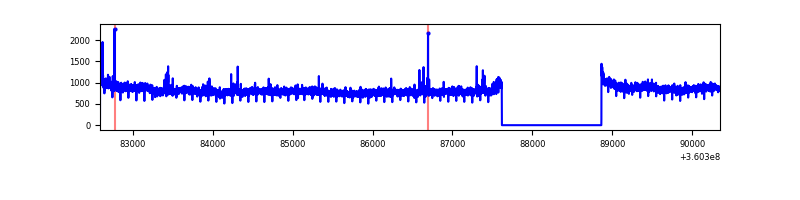 |
| C | 7753 | 6508 | 72 | 72 | 0.93% | 1.11% | 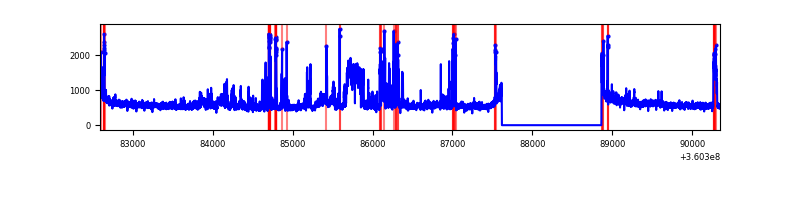 |
| D | 7752 | 6507 | 187 | 187 | 2.41% | 2.87% | 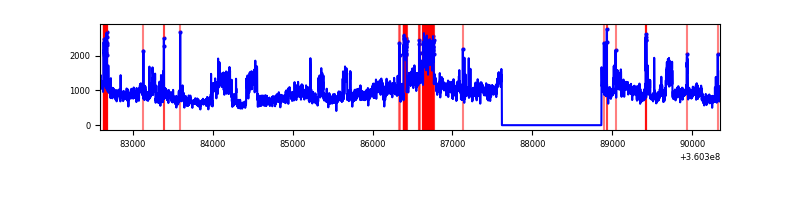 |
Top three noisy pixels from each quadrant. If the there are fewer than three noisy pixels in the level2.evt file, extra rows are filled as -1
| Pixel properties | Quadrant properties | ||||||
|---|---|---|---|---|---|---|---|
| Quadrant | DetID | PixID | Counts | Sigma | Mean | Median | Sigma |
| A | 0 | 13 | 366001 | 2051.26 | 899 | 883 | 178.0 |
| A | 8 | 192 | 27653 | 150.4 | 899 | 883 | 178.0 |
| A | 13 | 254 | 12455 | 65.01 | 899 | 883 | 178.0 |
| B | 6 | 159 | 1782473 | 10578.8 | 896 | 876 | 168.4 |
| B | 0 | 230 | 27210 | 156.37 | 896 | 876 | 168.4 |
| B | 6 | 36 | 22748 | 129.87 | 896 | 876 | 168.4 |
| C | 3 | 233 | 543017 | 2760.75 | 841 | 848 | 196.4 |
| C | 10 | 22 | 462861 | 2352.59 | 841 | 848 | 196.4 |
| C | 14 | 238 | 137299 | 694.81 | 841 | 848 | 196.4 |
| D | 8 | 195 | 3090528 | 14083.3 | 840 | 827 | 219.4 |
| D | 13 | 174 | 135988 | 616.08 | 840 | 827 | 219.4 |
| D | 2 | 250 | 24769 | 109.13 | 840 | 827 | 219.4 |
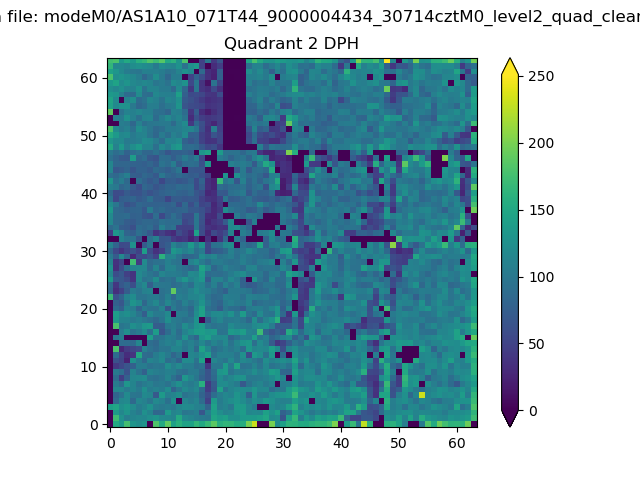
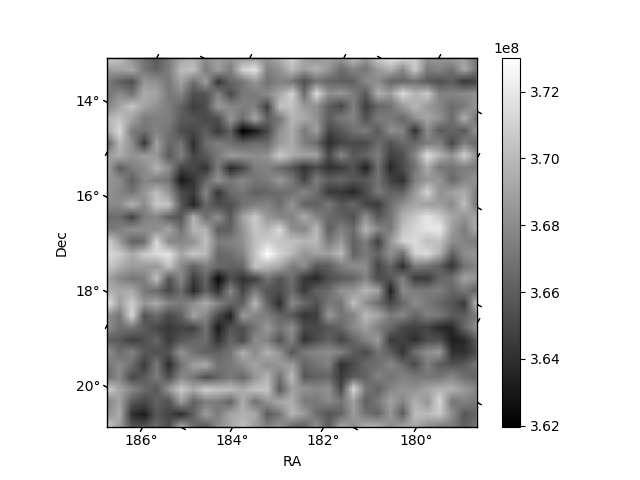
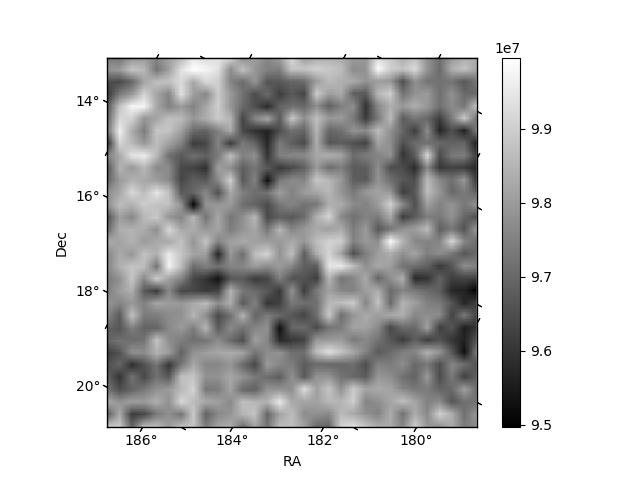
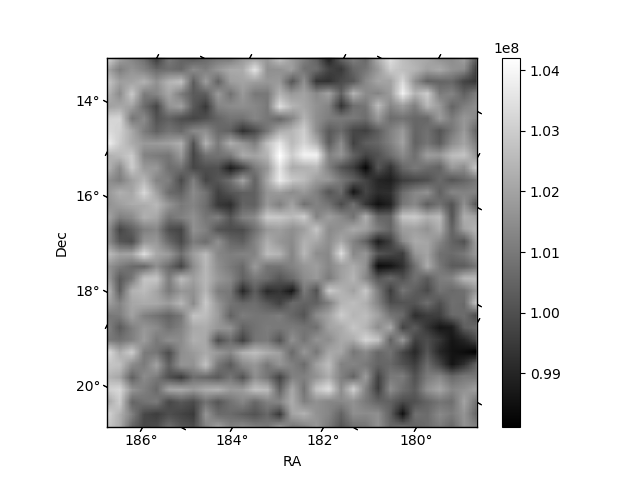
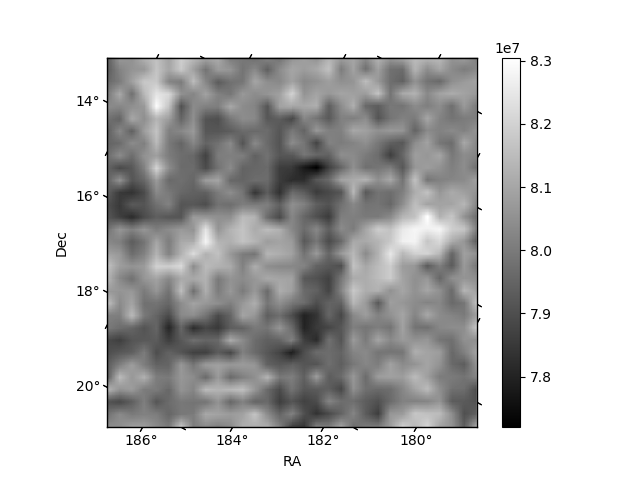
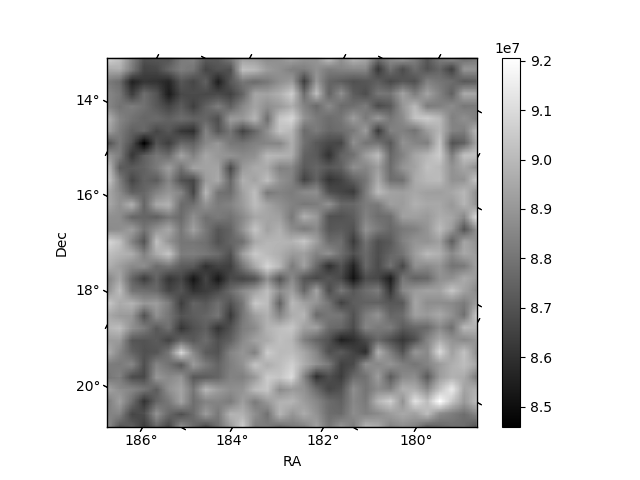
Histogram calculated using DETX and DETY for each event in the final _common_clean file
| Quadrant A | 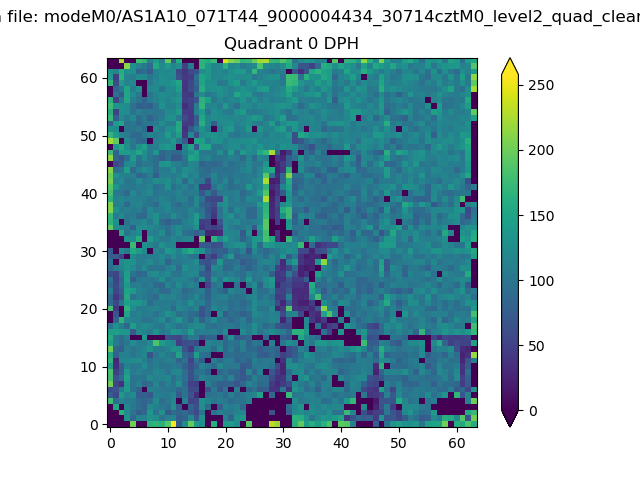 |
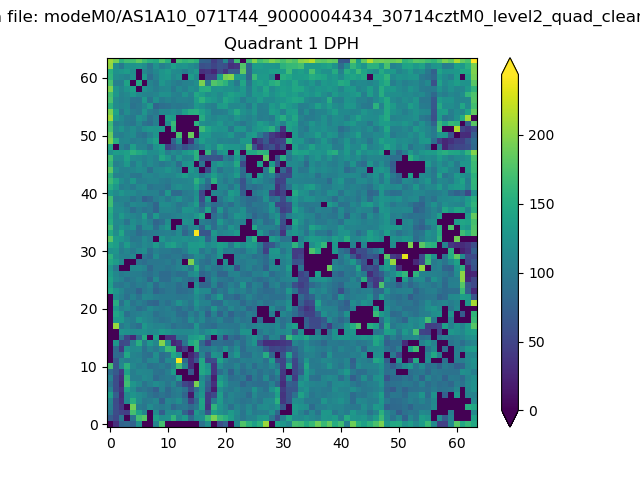 |
Quadrant B |
|---|---|---|---|
| Quadrant D | 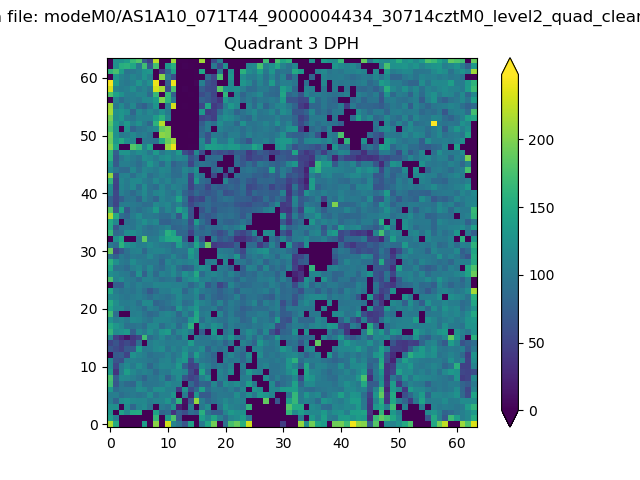 |
 |
Quadrant C |
| Plot type | Count rate plots | Images |
|---|---|---|
| Comparison with Poisson distribution Blue bars denote a histogram of data divided into 1 sec bins. Red curve is a Poisson curve with rate = median count rate of data. |
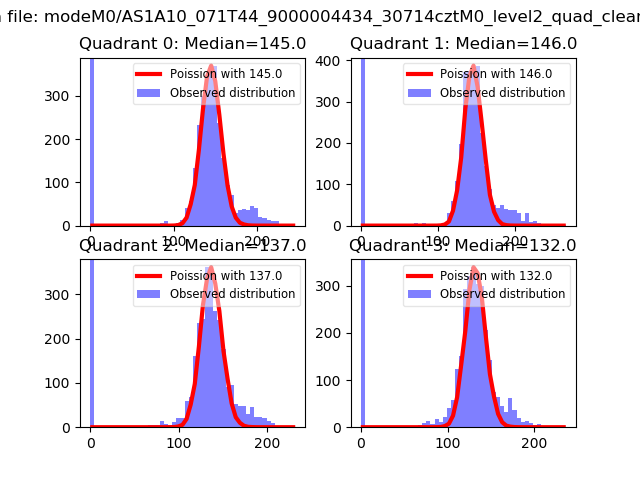 |
 |
| Quadrant-wise count rates Data is divided into 100 sec bins |
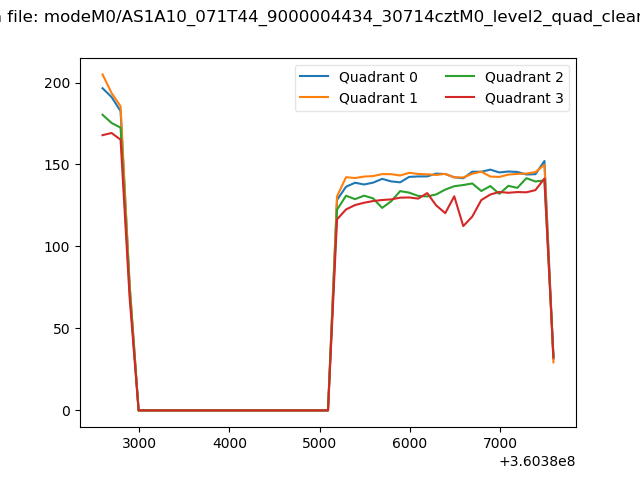 |
|
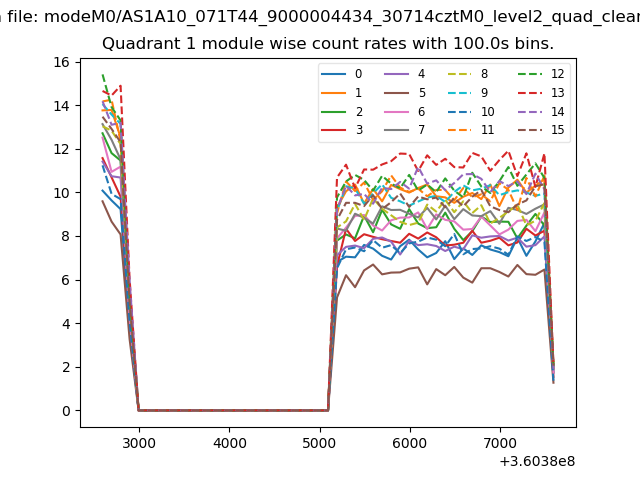
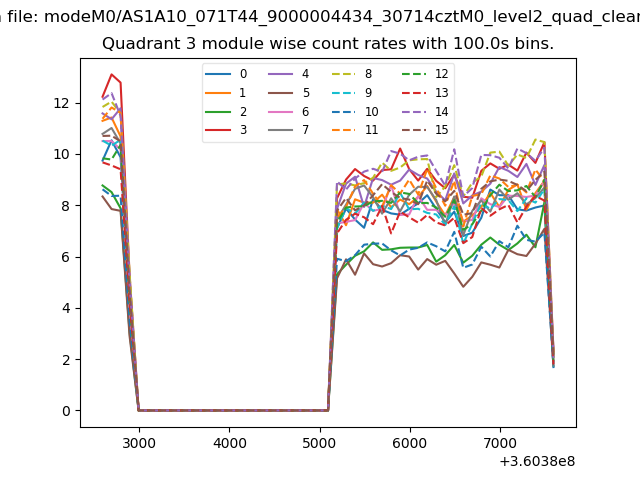
| Module-wise count rates for Quadrant A Data is divided into 100 sec bins |
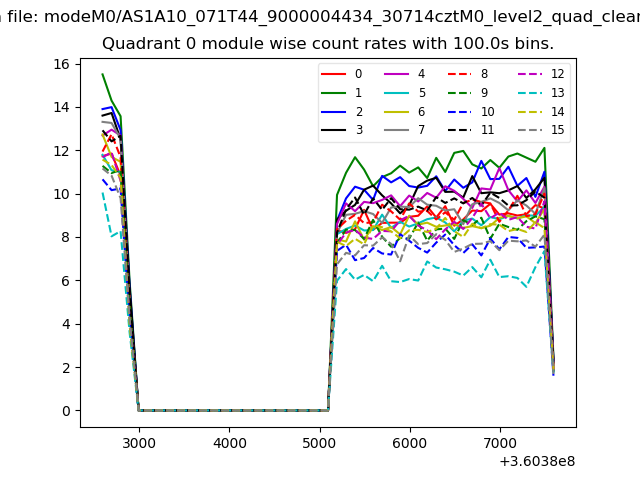 |
 |
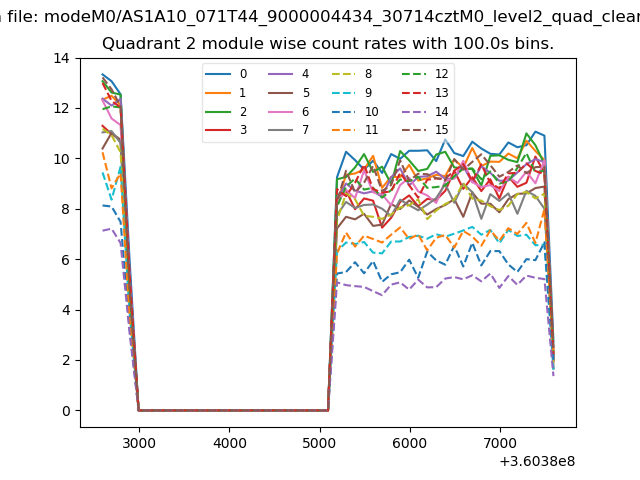
| Module-wise count rates for Quadrant B Data is divided into 100 sec bins |
 |
 |
| Module-wise count rates for Quadrant C Data is divided into 100 sec bins |
 |
 |
| Module-wise count rates for Quadrant D Data is divided into 100 sec bins |
 |
 |
| Parameter | Plot |
|---|---|
| CZT HV Monitor | 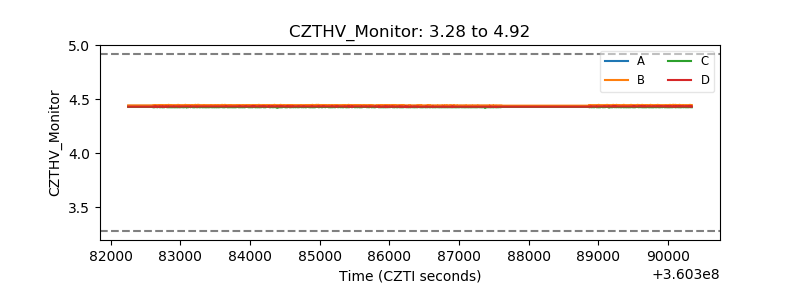 |
| D_VDD | 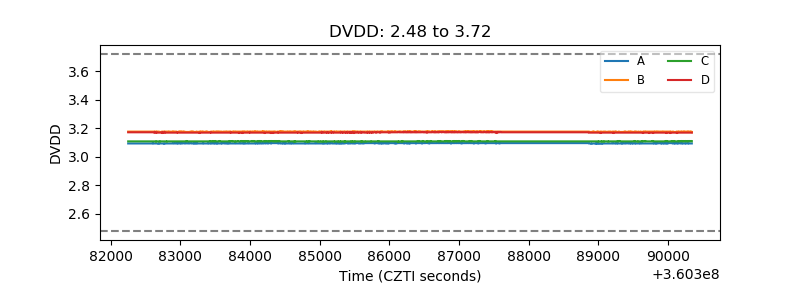 |
| Temperature 1 | 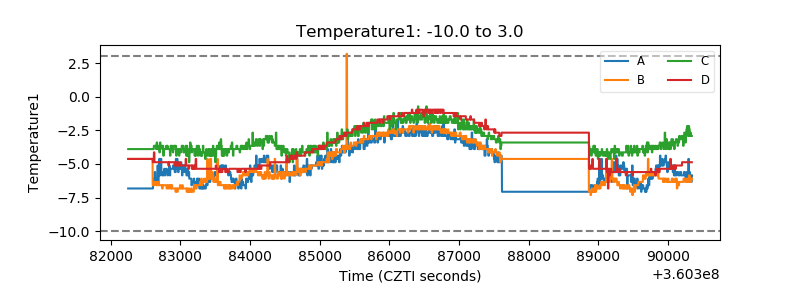 |
| Veto HV Monitor | 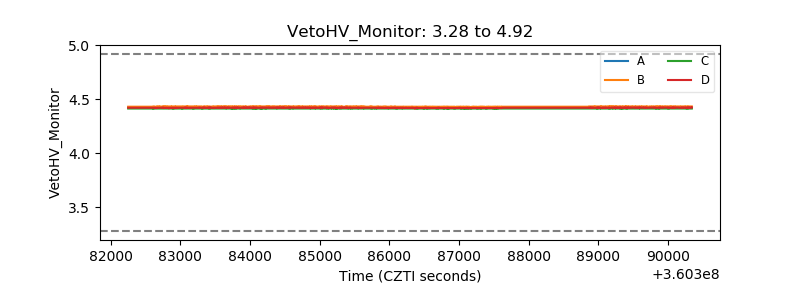 |
| Veto LLD | 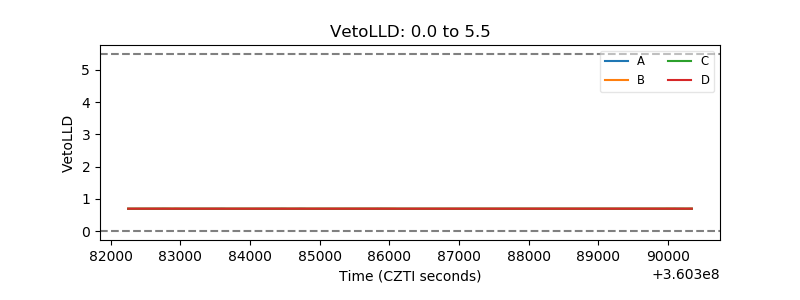 |
| Alpha Counter | 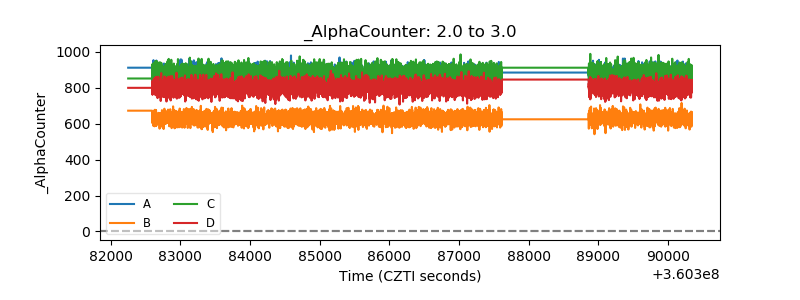 |
| _CPM_Rate | 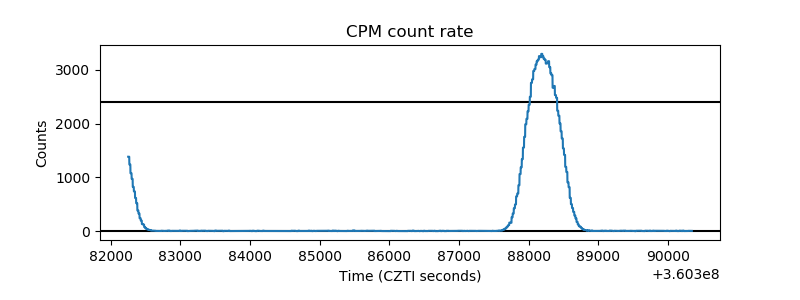 |
| CZT Counter | 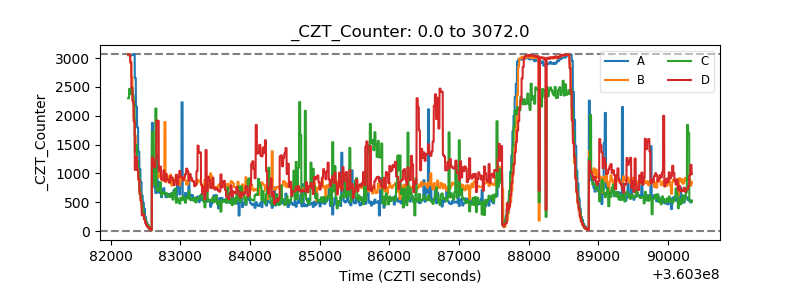 |
| +2.5 Volts monitor |  |
| +5 Volts monitor |  |
| _ROLL_ROT | 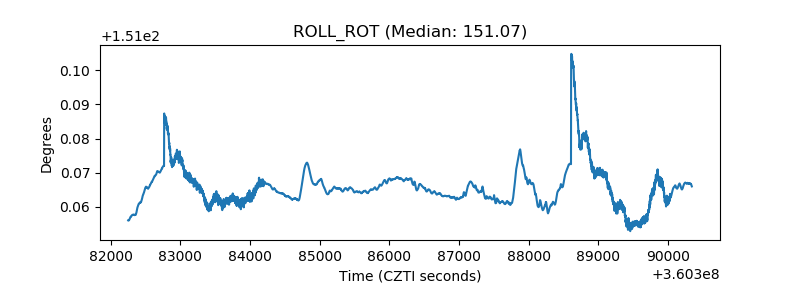 |
| _Roll_DEC | 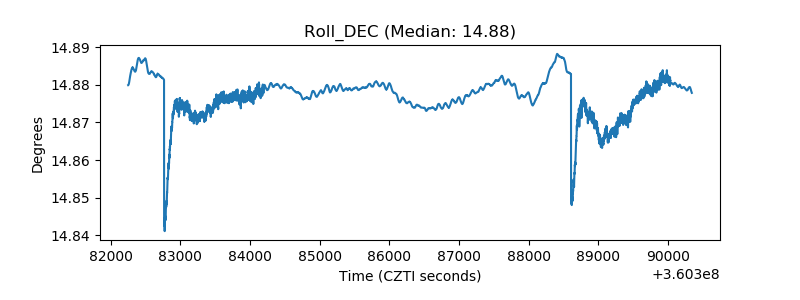 |
| _Roll_RA | 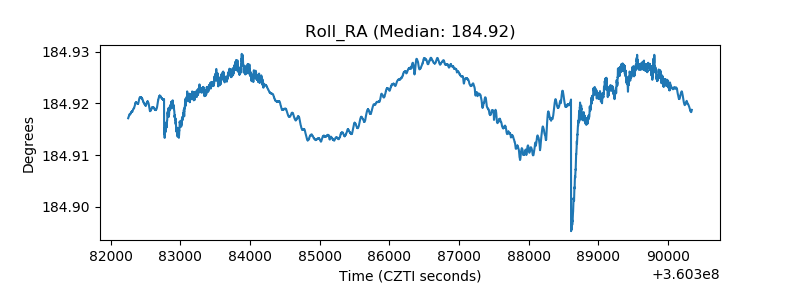 |
| Veto Counter | 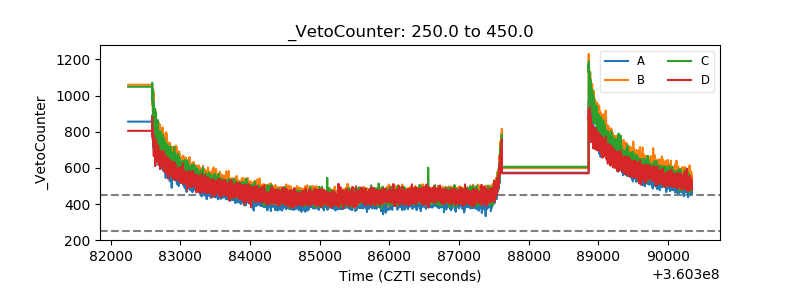 |