| Param | Original file | Final file |
|---|---|---|
| Filename | modeM0/AS1A10_071T44_9000004434_30715cztM0_level2.evt | modeM0/AS1A10_071T44_9000004434_30715cztM0_level2_quad_clean.evt |
| Size (bytes) | 695,744,640 | 66,795,840 |
| Size | 663.5 MB | 63.7 MB |
| Events in quadrant A | 4,009,093 | 412,755 |
| Events in quadrant B | 5,515,279 | 413,812 |
| Events in quadrant C | 4,236,940 | 387,134 |
| Events in quadrant D | 6,875,962 | 359,817 |
| Mode SS | |||
|---|---|---|---|
| Quadrant | BADHDUFLAG | Total packets | Discarded packets |
| A | 0 | 130 | 0 |
| B | 0 | 130 | 0 |
| C | 0 | 130 | 0 |
| D | 0 | 130 | 0 |
| Mode M0 | |||
|---|---|---|---|
| Quadrant | BADHDUFLAG | Total packets | Discarded packets |
| A | 0 | 15896 | 2 |
| B | 0 | 20330 | 2 |
| C | 0 | 16821 | 2 |
| D | 0 | 25151 | 3 |
| Mode M9 | |||
|---|---|---|---|
| Quadrant | BADHDUFLAG | Total packets | Discarded packets |
| A | 0 | 14 | 0 |
| B | 0 | 15 | 0 |
| C | 0 | 15 | 0 |
| D | 0 | 15 | 0 |
| Quadrant | Total seconds | Saturated seconds | Saturation percentage |
|---|---|---|---|
| A | 6435 | 156 | 2.424242% |
| B | 6435 | 146 | 2.268842% |
| C | 6435 | 217 | 3.372183% |
| D | 6434 | 466 | 7.242773% |
Noise dominated data is calculated using 1-second bins in cleaned event files. If a bin has >2000 counts, and if more than 50% of those come from <1% of pixels, then it is considered to be noise-dominated and hence unusable.
| Quadrant | # 1 sec bins | Bins with >0 counts | Bins with >2000 counts | High rate bins dominated by noise | Noise dominated (total time) | Noise dominated (detector-on time) | Marked lightcurve |
|---|---|---|---|---|---|---|---|
| A | 7744 | 6434 | 53 | 53 | 0.68% | 0.82% | 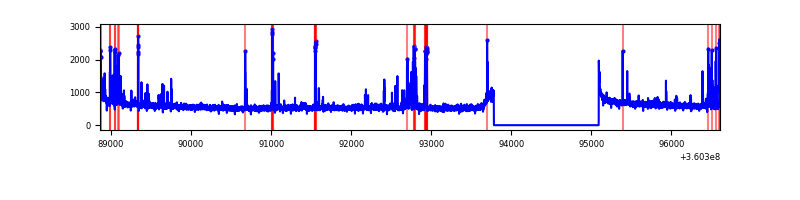 |
| B | 7745 | 6435 | 9 | 9 | 0.12% | 0.14% | 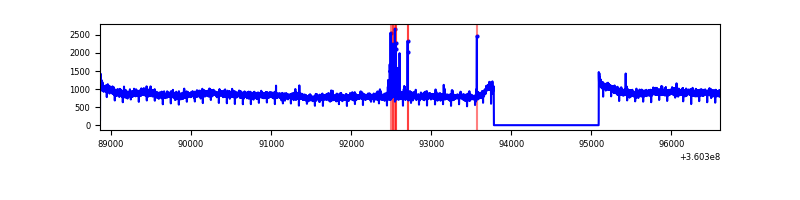 |
| C | 7745 | 6435 | 51 | 51 | 0.66% | 0.79% | 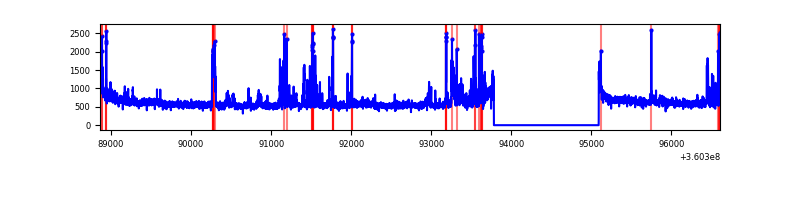 |
| D | 7744 | 6434 | 428 | 428 | 5.53% | 6.65% | 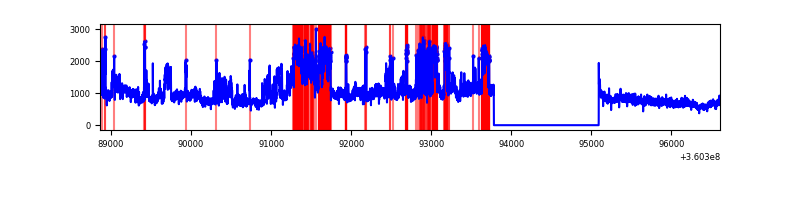 |
Top three noisy pixels from each quadrant. If the there are fewer than three noisy pixels in the level2.evt file, extra rows are filled as -1
| Pixel properties | Quadrant properties | ||||||
|---|---|---|---|---|---|---|---|
| Quadrant | DetID | PixID | Counts | Sigma | Mean | Median | Sigma |
| A | 0 | 13 | 326278 | 1754.81 | 946 | 932 | 185.4 |
| A | 8 | 192 | 27428 | 142.91 | 946 | 932 | 185.4 |
| A | 13 | 254 | 11786 | 58.54 | 946 | 932 | 185.4 |
| B | 6 | 159 | 1768840 | 10147.05 | 936 | 916 | 174.2 |
| B | 15 | 32 | 43042 | 241.78 | 936 | 916 | 174.2 |
| B | 12 | 111 | 20431 | 112.01 | 936 | 916 | 174.2 |
| C | 10 | 22 | 449501 | 2210.45 | 878 | 886 | 203.0 |
| C | 3 | 233 | 162018 | 793.94 | 878 | 886 | 203.0 |
| C | 14 | 238 | 147531 | 722.56 | 878 | 886 | 203.0 |
| D | 8 | 195 | 2955180 | 13320.95 | 874 | 859 | 221.8 |
| D | 13 | 174 | 462610 | 2082.02 | 874 | 859 | 221.8 |
| D | 1 | 52 | 66814 | 297.39 | 874 | 859 | 221.8 |
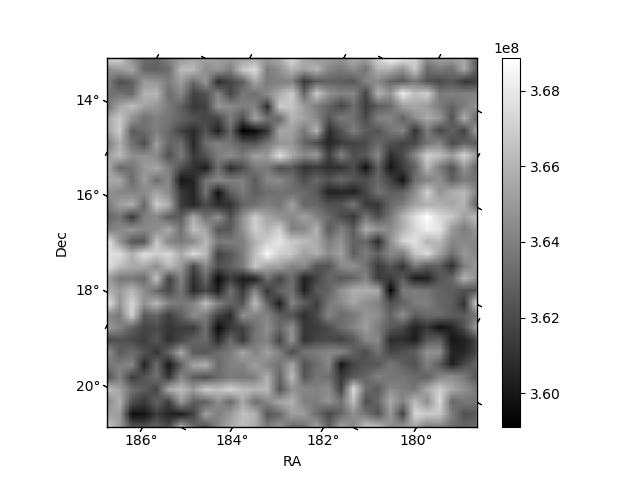
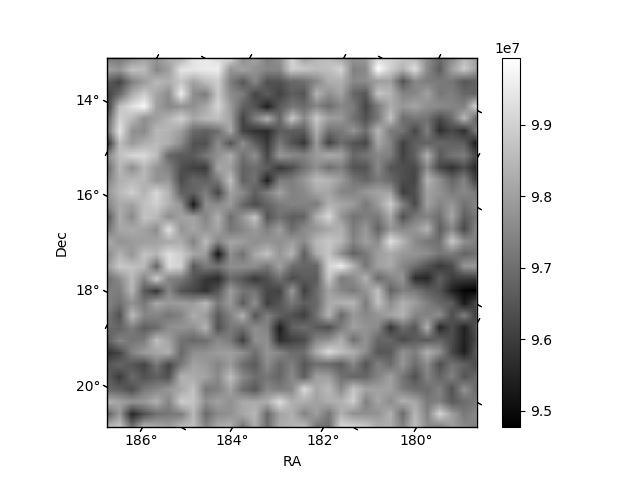
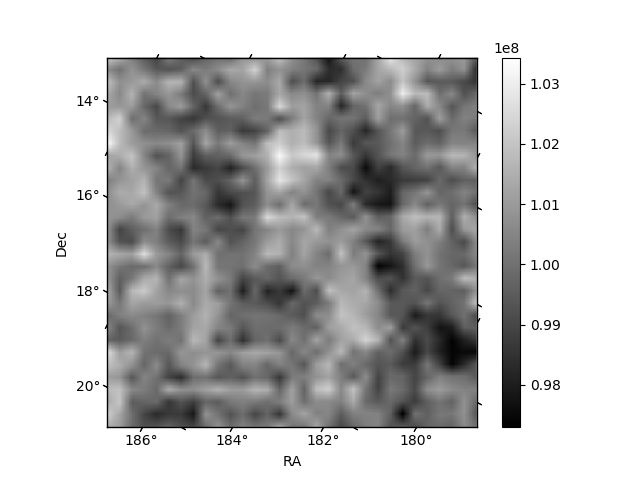
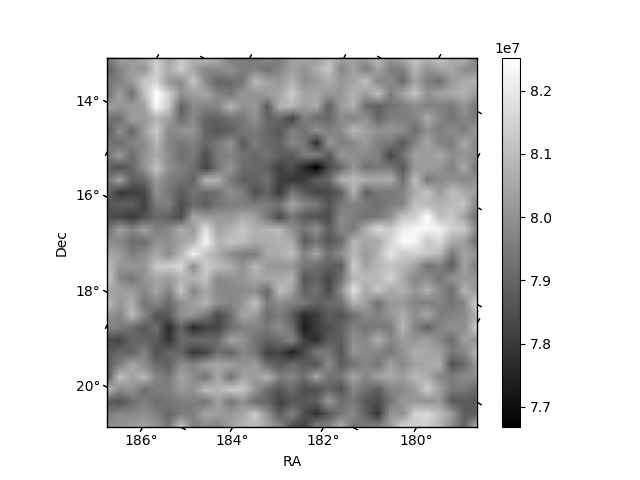
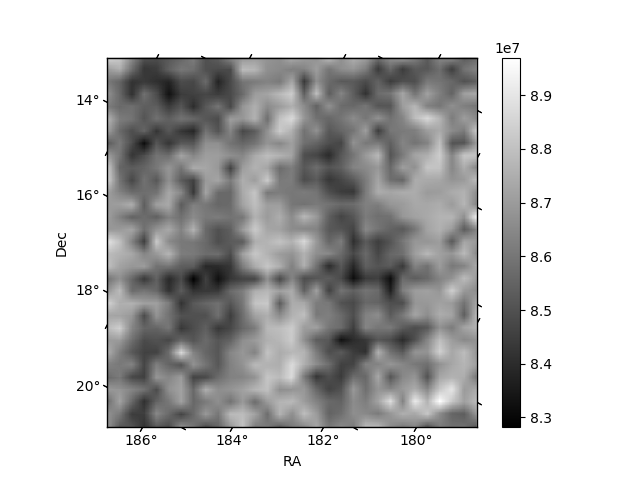
Histogram calculated using DETX and DETY for each event in the final _common_clean file
| Quadrant A |  |
 |
Quadrant B |
|---|---|---|---|
| Quadrant D |  |
 |
Quadrant C |
| Plot type | Count rate plots | Images |
|---|---|---|
| Comparison with Poisson distribution Blue bars denote a histogram of data divided into 1 sec bins. Red curve is a Poisson curve with rate = median count rate of data. |
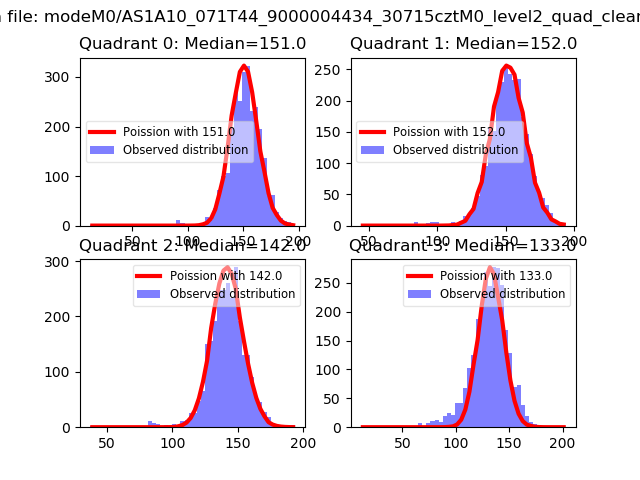 |
 |
| Quadrant-wise count rates Data is divided into 100 sec bins |
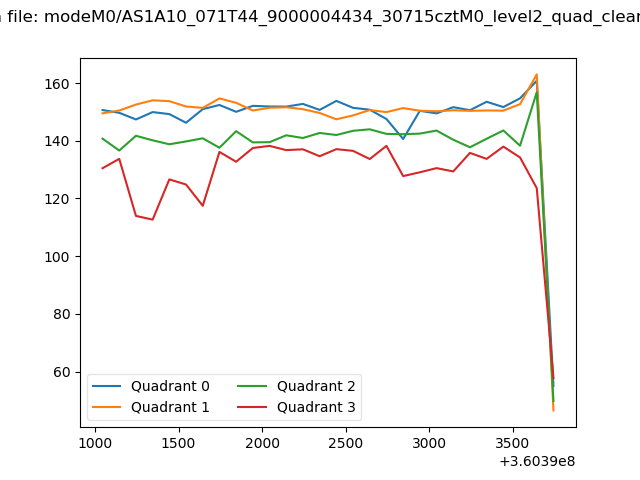 |
|
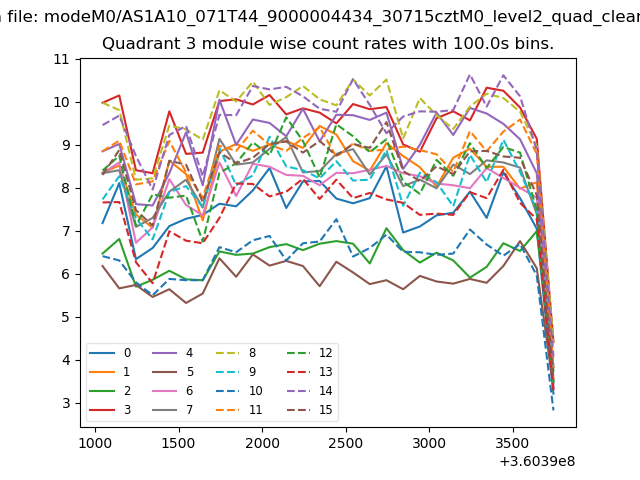
| Module-wise count rates for Quadrant A Data is divided into 100 sec bins |
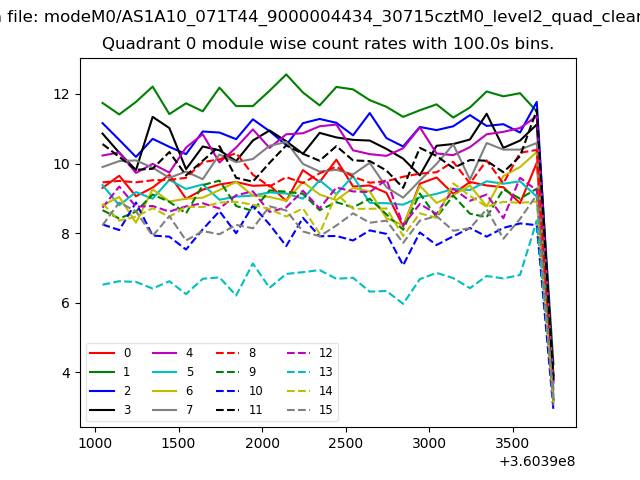 |
 |
| Module-wise count rates for Quadrant B Data is divided into 100 sec bins |
 |
 |
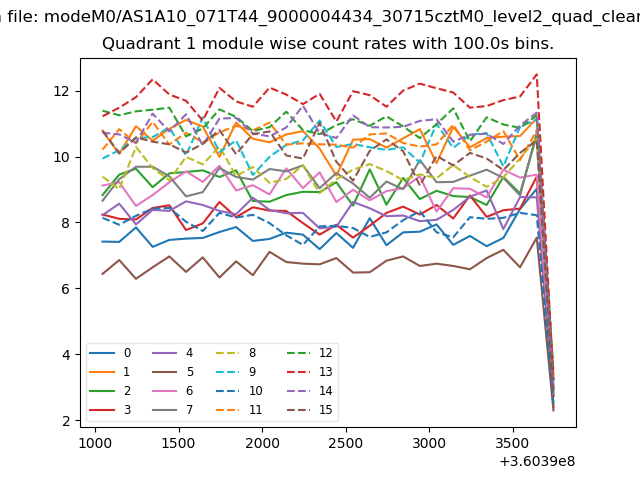
| Module-wise count rates for Quadrant C Data is divided into 100 sec bins |
 |
 |
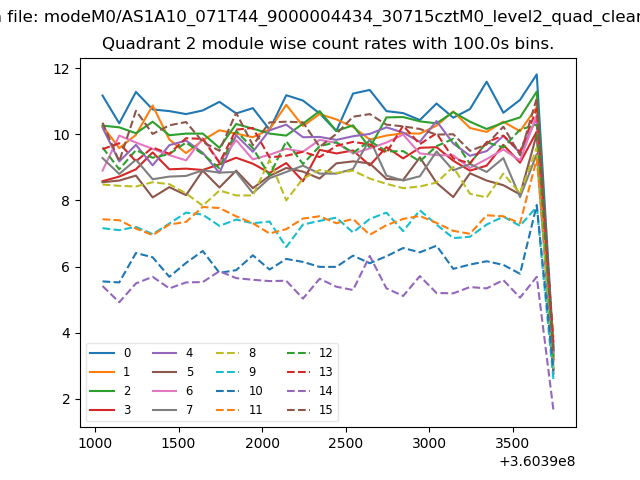
| Module-wise count rates for Quadrant D Data is divided into 100 sec bins |
 |
 |
| Parameter | Plot |
|---|---|
| CZT HV Monitor | 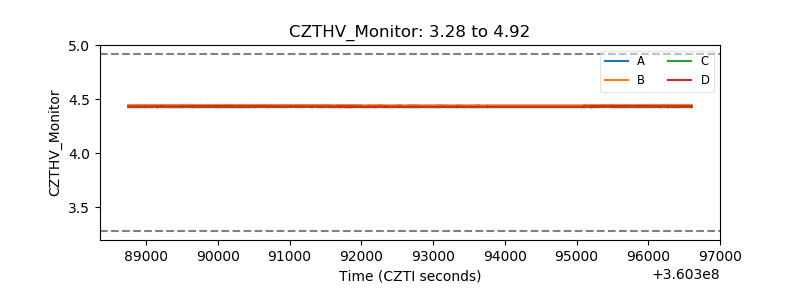 |
| D_VDD | 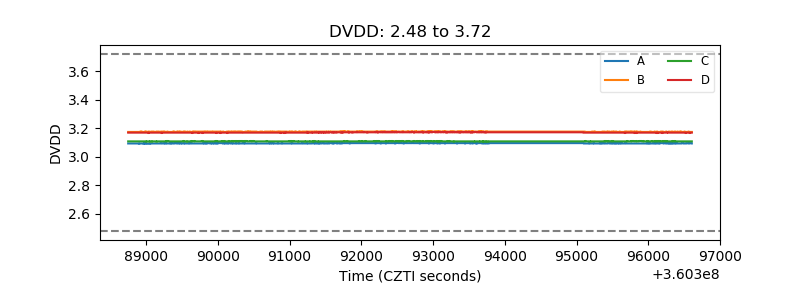 |
| Temperature 1 | 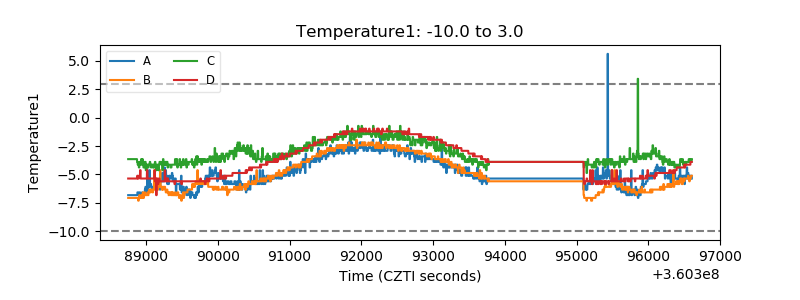 |
| Veto HV Monitor |  |
| Veto LLD | 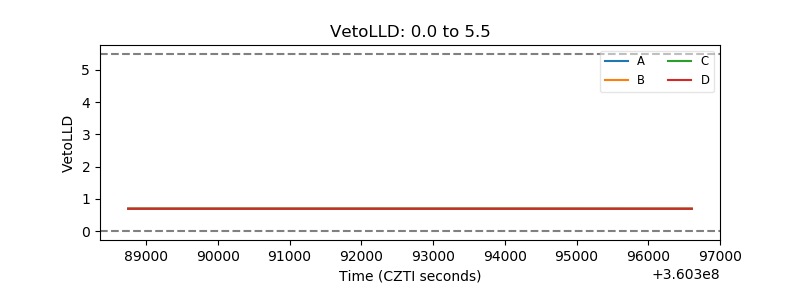 |
| Alpha Counter | 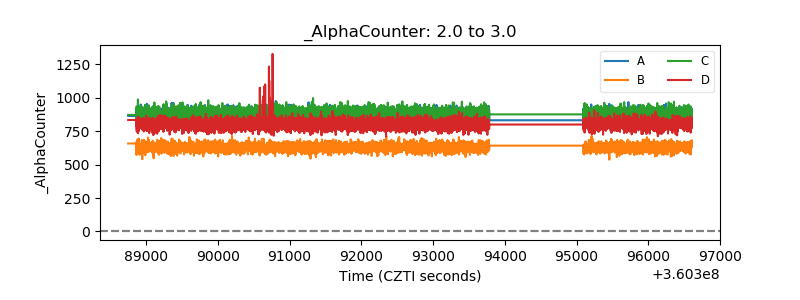 |
| _CPM_Rate | 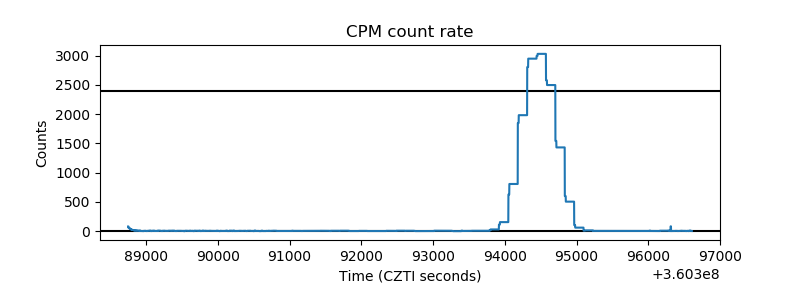 |
| CZT Counter |  |
| +2.5 Volts monitor |  |
| +5 Volts monitor | 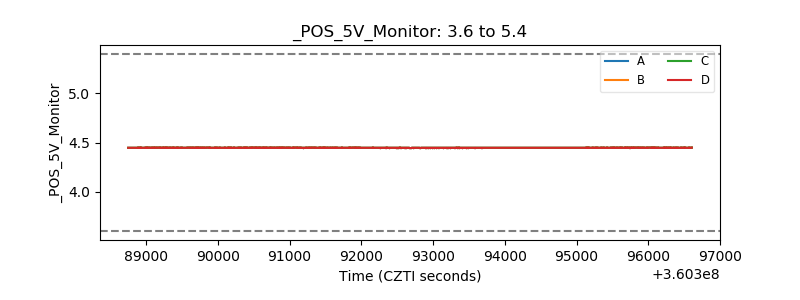 |
| _ROLL_ROT | 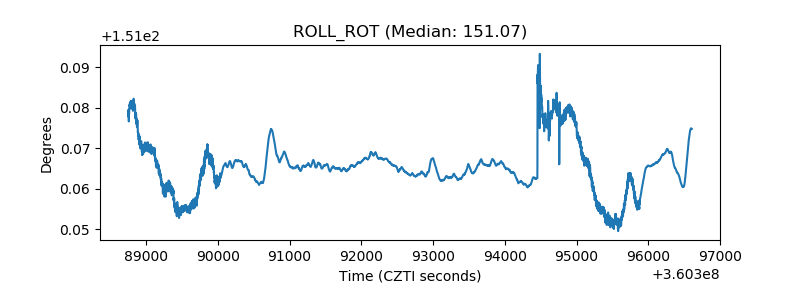 |
| _Roll_DEC |  |
| _Roll_RA | 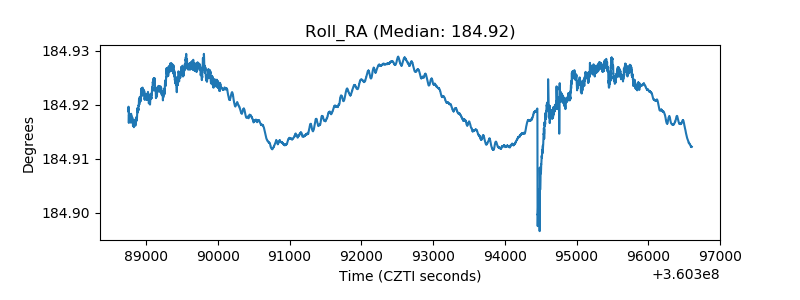 |
| Veto Counter | 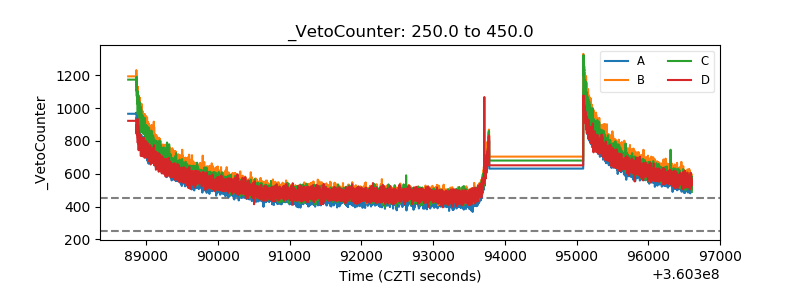 |