| Param | Original file | Final file |
|---|---|---|
| Filename | modeM0/AS1A10_071T44_9000004434_30716cztM0_level2.evt | modeM0/AS1A10_071T44_9000004434_30716cztM0_level2_quad_clean.evt |
| Size (bytes) | 627,065,280 | 75,240,000 |
| Size | 598.0 MB | 71.8 MB |
| Events in quadrant A | 4,041,675 | 485,477 |
| Events in quadrant B | 5,205,785 | 485,716 |
| Events in quadrant C | 4,369,292 | 445,600 |
| Events in quadrant D | 4,965,158 | 438,290 |
| Mode SS | |||
|---|---|---|---|
| Quadrant | BADHDUFLAG | Total packets | Discarded packets |
| A | 0 | 124 | 0 |
| B | 0 | 124 | 0 |
| C | 0 | 124 | 0 |
| D | 0 | 124 | 0 |
| Mode M0 | |||
|---|---|---|---|
| Quadrant | BADHDUFLAG | Total packets | Discarded packets |
| A | 0 | 16392 | 1 |
| B | 0 | 19153 | 1 |
| C | 0 | 17134 | 1 |
| D | 0 | 19364 | 3 |
| Mode M9 | |||
|---|---|---|---|
| Quadrant | BADHDUFLAG | Total packets | Discarded packets |
| A | 0 | 13 | 0 |
| B | 0 | 13 | 0 |
| C | 0 | 13 | 0 |
| D | 0 | 13 | 0 |
| Quadrant | Total seconds | Saturated seconds | Saturation percentage |
|---|---|---|---|
| A | 6055 | 140 | 2.312139% |
| B | 6056 | 179 | 2.955746% |
| C | 6056 | 391 | 6.456407% |
| D | 6055 | 147 | 2.427746% |
Noise dominated data is calculated using 1-second bins in cleaned event files. If a bin has >2000 counts, and if more than 50% of those come from <1% of pixels, then it is considered to be noise-dominated and hence unusable.
| Quadrant | # 1 sec bins | Bins with >0 counts | Bins with >2000 counts | High rate bins dominated by noise | Noise dominated (total time) | Noise dominated (detector-on time) | Marked lightcurve |
|---|---|---|---|---|---|---|---|
| A | 7400 | 6055 | 31 | 31 | 0.42% | 0.51% | 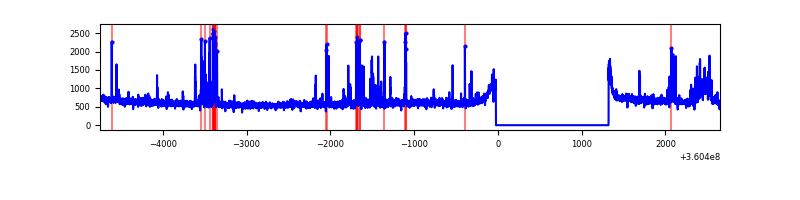 |
| B | 7401 | 6056 | 18 | 18 | 0.24% | 0.30% | 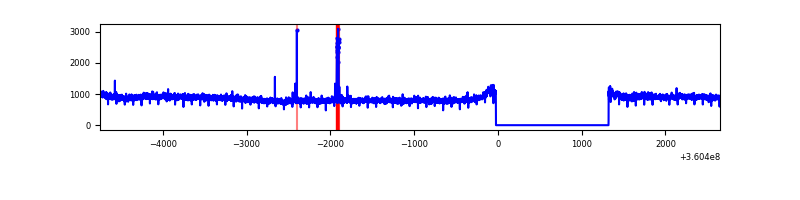 |
| C | 7401 | 6056 | 188 | 188 | 2.54% | 3.10% | 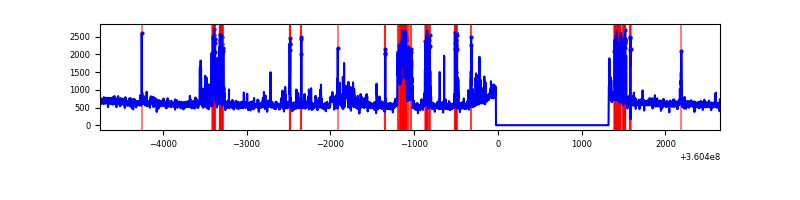 |
| D | 7400 | 6055 | 95 | 95 | 1.28% | 1.57% | 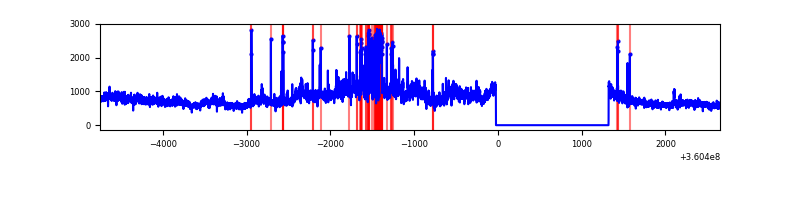 |
Top three noisy pixels from each quadrant. If the there are fewer than three noisy pixels in the level2.evt file, extra rows are filled as -1
| Pixel properties | Quadrant properties | ||||||
|---|---|---|---|---|---|---|---|
| Quadrant | DetID | PixID | Counts | Sigma | Mean | Median | Sigma |
| A | 0 | 13 | 332165 | 1858.64 | 906 | 894 | 178.2 |
| A | 8 | 192 | 218272 | 1219.63 | 906 | 894 | 178.2 |
| A | 13 | 254 | 11088 | 57.19 | 906 | 894 | 178.2 |
| B | 6 | 159 | 1655888 | 10042.28 | 890 | 872 | 164.8 |
| B | 0 | 229 | 44457 | 264.46 | 890 | 872 | 164.8 |
| B | 12 | 111 | 19180 | 111.09 | 890 | 872 | 164.8 |
| C | 10 | 22 | 873483 | 4580.07 | 827 | 837 | 190.5 |
| C | 14 | 238 | 138570 | 722.89 | 827 | 837 | 190.5 |
| C | 3 | 233 | 97797 | 508.89 | 827 | 837 | 190.5 |
| D | 8 | 195 | 1456709 | 6797.62 | 845 | 829 | 214.2 |
| D | 10 | 253 | 137540 | 638.31 | 845 | 829 | 214.2 |
| D | 13 | 249 | 73806 | 340.73 | 845 | 829 | 214.2 |
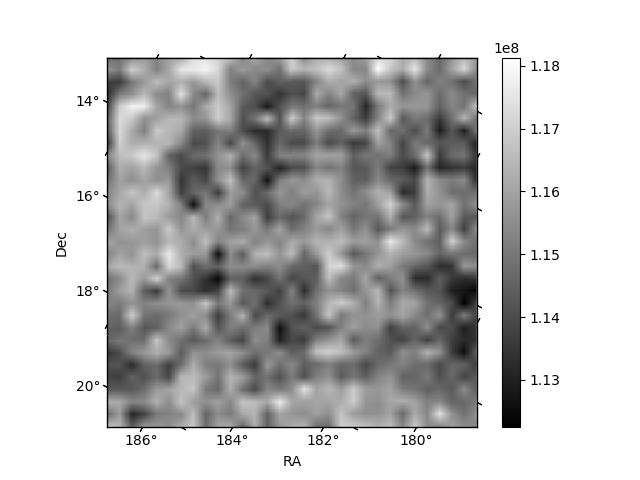
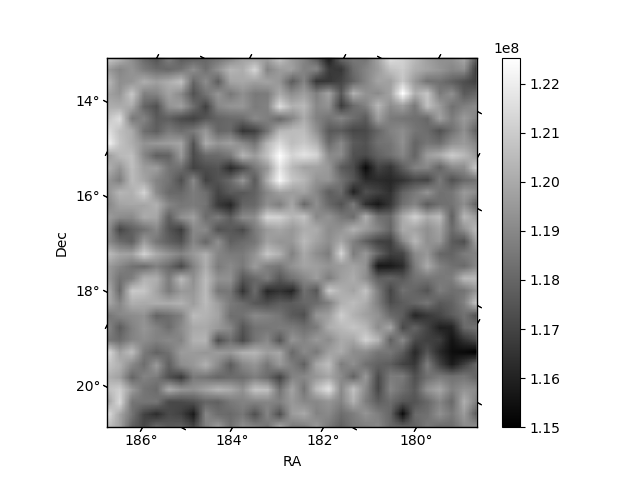
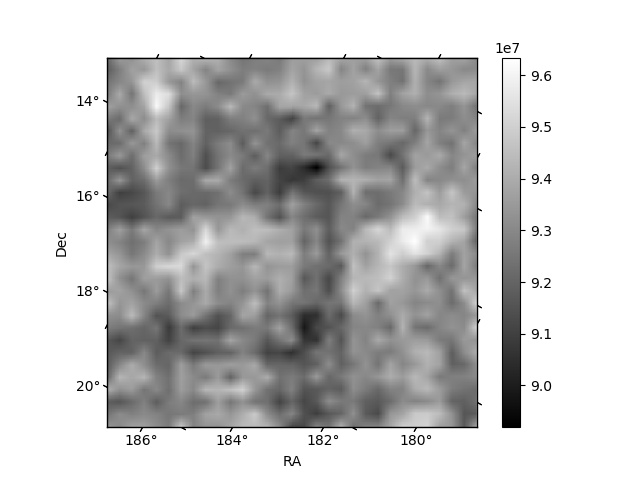
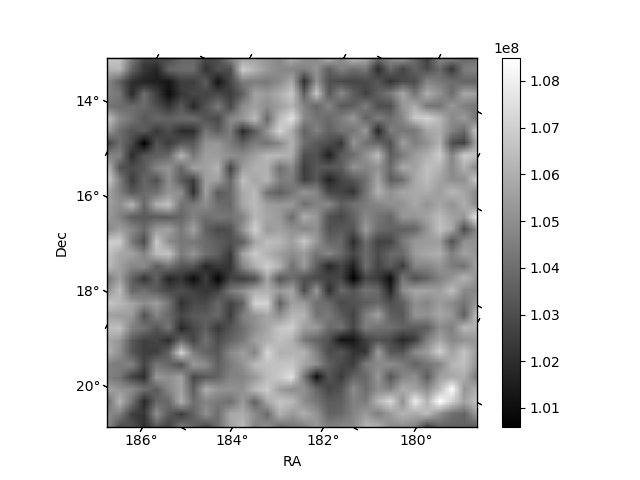
Histogram calculated using DETX and DETY for each event in the final _common_clean file
| Quadrant A |  |
 |
Quadrant B |
|---|---|---|---|
| Quadrant D |  |
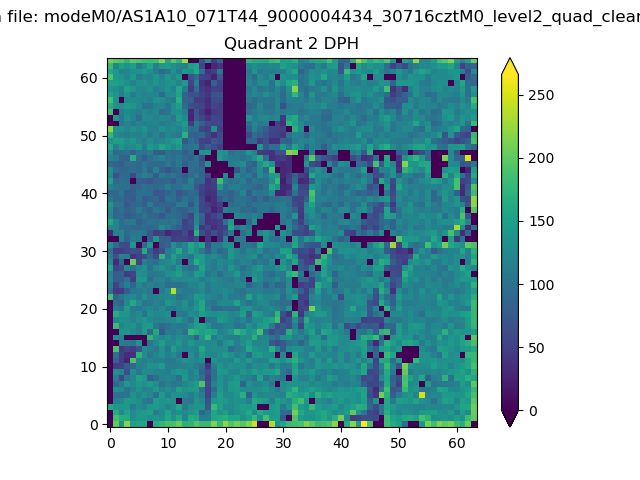 |
Quadrant C |
| Plot type | Count rate plots | Images |
|---|---|---|
| Comparison with Poisson distribution Blue bars denote a histogram of data divided into 1 sec bins. Red curve is a Poisson curve with rate = median count rate of data. |
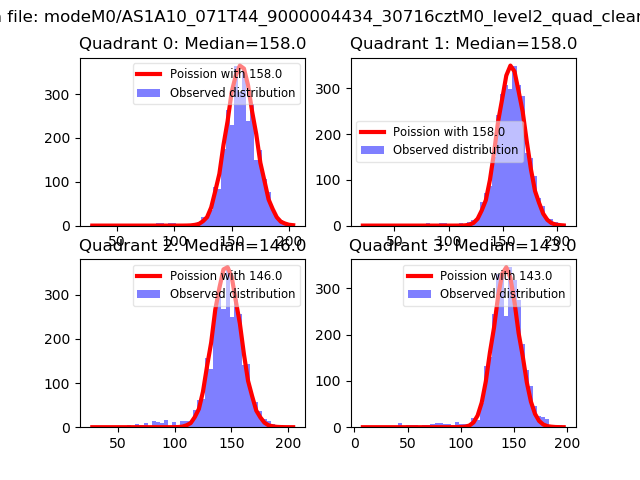 |
 |
| Quadrant-wise count rates Data is divided into 100 sec bins |
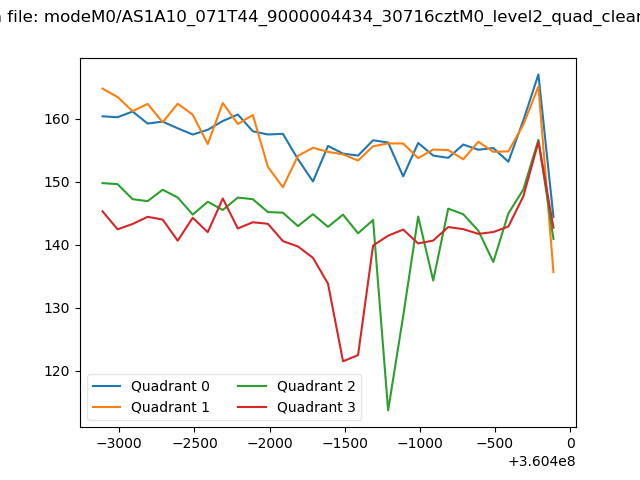 |
|
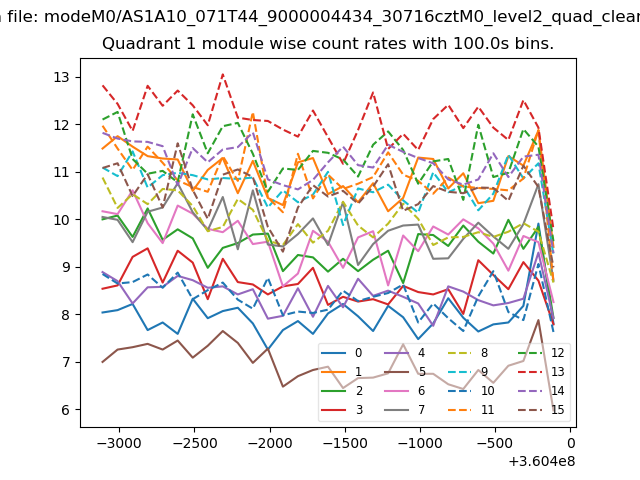
| Module-wise count rates for Quadrant A Data is divided into 100 sec bins |
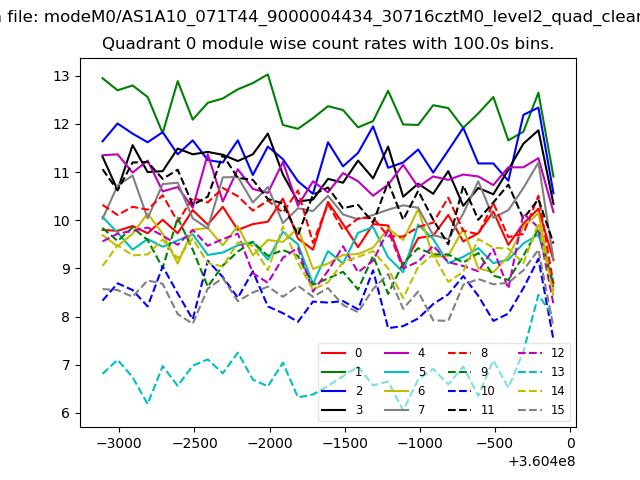 |
 |
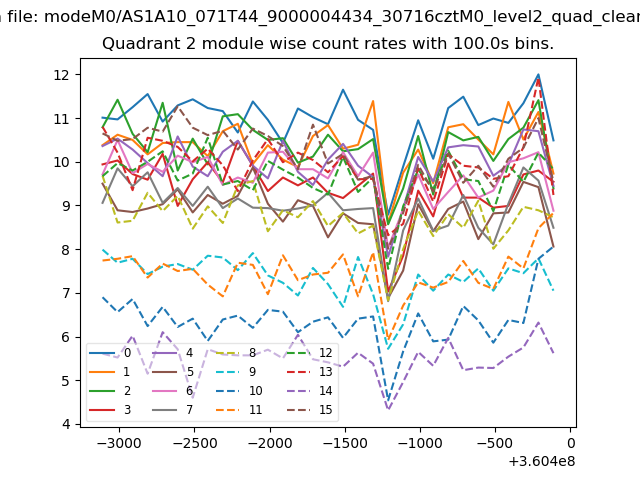
| Module-wise count rates for Quadrant B Data is divided into 100 sec bins |
 |
 |
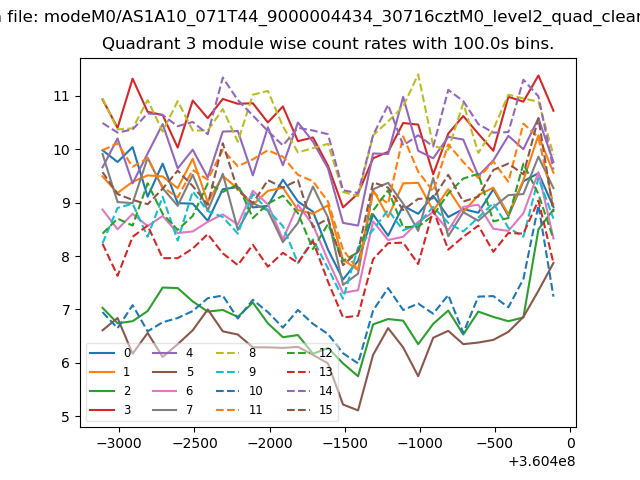
| Module-wise count rates for Quadrant C Data is divided into 100 sec bins |
 |
 |
| Module-wise count rates for Quadrant D Data is divided into 100 sec bins |
 |
 |
| Parameter | Plot |
|---|---|
| CZT HV Monitor | 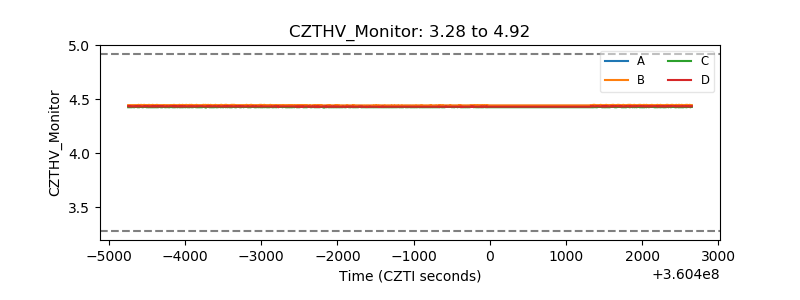 |
| D_VDD | 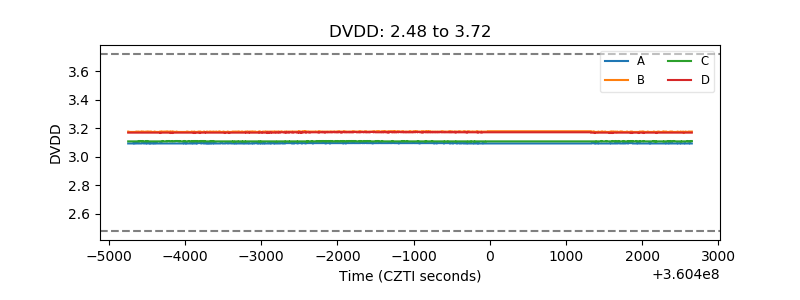 |
| Temperature 1 | 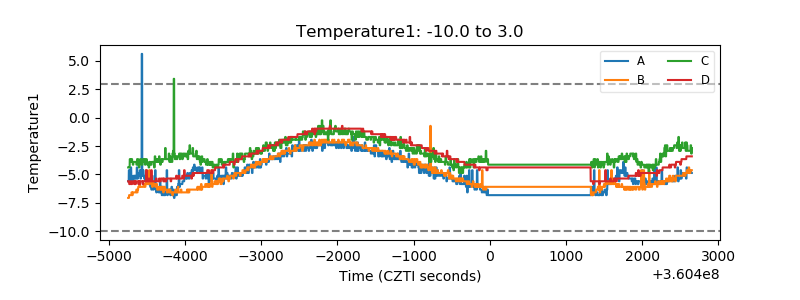 |
| Veto HV Monitor | 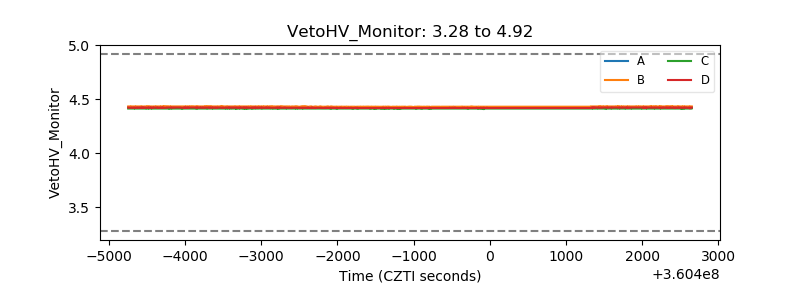 |
| Veto LLD | 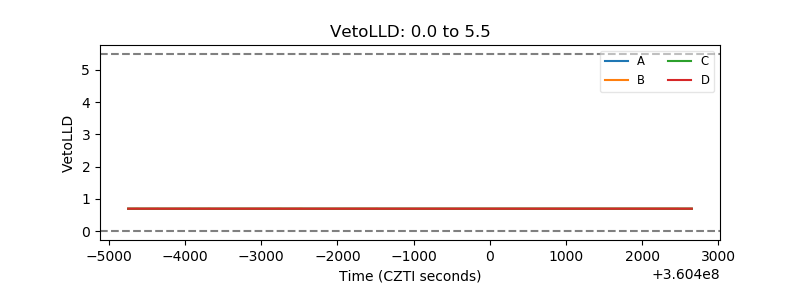 |
| Alpha Counter | 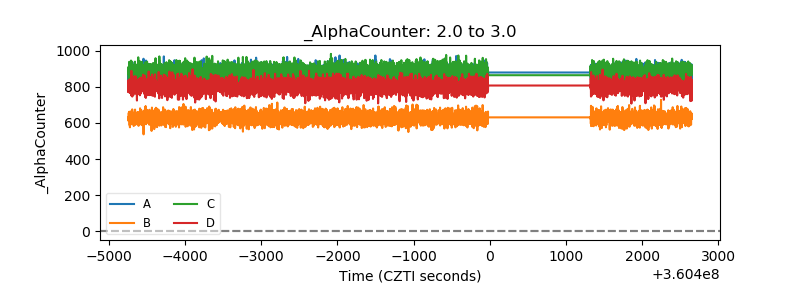 |
| _CPM_Rate | 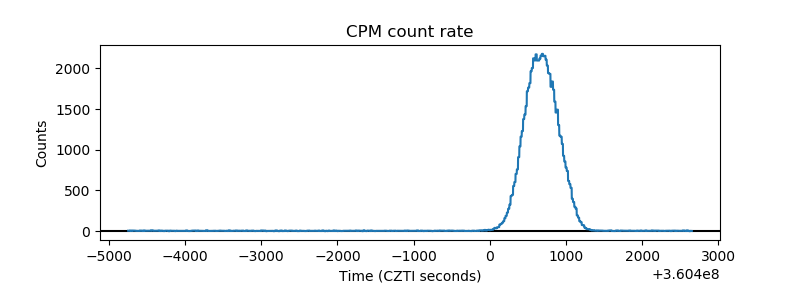 |
| CZT Counter | 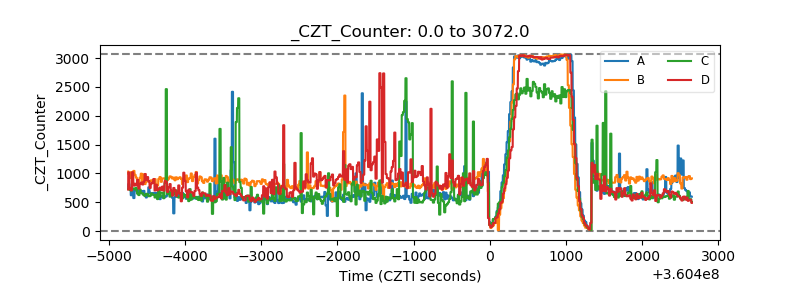 |
| +2.5 Volts monitor |  |
| +5 Volts monitor | 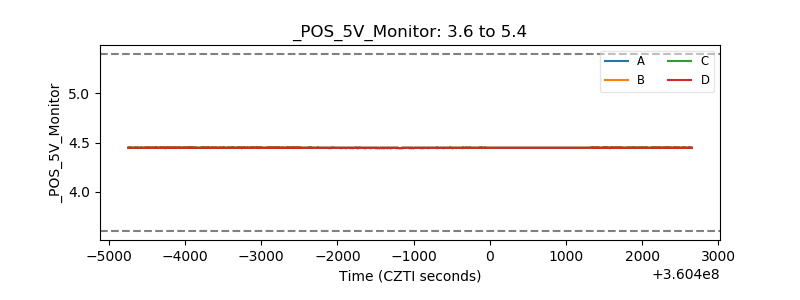 |
| _ROLL_ROT | 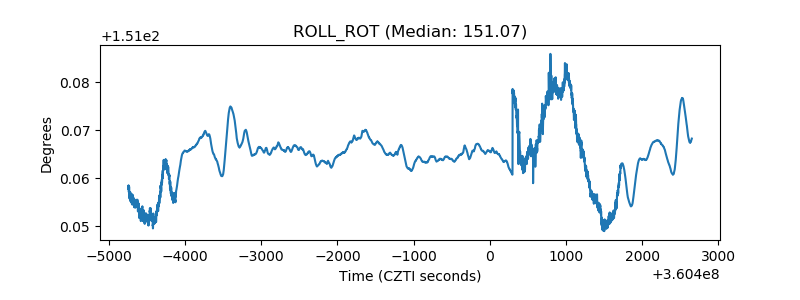 |
| _Roll_DEC | 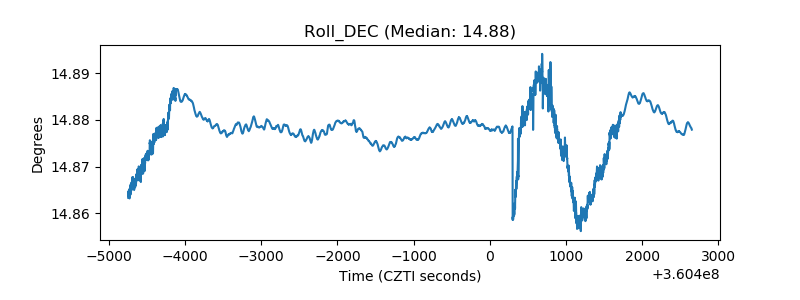 |
| _Roll_RA | 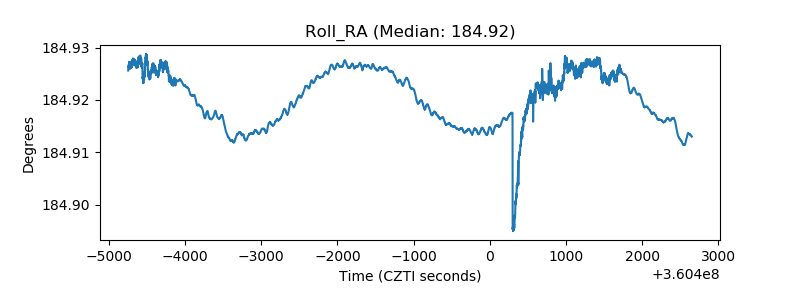 |
| Veto Counter | 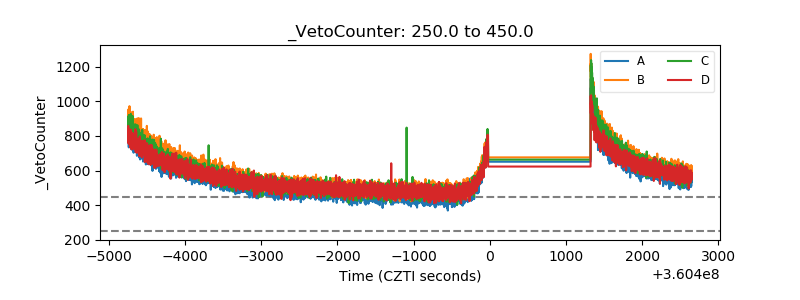 |