| Param | Original file | Final file |
|---|---|---|
| Filename | modeM0/AS1A10_071T44_9000004434_30717cztM0_level2.evt | modeM0/AS1A10_071T44_9000004434_30717cztM0_level2_quad_clean.evt |
| Size (bytes) | 648,849,600 | 90,319,680 |
| Size | 618.8 MB | 86.1 MB |
| Events in quadrant A | 4,155,263 | 606,803 |
| Events in quadrant B | 5,279,381 | 604,576 |
| Events in quadrant C | 4,134,675 | 564,243 |
| Events in quadrant D | 5,657,382 | 521,269 |
| Mode SS | |||
|---|---|---|---|
| Quadrant | BADHDUFLAG | Total packets | Discarded packets |
| A | 0 | 128 | 0 |
| B | 0 | 128 | 0 |
| C | 0 | 128 | 0 |
| D | 0 | 128 | 0 |
| Mode M0 | |||
|---|---|---|---|
| Quadrant | BADHDUFLAG | Total packets | Discarded packets |
| A | 0 | 17044 | 2 |
| B | 0 | 19574 | 2 |
| C | 0 | 16386 | 2 |
| D | 0 | 21434 | 2 |
| Mode M9 | |||
|---|---|---|---|
| Quadrant | BADHDUFLAG | Total packets | Discarded packets |
| A | 0 | 19 | 0 |
| B | 0 | 20 | 0 |
| C | 0 | 20 | 0 |
| D | 0 | 20 | 0 |
| Quadrant | Total seconds | Saturated seconds | Saturation percentage |
|---|---|---|---|
| A | 6276 | 144 | 2.294455% |
| B | 6276 | 179 | 2.852135% |
| C | 6276 | 269 | 4.286170% |
| D | 6276 | 496 | 7.903123% |
Noise dominated data is calculated using 1-second bins in cleaned event files. If a bin has >2000 counts, and if more than 50% of those come from <1% of pixels, then it is considered to be noise-dominated and hence unusable.
| Quadrant | # 1 sec bins | Bins with >0 counts | Bins with >2000 counts | High rate bins dominated by noise | Noise dominated (total time) | Noise dominated (detector-on time) | Marked lightcurve |
|---|---|---|---|---|---|---|---|
| A | 7611 | 6276 | 7 | 7 | 0.09% | 0.11% | 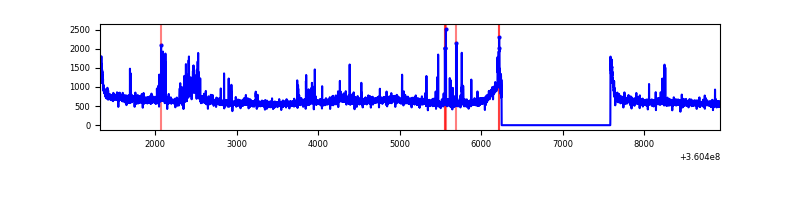 |
| B | 7611 | 6276 | 0 | 0 | 0.00% | 0.00% | 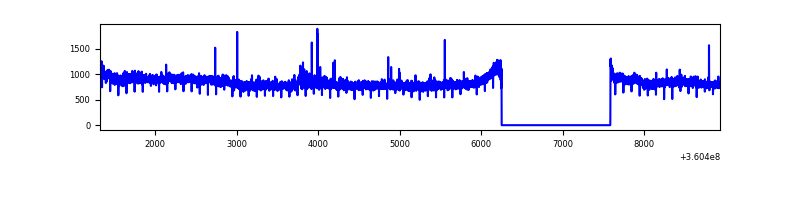 |
| C | 7611 | 6276 | 79 | 79 | 1.04% | 1.26% | 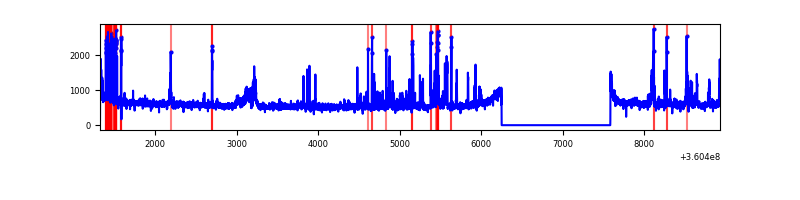 |
| D | 7611 | 6276 | 443 | 443 | 5.82% | 7.06% | 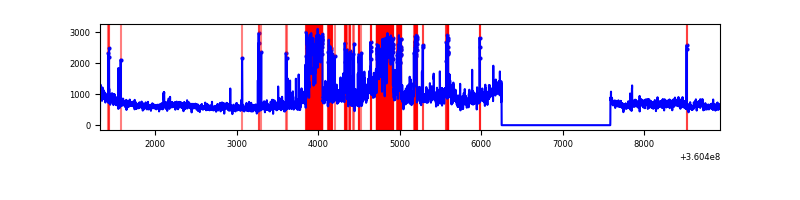 |
Top three noisy pixels from each quadrant. If the there are fewer than three noisy pixels in the level2.evt file, extra rows are filled as -1
| Pixel properties | Quadrant properties | ||||||
|---|---|---|---|---|---|---|---|
| Quadrant | DetID | PixID | Counts | Sigma | Mean | Median | Sigma |
| A | 8 | 192 | 369123 | 2034.38 | 919 | 909 | 181.0 |
| A | 0 | 13 | 242159 | 1332.91 | 919 | 909 | 181.0 |
| A | 13 | 254 | 11459 | 58.29 | 919 | 909 | 181.0 |
| B | 6 | 159 | 1705741 | 10112.07 | 900 | 882 | 168.6 |
| B | 12 | 111 | 20026 | 113.55 | 900 | 882 | 168.6 |
| B | 11 | 111 | 18177 | 102.58 | 900 | 882 | 168.6 |
| C | 10 | 22 | 444476 | 2261.93 | 849 | 856 | 196.1 |
| C | 3 | 233 | 160370 | 813.33 | 849 | 856 | 196.1 |
| C | 14 | 238 | 140927 | 714.19 | 849 | 856 | 196.1 |
| D | 8 | 195 | 1220714 | 6186.16 | 847 | 831 | 197.2 |
| D | 10 | 253 | 677276 | 3430.32 | 847 | 831 | 197.2 |
| D | 2 | 250 | 196367 | 991.58 | 847 | 831 | 197.2 |
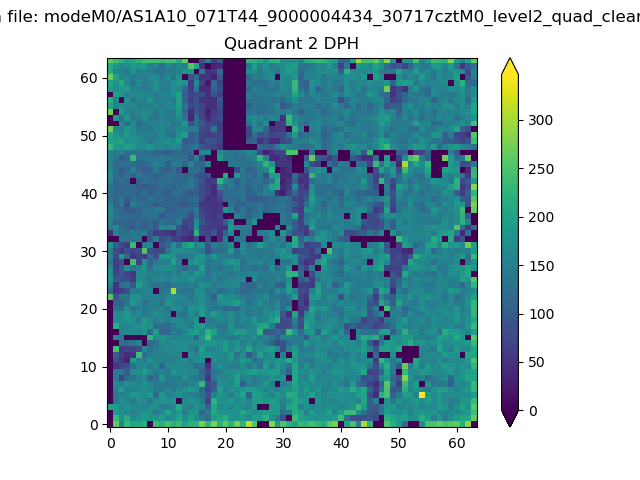
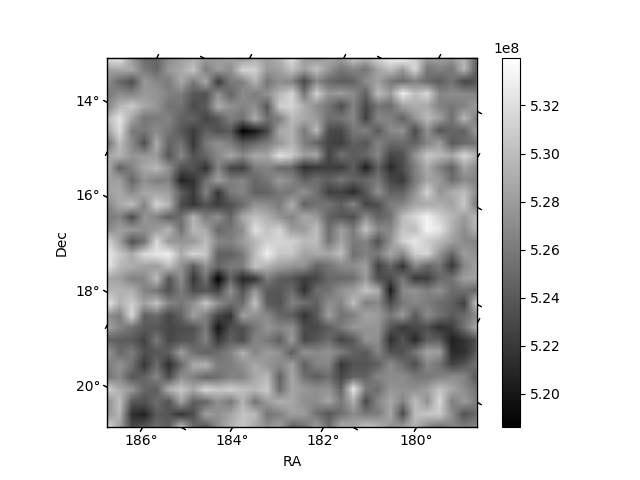
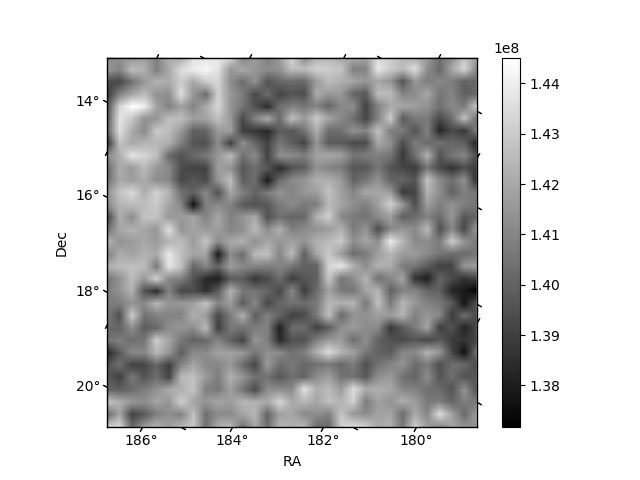
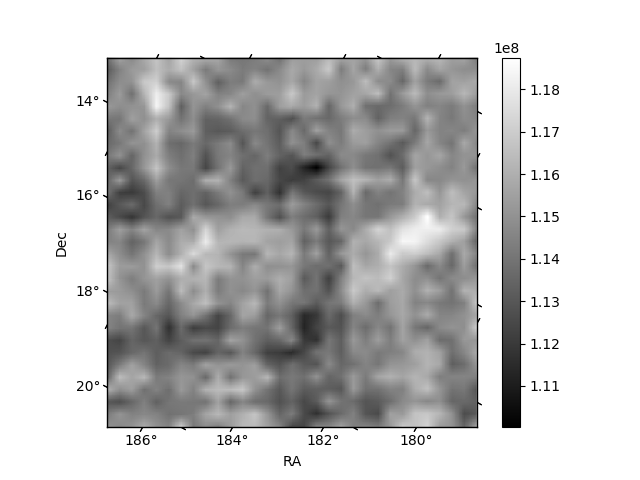
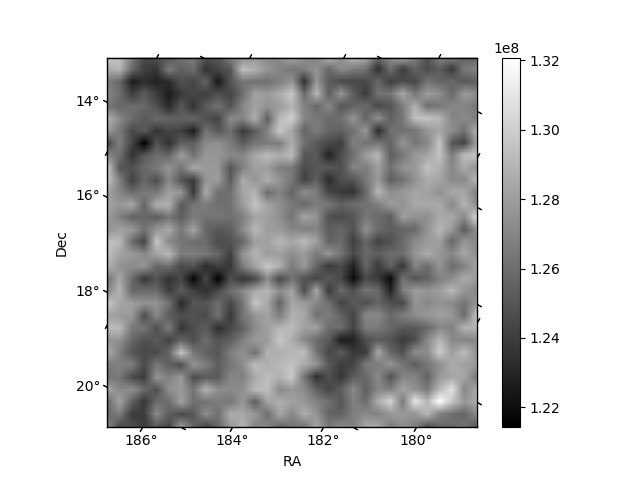
Histogram calculated using DETX and DETY for each event in the final _common_clean file
| Quadrant A | 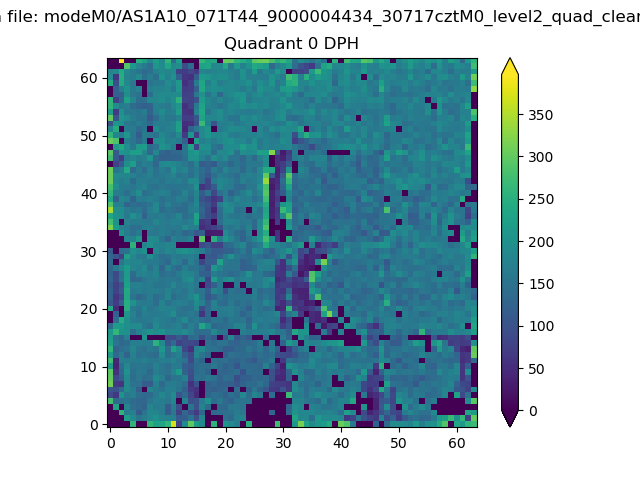 |
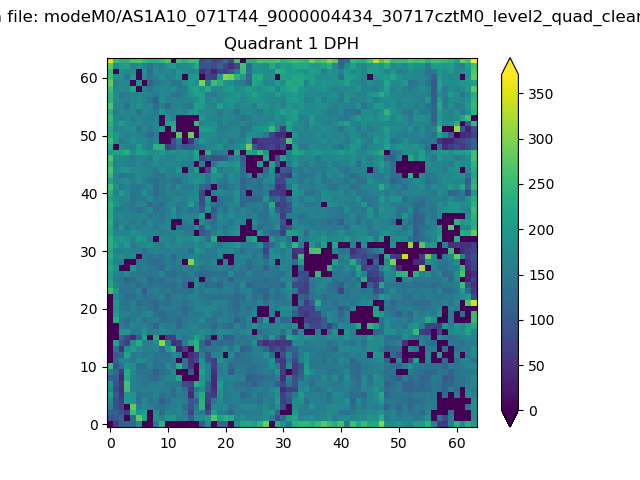 |
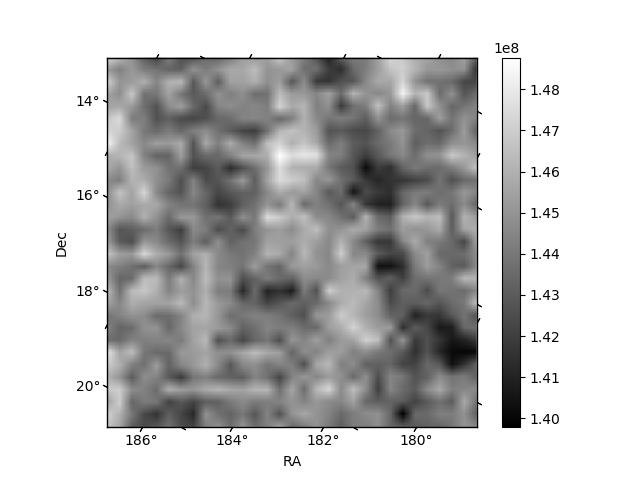
Quadrant B |
|---|---|---|---|
| Quadrant D | 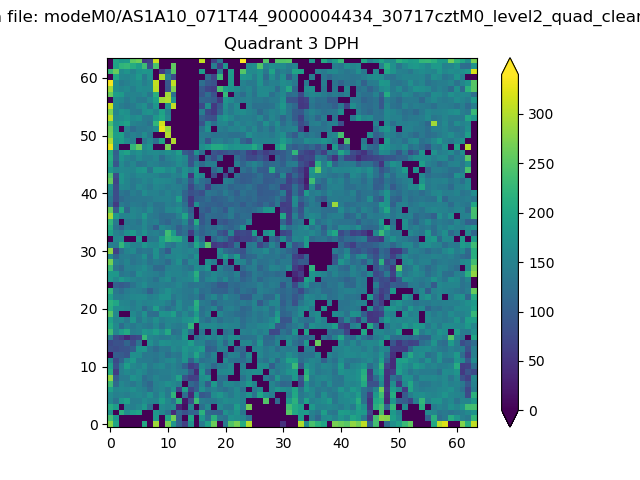 |
 |
Quadrant C |
| Plot type | Count rate plots | Images |
|---|---|---|
| Comparison with Poisson distribution Blue bars denote a histogram of data divided into 1 sec bins. Red curve is a Poisson curve with rate = median count rate of data. |
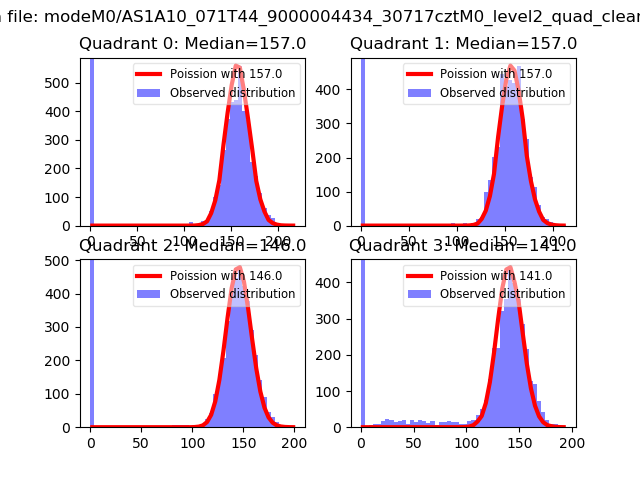 |
 |
| Quadrant-wise count rates Data is divided into 100 sec bins |
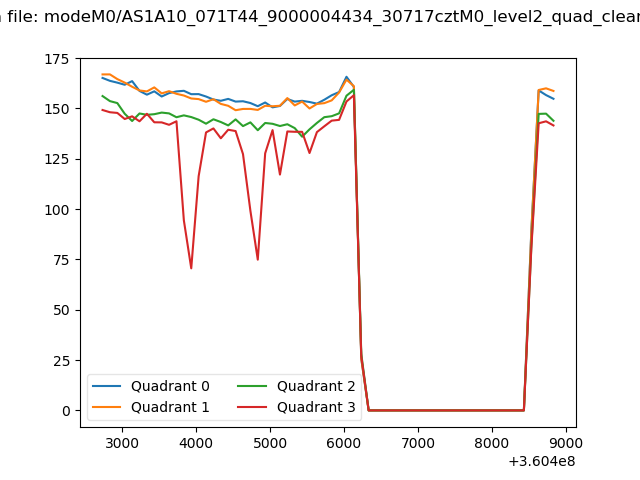 |
|
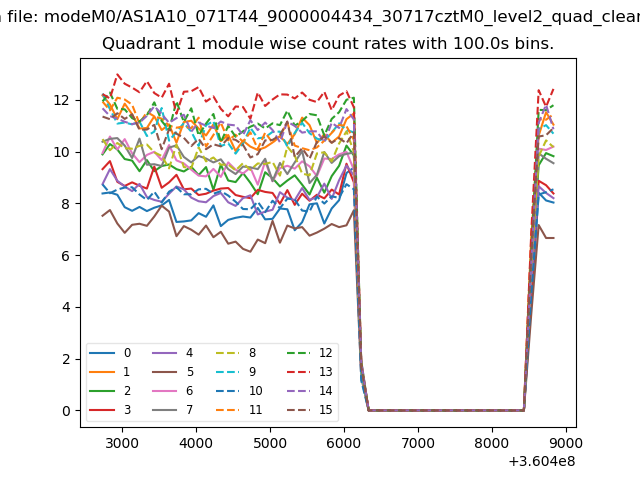
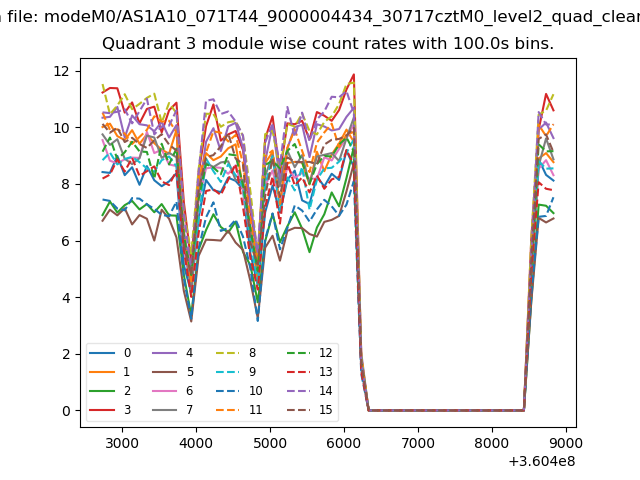
| Module-wise count rates for Quadrant A Data is divided into 100 sec bins |
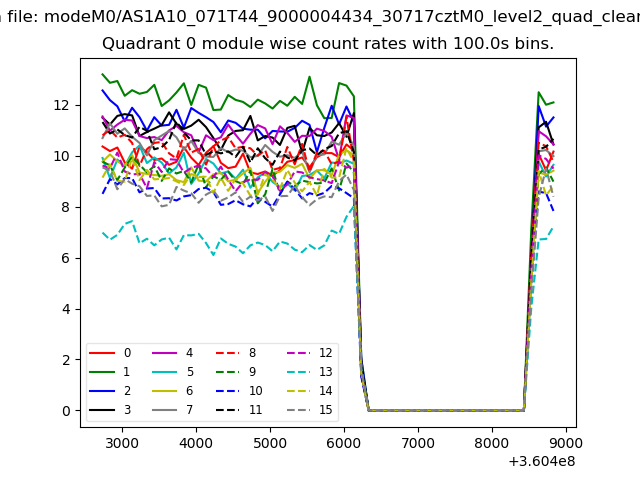 |
 |
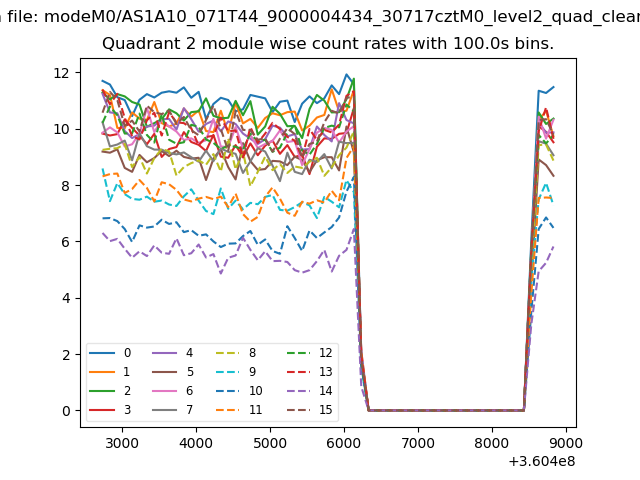
| Module-wise count rates for Quadrant B Data is divided into 100 sec bins |
 |
 |
| Module-wise count rates for Quadrant C Data is divided into 100 sec bins |
 |
 |
| Module-wise count rates for Quadrant D Data is divided into 100 sec bins |
 |
 |
| Parameter | Plot |
|---|---|
| CZT HV Monitor | 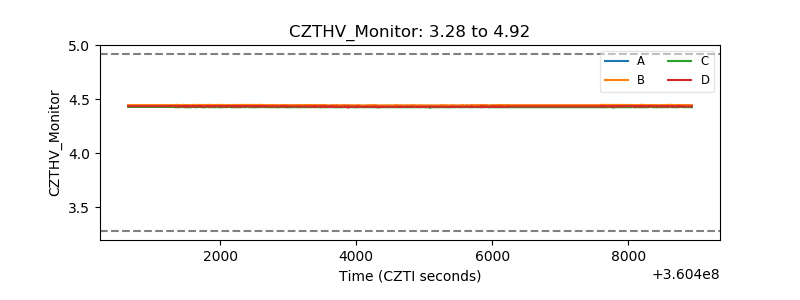 |
| D_VDD | 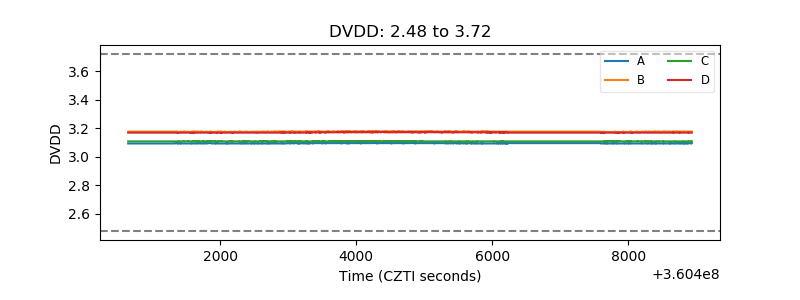 |
| Temperature 1 | 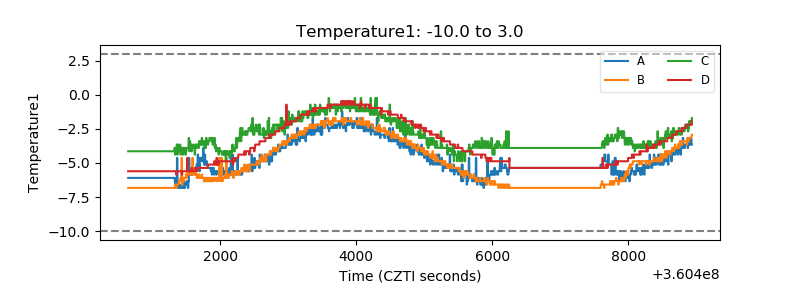 |
| Veto HV Monitor | 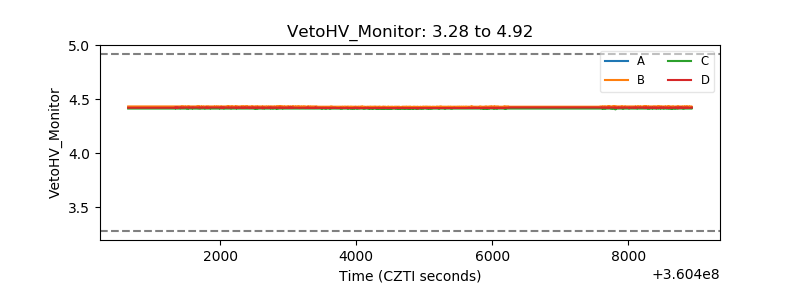 |
| Veto LLD | 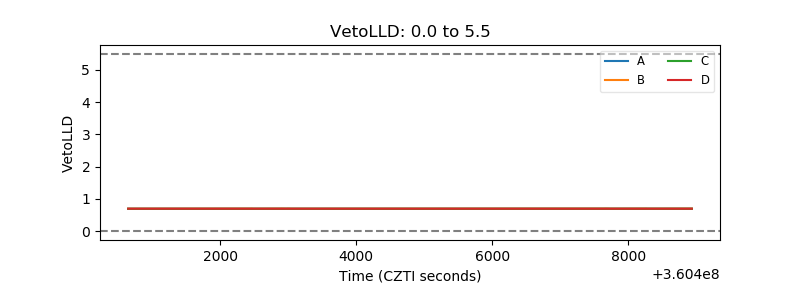 |
| Alpha Counter | 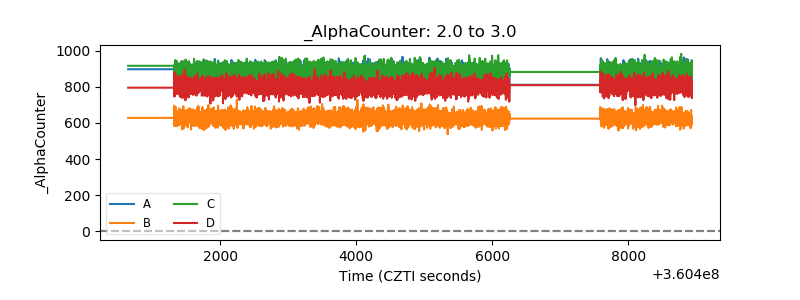 |
| _CPM_Rate | 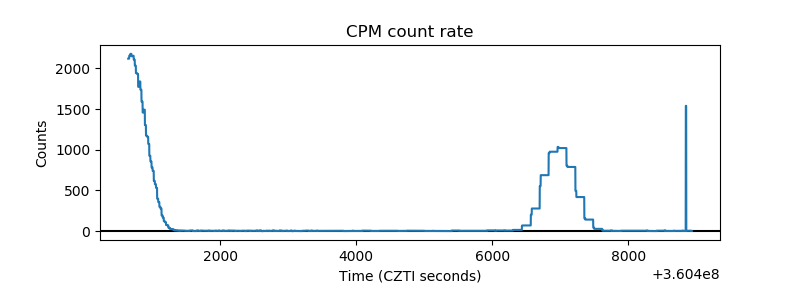 |
| CZT Counter | 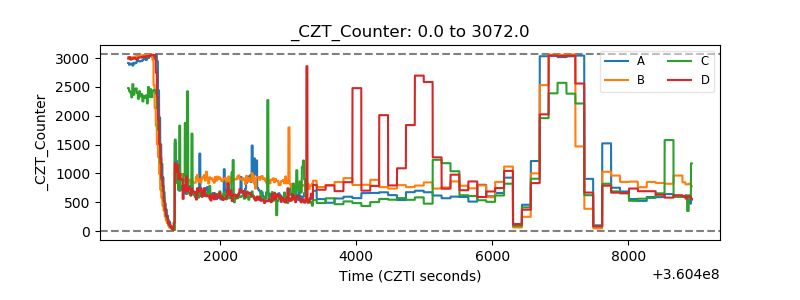 |
| +2.5 Volts monitor |  |
| +5 Volts monitor | 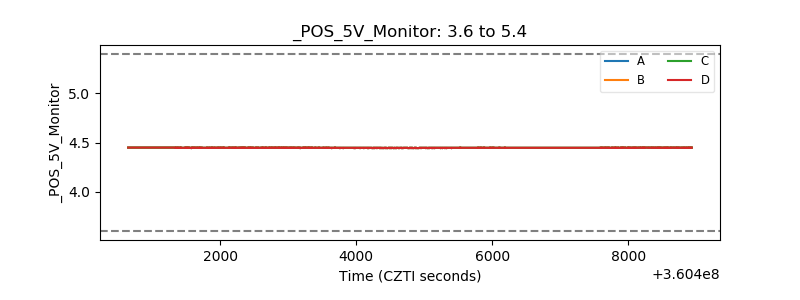 |
| _ROLL_ROT | 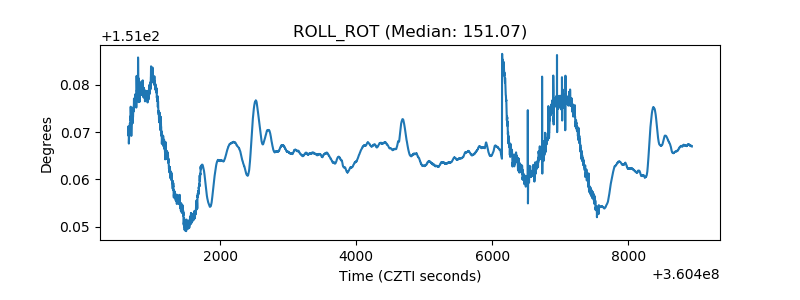 |
| _Roll_DEC | 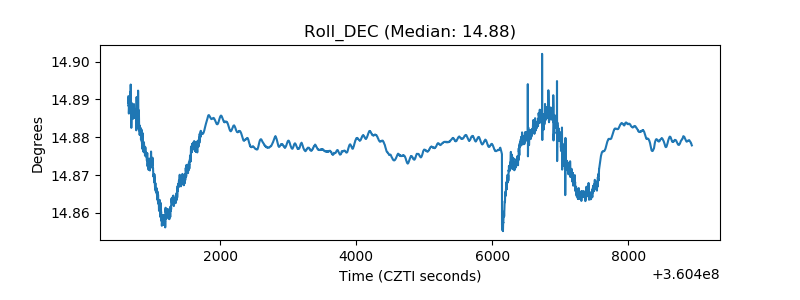 |
| _Roll_RA | 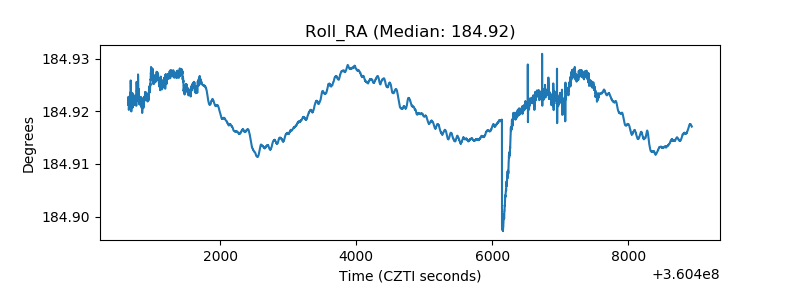 |
| Veto Counter | 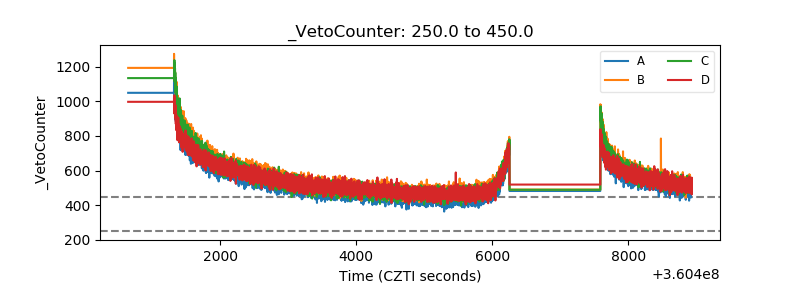 |