| Param | Original file | Final file |
|---|---|---|
| Filename | modeM0/AS1A10_071T44_9000004434_30718cztM0_level2.evt | modeM0/AS1A10_071T44_9000004434_30718cztM0_level2_quad_clean.evt |
| Size (bytes) | 706,472,640 | 95,659,200 |
| Size | 673.7 MB | 91.2 MB |
| Events in quadrant A | 3,884,545 | 649,309 |
| Events in quadrant B | 6,104,960 | 632,472 |
| Events in quadrant C | 5,140,183 | 591,463 |
| Events in quadrant D | 5,824,633 | 566,957 |
| Mode SS | |||
|---|---|---|---|
| Quadrant | BADHDUFLAG | Total packets | Discarded packets |
| A | 0 | 132 | 0 |
| B | 0 | 132 | 0 |
| C | 0 | 132 | 0 |
| D | 0 | 132 | 0 |
| Mode M0 | |||
|---|---|---|---|
| Quadrant | BADHDUFLAG | Total packets | Discarded packets |
| A | 0 | 15367 | 2 |
| B | 0 | 22470 | 2 |
| C | 0 | 19749 | 2 |
| D | 0 | 22249 | 2 |
| Mode M9 | |||
|---|---|---|---|
| Quadrant | BADHDUFLAG | Total packets | Discarded packets |
| A | 0 | 14 | 0 |
| B | 0 | 15 | 0 |
| C | 0 | 15 | 0 |
| D | 0 | 15 | 0 |
| Quadrant | Total seconds | Saturated seconds | Saturation percentage |
|---|---|---|---|
| A | 6547 | 187 | 2.856270% |
| B | 6547 | 381 | 5.819459% |
| C | 6547 | 566 | 8.645181% |
| D | 6547 | 477 | 7.285780% |
Noise dominated data is calculated using 1-second bins in cleaned event files. If a bin has >2000 counts, and if more than 50% of those come from <1% of pixels, then it is considered to be noise-dominated and hence unusable.
| Quadrant | # 1 sec bins | Bins with >0 counts | Bins with >2000 counts | High rate bins dominated by noise | Noise dominated (total time) | Noise dominated (detector-on time) | Marked lightcurve |
|---|---|---|---|---|---|---|---|
| A | 7632 | 6547 | 16 | 16 | 0.21% | 0.24% | 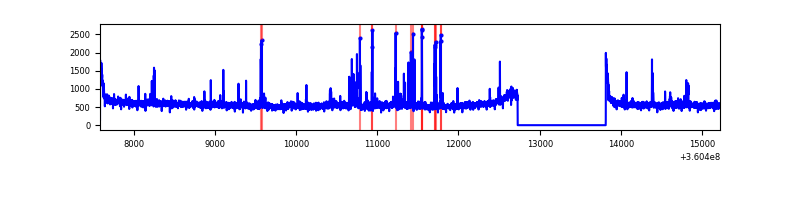 |
| B | 7632 | 6547 | 126 | 126 | 1.65% | 1.92% | 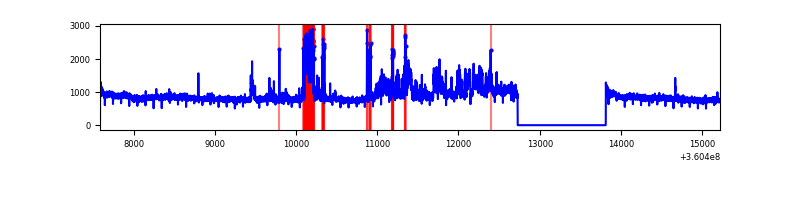 |
| C | 7632 | 6547 | 156 | 156 | 2.04% | 2.38% | 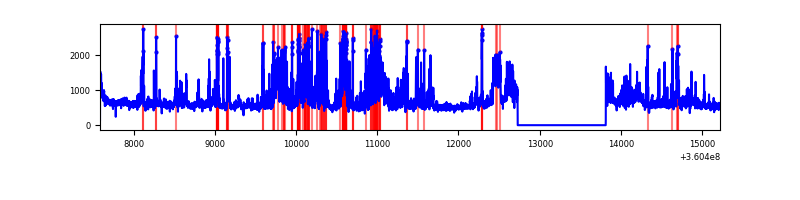 |
| D | 7632 | 6547 | 397 | 397 | 5.20% | 6.06% | 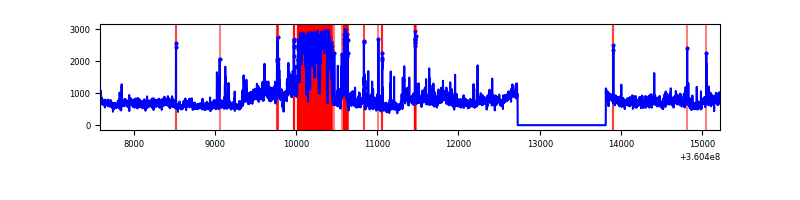 |
Top three noisy pixels from each quadrant. If the there are fewer than three noisy pixels in the level2.evt file, extra rows are filled as -1
| Pixel properties | Quadrant properties | ||||||
|---|---|---|---|---|---|---|---|
| Quadrant | DetID | PixID | Counts | Sigma | Mean | Median | Sigma |
| A | 8 | 192 | 197876 | 1096.85 | 909 | 895 | 179.6 |
| A | 0 | 13 | 181691 | 1006.73 | 909 | 895 | 179.6 |
| A | 13 | 254 | 12514 | 64.7 | 909 | 895 | 179.6 |
| B | 6 | 159 | 1756830 | 10539.32 | 878 | 857 | 166.6 |
| B | 6 | 36 | 573603 | 3437.61 | 878 | 857 | 166.6 |
| B | 5 | 255 | 265880 | 1590.66 | 878 | 857 | 166.6 |
| C | 3 | 233 | 1459212 | 7482.39 | 834 | 841 | 194.9 |
| C | 10 | 22 | 246349 | 1259.62 | 834 | 841 | 194.9 |
| C | 14 | 238 | 135611 | 691.46 | 834 | 841 | 194.9 |
| D | 8 | 195 | 1473902 | 7405.31 | 849 | 830 | 198.9 |
| D | 10 | 253 | 808545 | 4060.48 | 849 | 830 | 198.9 |
| D | 13 | 249 | 180936 | 905.41 | 849 | 830 | 198.9 |
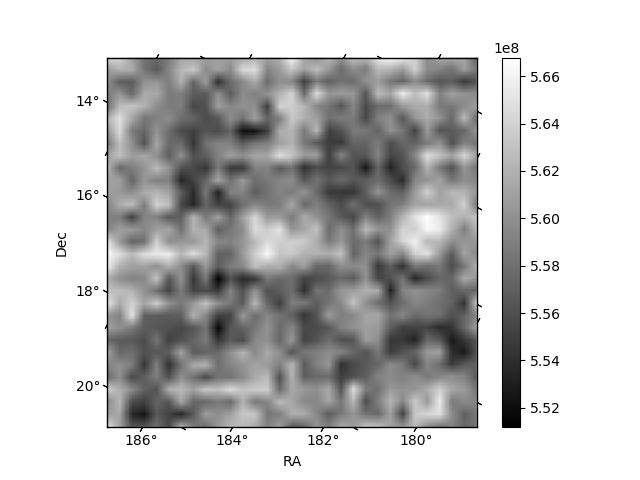
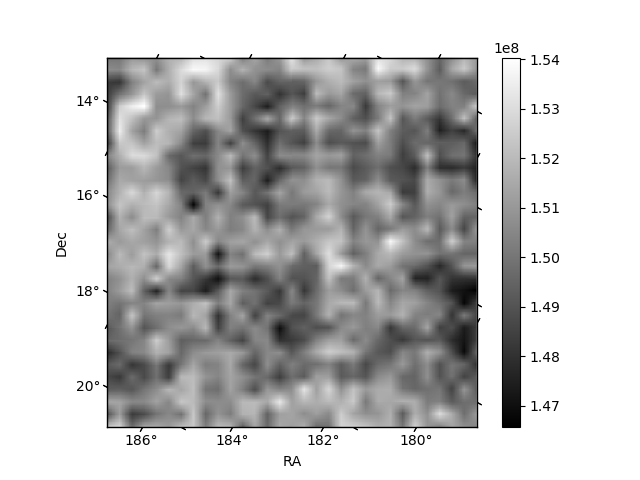
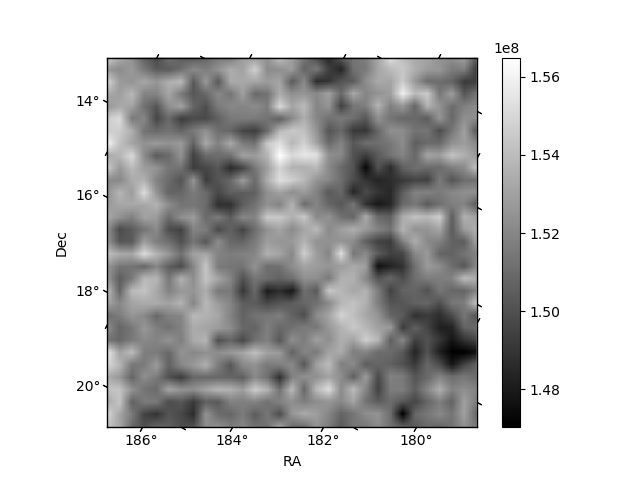
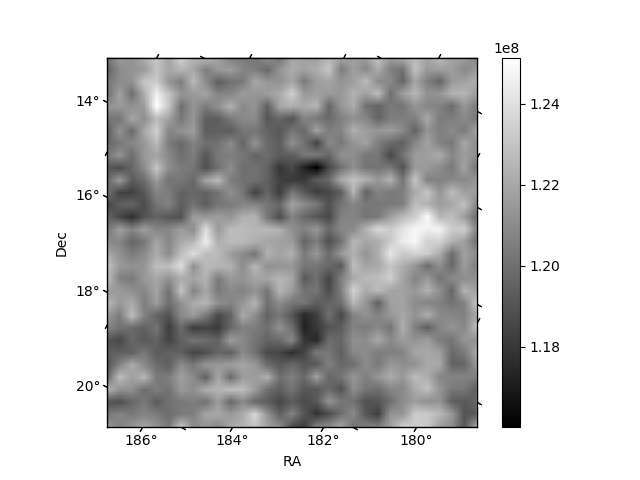
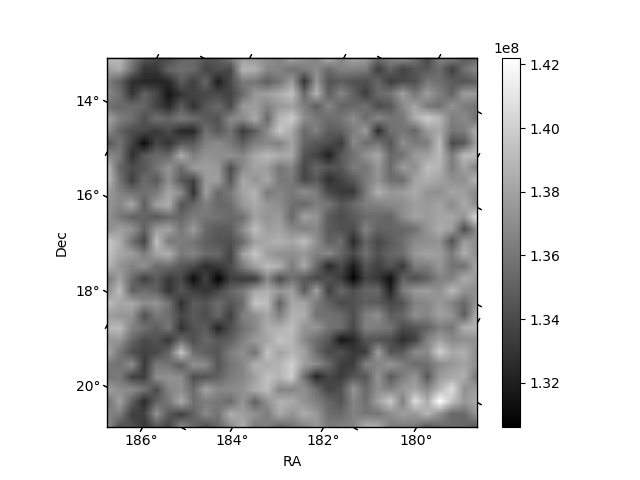
Histogram calculated using DETX and DETY for each event in the final _common_clean file
| Quadrant A | 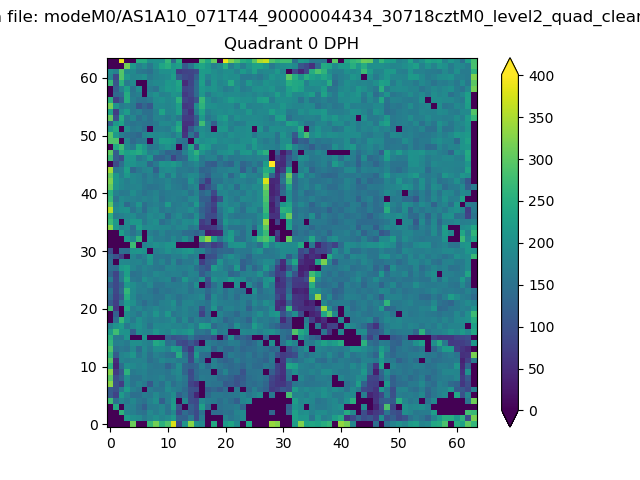 |
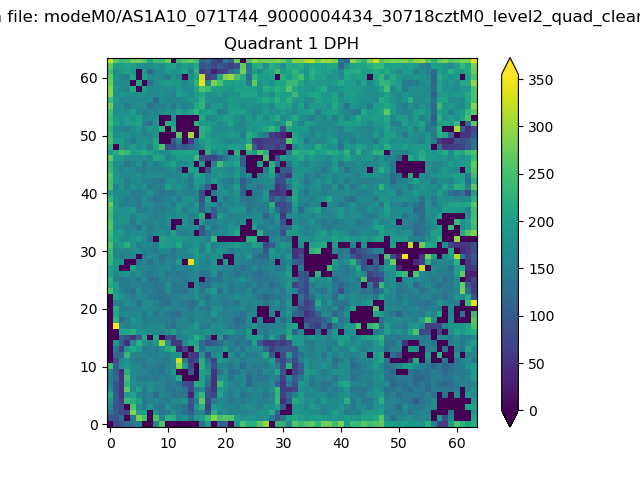 |
Quadrant B |
|---|---|---|---|
| Quadrant D | 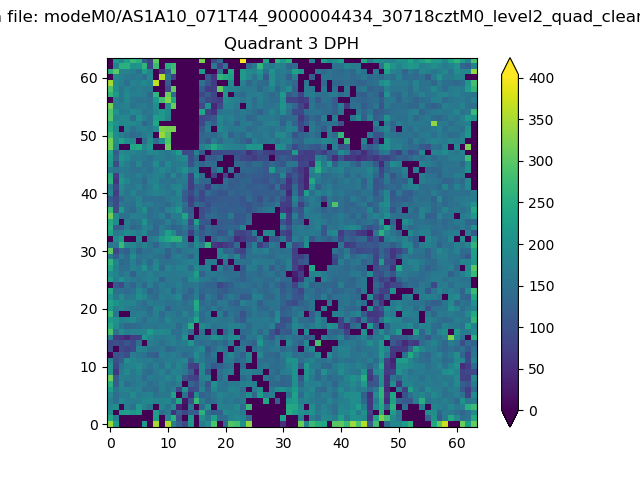 |
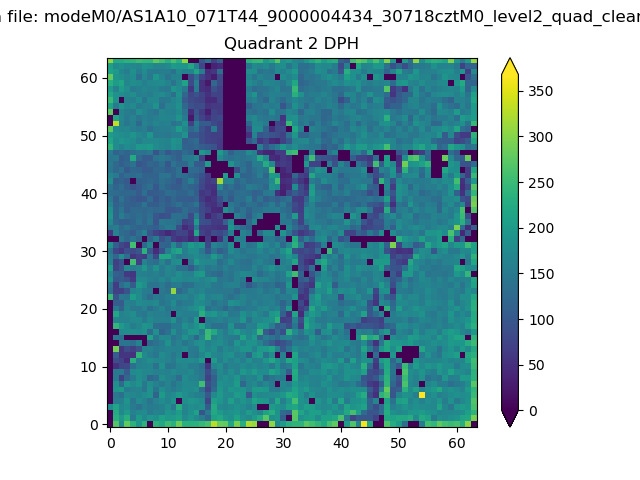 |
Quadrant C |
| Plot type | Count rate plots | Images |
|---|---|---|
| Comparison with Poisson distribution Blue bars denote a histogram of data divided into 1 sec bins. Red curve is a Poisson curve with rate = median count rate of data. |
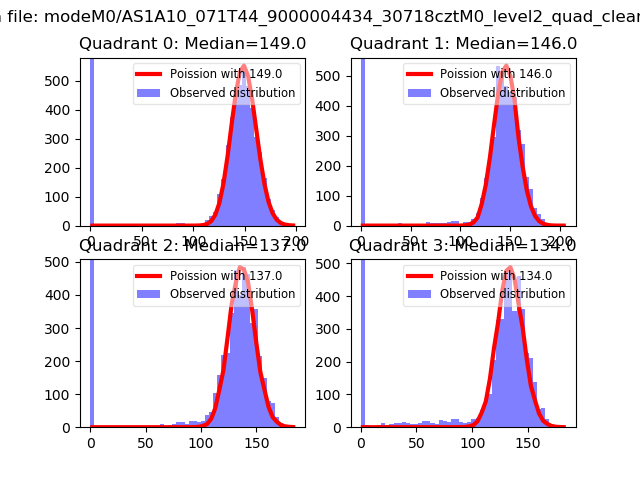 |
 |
| Quadrant-wise count rates Data is divided into 100 sec bins |
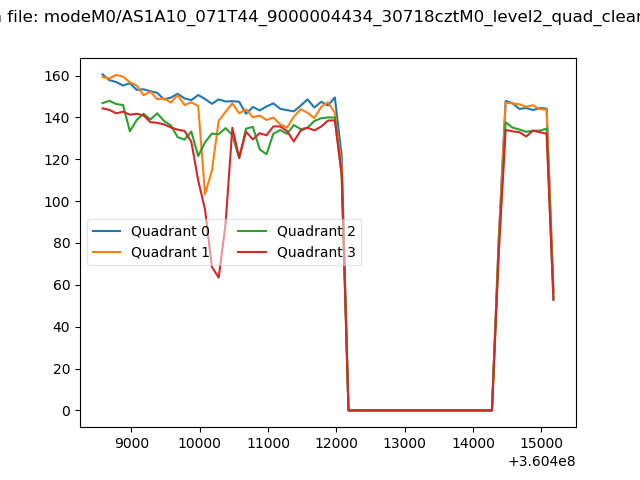 |
|
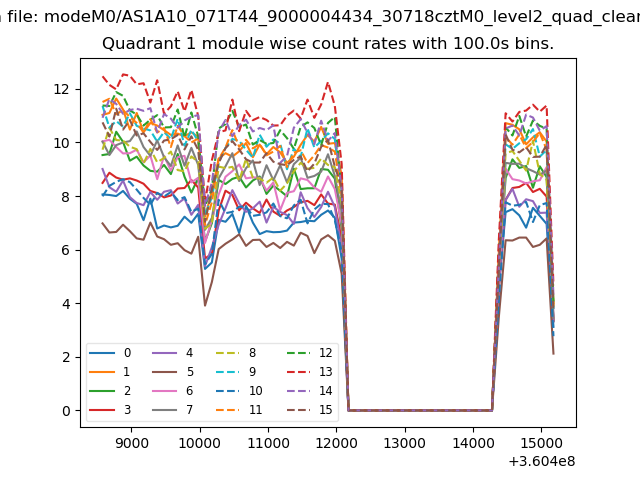
| Module-wise count rates for Quadrant A Data is divided into 100 sec bins |
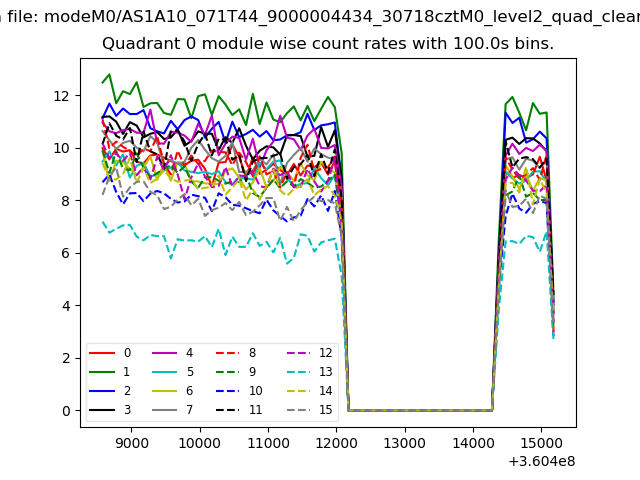 |
 |
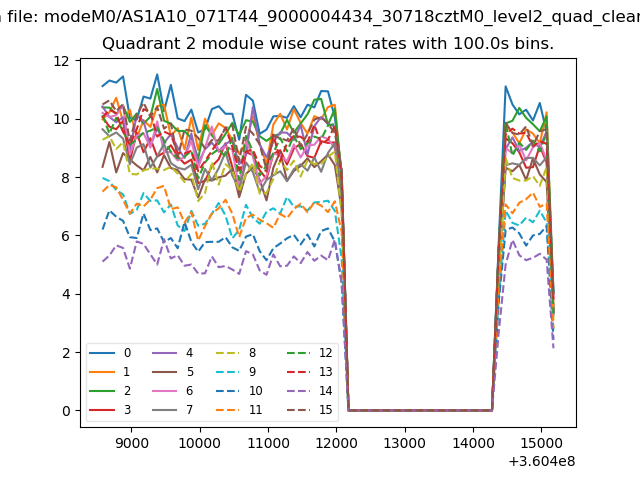
| Module-wise count rates for Quadrant B Data is divided into 100 sec bins |
 |
 |
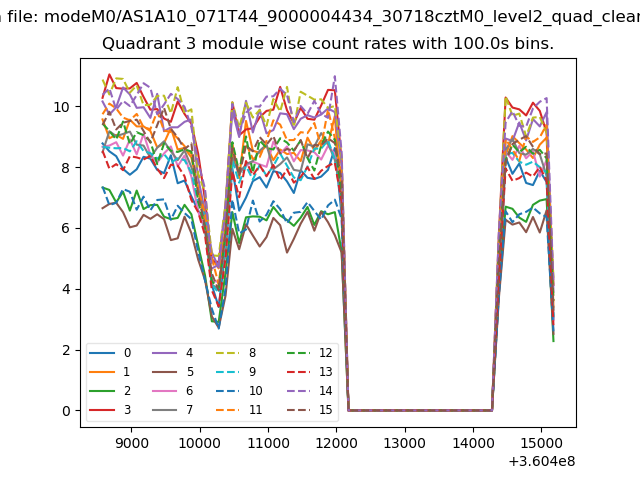
| Module-wise count rates for Quadrant C Data is divided into 100 sec bins |
 |
 |
| Module-wise count rates for Quadrant D Data is divided into 100 sec bins |
 |
 |
| Parameter | Plot |
|---|---|
| CZT HV Monitor | 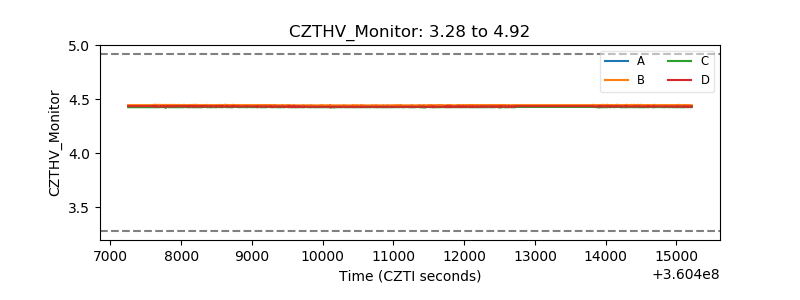 |
| D_VDD | 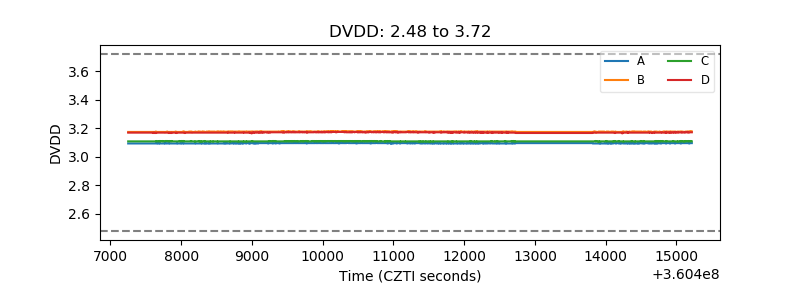 |
| Temperature 1 | 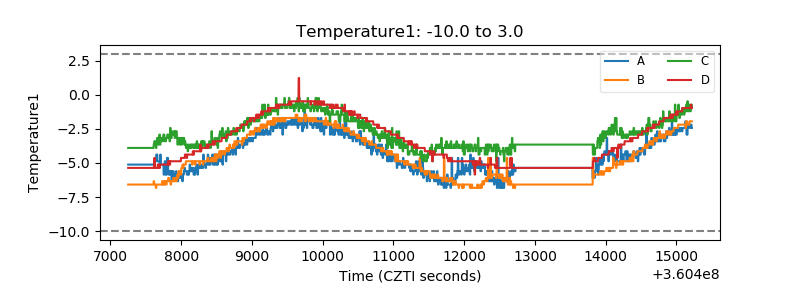 |
| Veto HV Monitor | 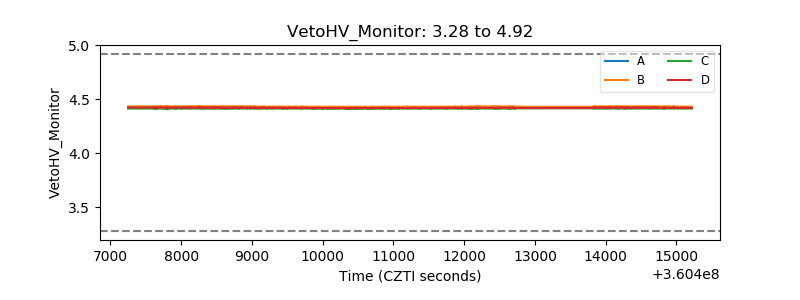 |
| Veto LLD | 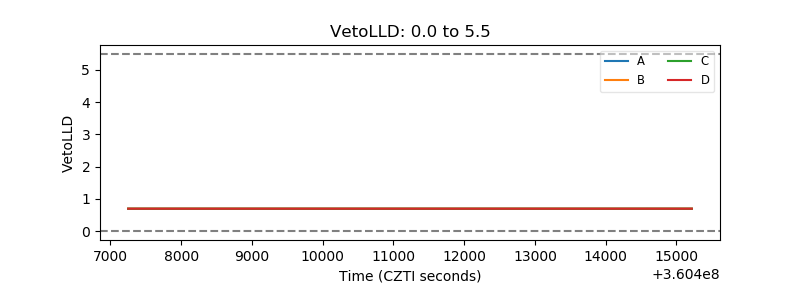 |
| Alpha Counter | 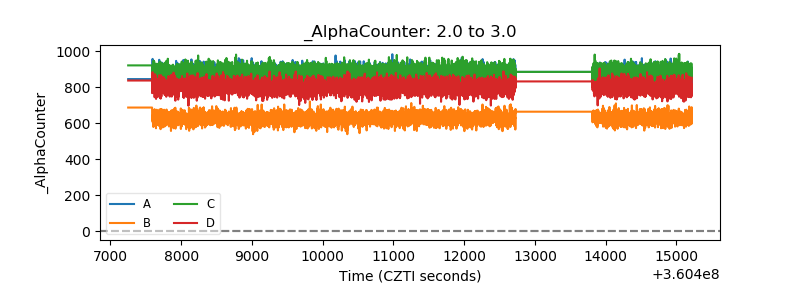 |
| _CPM_Rate | 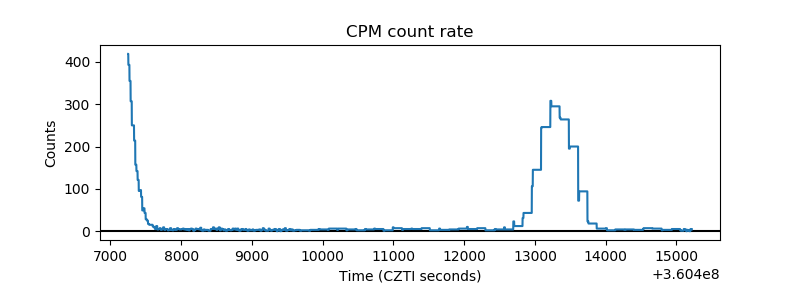 |
| CZT Counter | 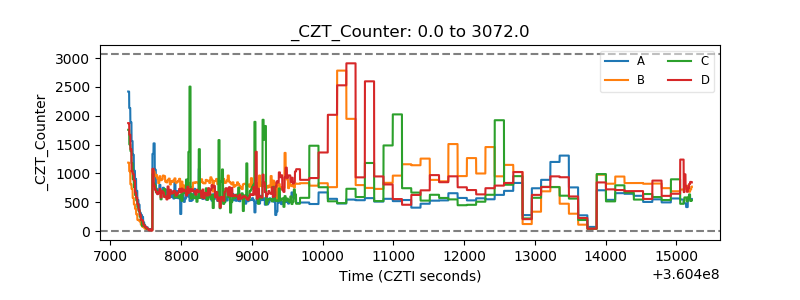 |
| +2.5 Volts monitor |  |
| +5 Volts monitor | 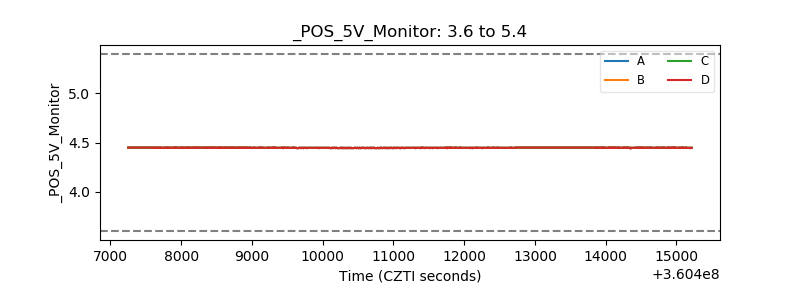 |
| _ROLL_ROT | 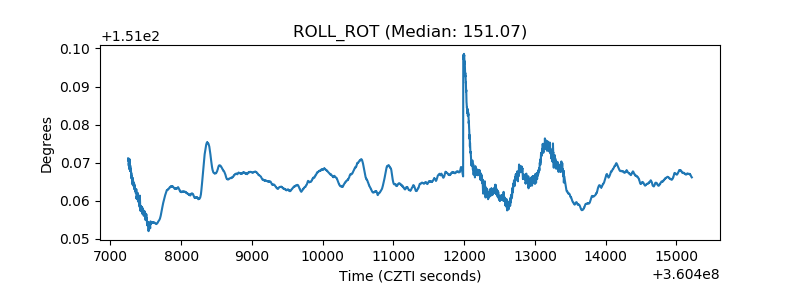 |
| _Roll_DEC | 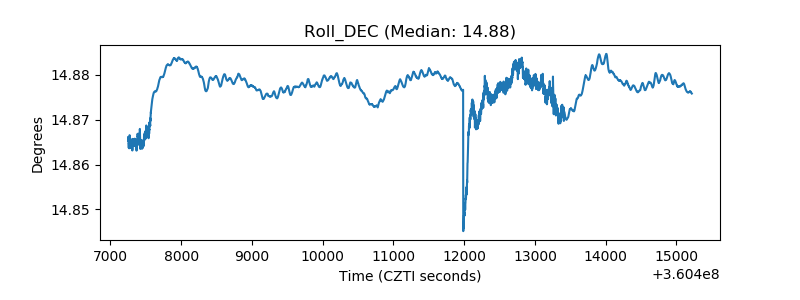 |
| _Roll_RA | 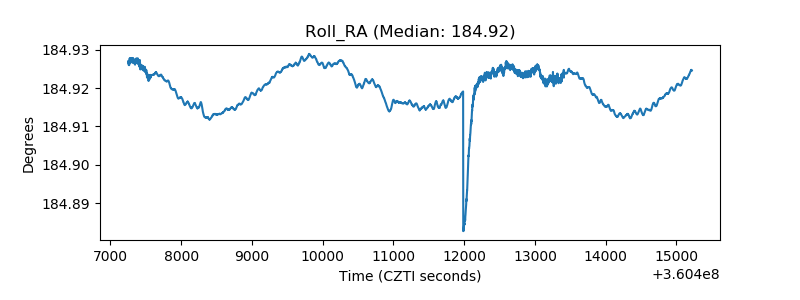 |
| Veto Counter | 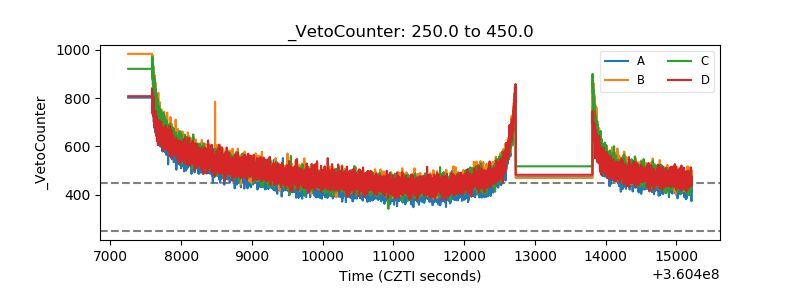 |