| Param | Original file | Final file |
|---|---|---|
| Filename | modeM0/AS1A10_071T44_9000004434_30720cztM0_level2.evt | modeM0/AS1A10_071T44_9000004434_30720cztM0_level2_quad_clean.evt |
| Size (bytes) | 639,342,720 | 101,787,840 |
| Size | 609.7 MB | 97.1 MB |
| Events in quadrant A | 3,918,888 | 668,778 |
| Events in quadrant B | 5,784,359 | 663,682 |
| Events in quadrant C | 4,625,577 | 627,497 |
| Events in quadrant D | 4,551,107 | 625,685 |
| Mode SS | |||
|---|---|---|---|
| Quadrant | BADHDUFLAG | Total packets | Discarded packets |
| A | 0 | 144 | 0 |
| B | 0 | 144 | 0 |
| C | 0 | 144 | 2 |
| D | 0 | 144 | 0 |
| Mode M0 | |||
|---|---|---|---|
| Quadrant | BADHDUFLAG | Total packets | Discarded packets |
| A | 0 | 15978 | 5 |
| B | 0 | 22392 | 23 |
| C | 0 | 18250 | 9 |
| D | 0 | 18143 | 15 |
| Mode M9 | |||
|---|---|---|---|
| Quadrant | BADHDUFLAG | Total packets | Discarded packets |
| A | 0 | 2 | 0 |
| B | 0 | 2 | 0 |
| C | 0 | 2 | 0 |
| D | 0 | 2 | 0 |
| Quadrant | Total seconds | Saturated seconds | Saturation percentage |
|---|---|---|---|
| A | 7140 | 257 | 3.599440% |
| B | 7135 | 387 | 5.423966% |
| C | 7138 | 483 | 6.766601% |
| D | 7140 | 278 | 3.893557% |
Noise dominated data is calculated using 1-second bins in cleaned event files. If a bin has >2000 counts, and if more than 50% of those come from <1% of pixels, then it is considered to be noise-dominated and hence unusable.
| Quadrant | # 1 sec bins | Bins with >0 counts | Bins with >2000 counts | High rate bins dominated by noise | Noise dominated (total time) | Noise dominated (detector-on time) | Marked lightcurve |
|---|---|---|---|---|---|---|---|
| A | 7307 | 7142 | 26 | 26 | 0.36% | 0.36% |  |
| B | 7307 | 7142 | 27 | 27 | 0.37% | 0.38% | 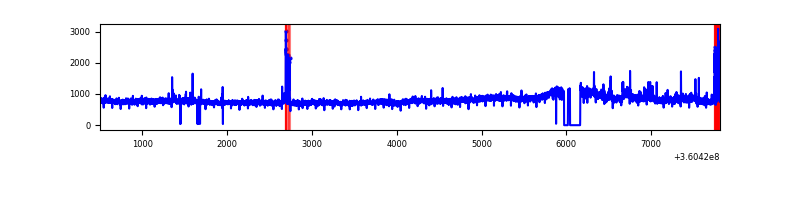 |
| C | 7307 | 7142 | 95 | 95 | 1.30% | 1.33% | 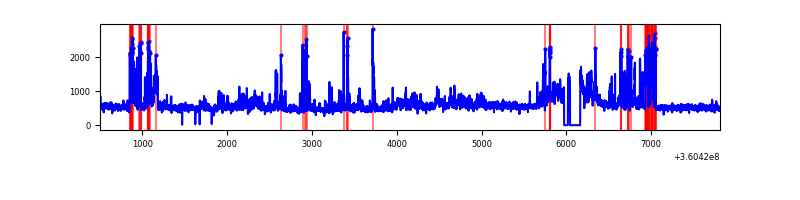 |
| D | 7308 | 7143 | 103 | 103 | 1.41% | 1.44% | 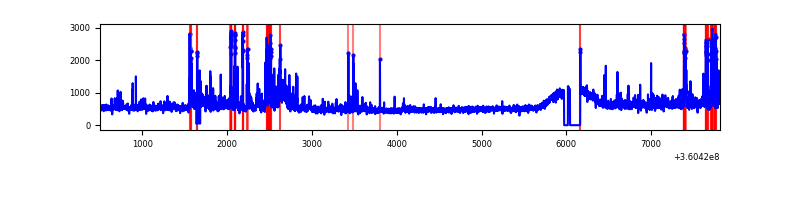 |
Top three noisy pixels from each quadrant. If the there are fewer than three noisy pixels in the level2.evt file, extra rows are filled as -1
| Pixel properties | Quadrant properties | ||||||
|---|---|---|---|---|---|---|---|
| Quadrant | DetID | PixID | Counts | Sigma | Mean | Median | Sigma |
| A | 0 | 13 | 241469 | 1278.96 | 929 | 910 | 188.1 |
| A | 8 | 192 | 93410 | 491.79 | 929 | 910 | 188.1 |
| A | 13 | 254 | 14031 | 69.76 | 929 | 910 | 188.1 |
| B | 6 | 159 | 1952268 | 11087.09 | 906 | 882 | 176.0 |
| B | 6 | 36 | 108953 | 614.02 | 906 | 882 | 176.0 |
| B | 5 | 255 | 62981 | 352.82 | 906 | 882 | 176.0 |
| C | 10 | 22 | 636416 | 3068.86 | 874 | 881 | 207.1 |
| C | 3 | 233 | 427674 | 2060.89 | 874 | 881 | 207.1 |
| C | 14 | 238 | 140093 | 672.22 | 874 | 881 | 207.1 |
| D | 8 | 195 | 548107 | 2505.45 | 903 | 879 | 218.4 |
| D | 2 | 250 | 250455 | 1142.67 | 903 | 879 | 218.4 |
| D | 13 | 249 | 213773 | 974.72 | 903 | 879 | 218.4 |
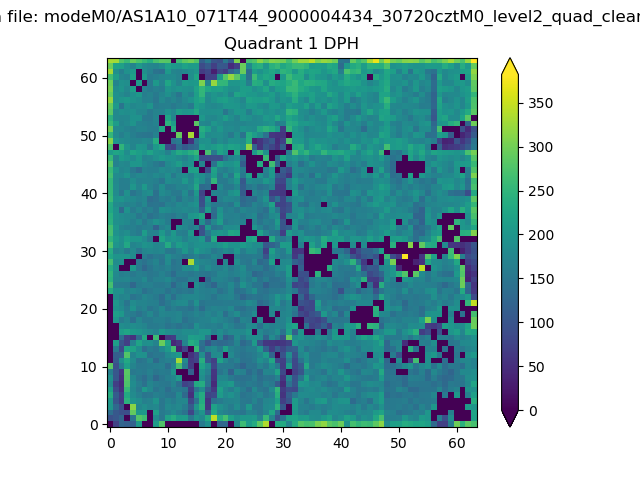
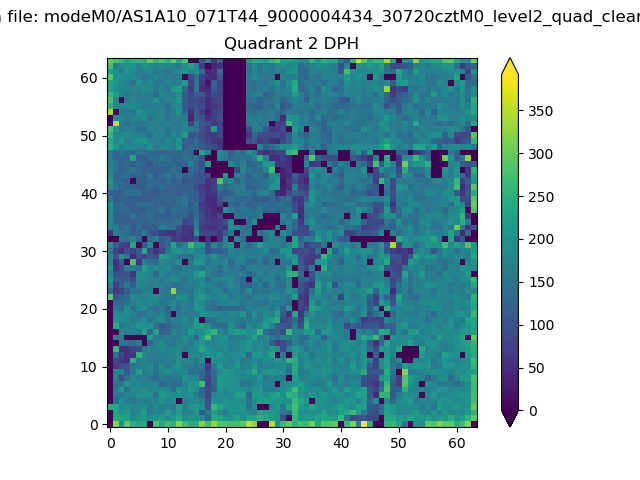
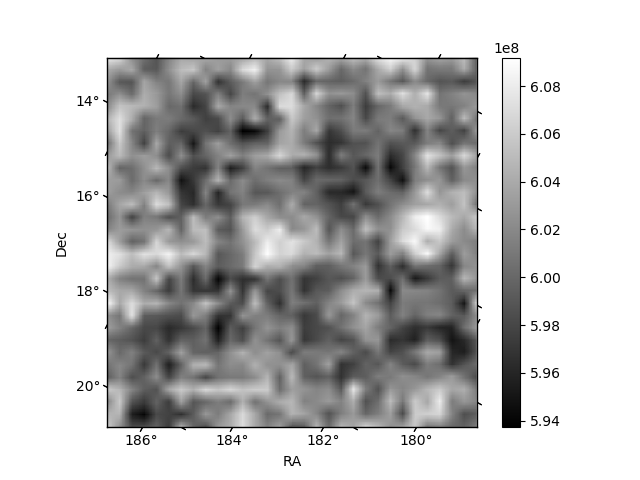
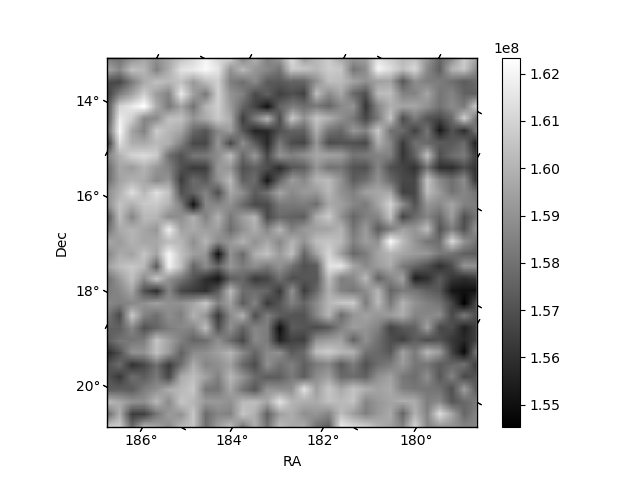
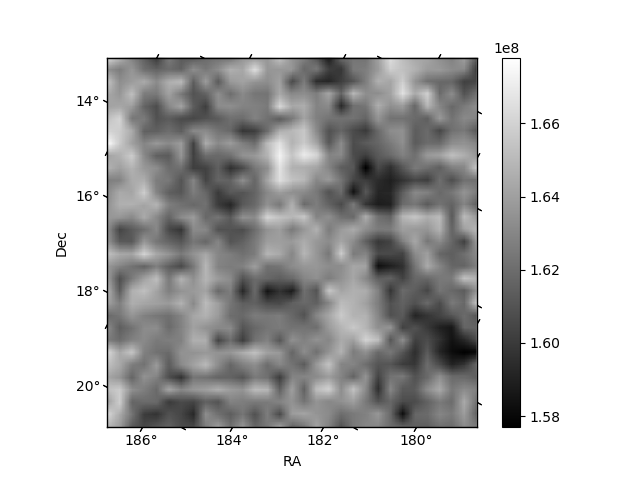
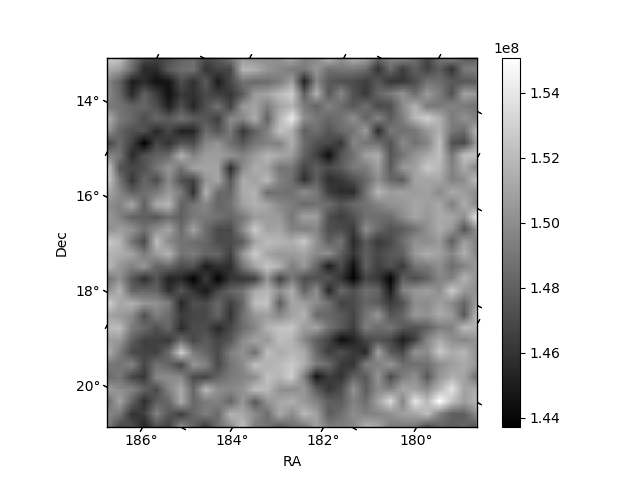
Histogram calculated using DETX and DETY for each event in the final _common_clean file
| Quadrant A | 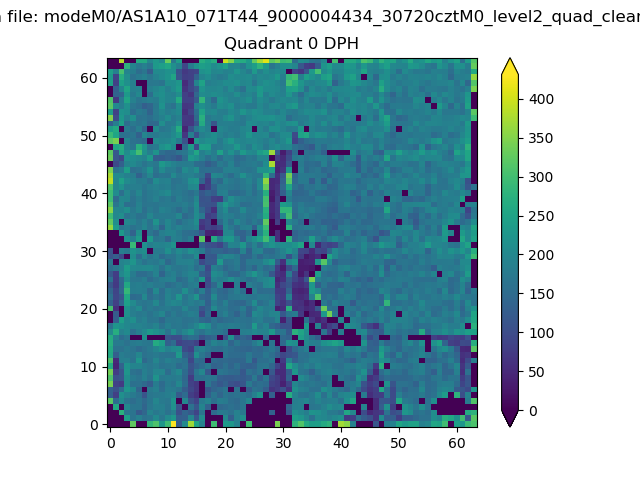 |
 |
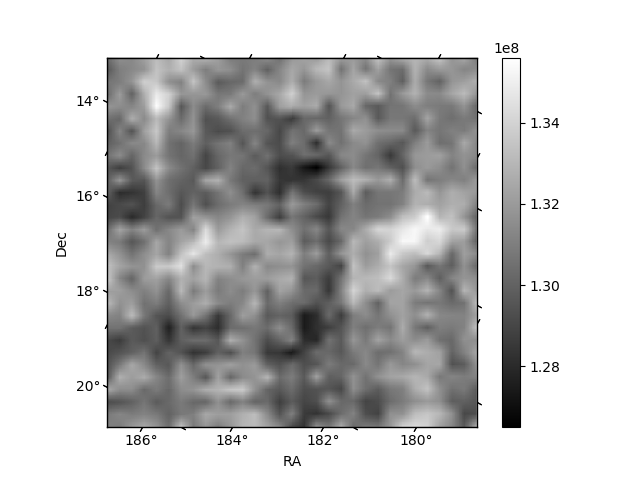
Quadrant B |
|---|---|---|---|
| Quadrant D | 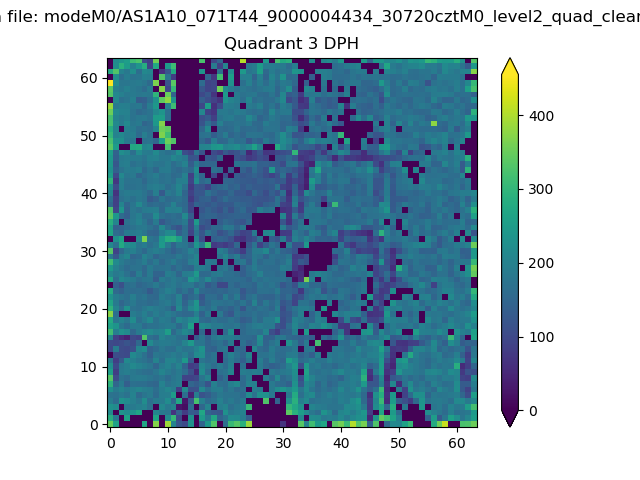 |
 |
Quadrant C |
| Plot type | Count rate plots | Images |
|---|---|---|
| Comparison with Poisson distribution Blue bars denote a histogram of data divided into 1 sec bins. Red curve is a Poisson curve with rate = median count rate of data. |
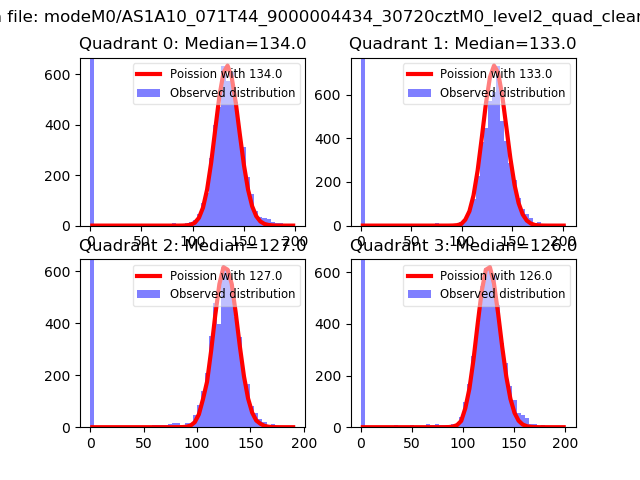 |
 |
| Quadrant-wise count rates Data is divided into 100 sec bins |
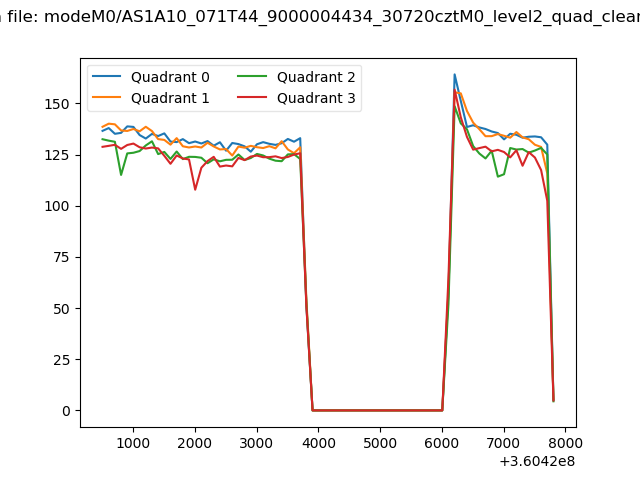 |
|
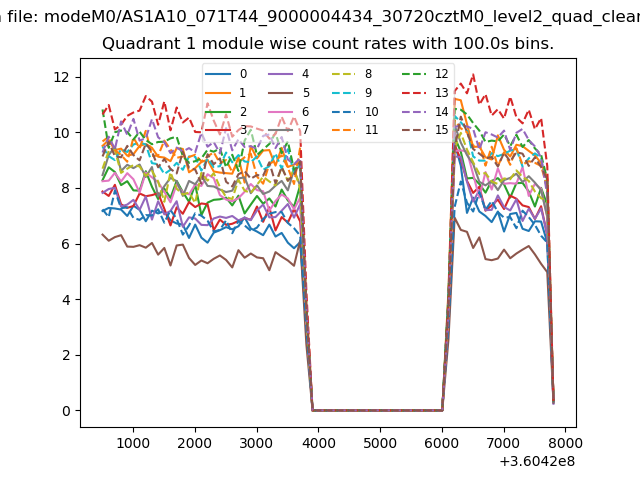
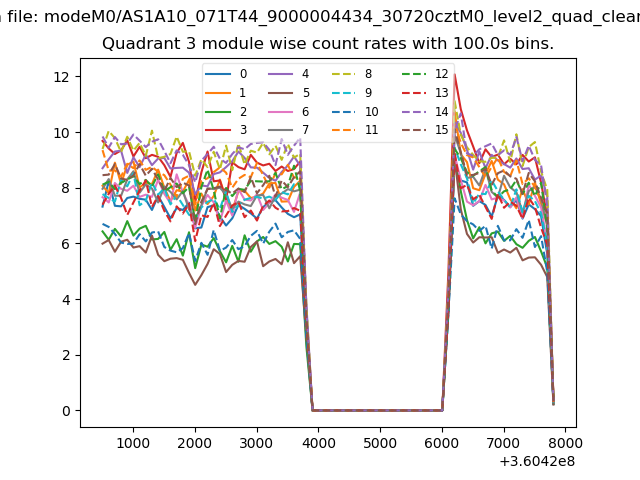
| Module-wise count rates for Quadrant A Data is divided into 100 sec bins |
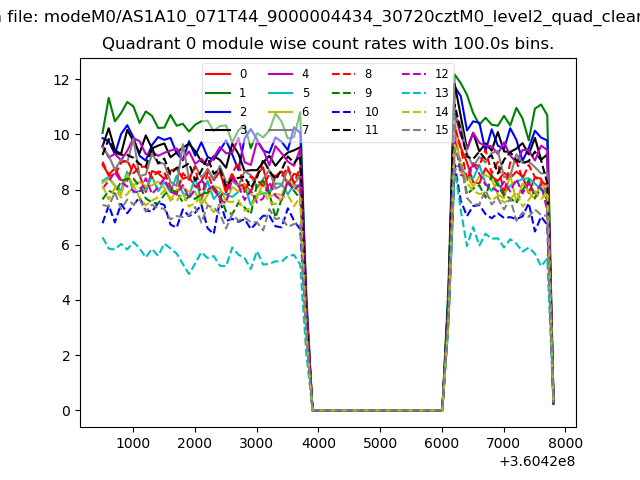 |
 |
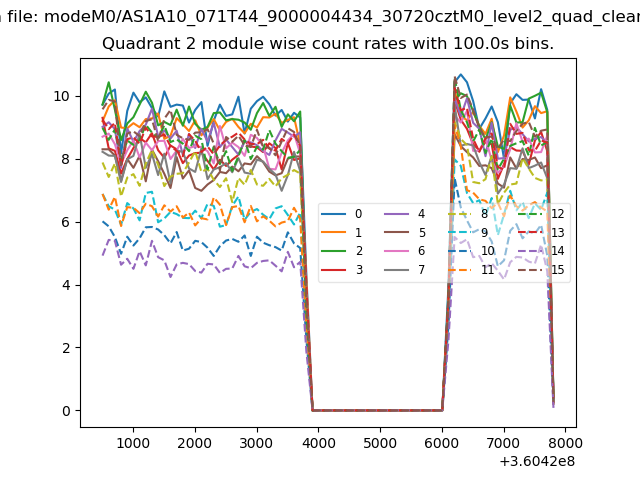
| Module-wise count rates for Quadrant B Data is divided into 100 sec bins |
 |
 |
| Module-wise count rates for Quadrant C Data is divided into 100 sec bins |
 |
 |
| Module-wise count rates for Quadrant D Data is divided into 100 sec bins |
 |
 |
| Parameter | Plot |
|---|---|
| CZT HV Monitor | 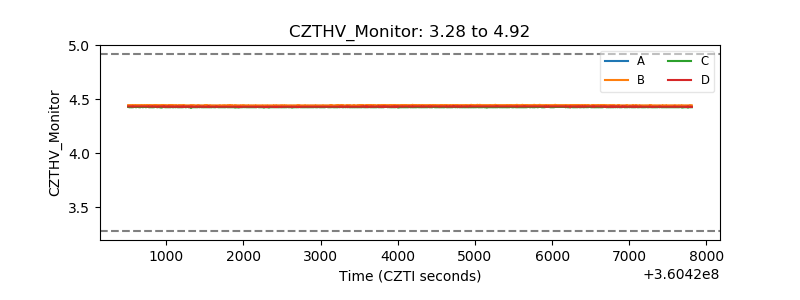 |
| D_VDD | 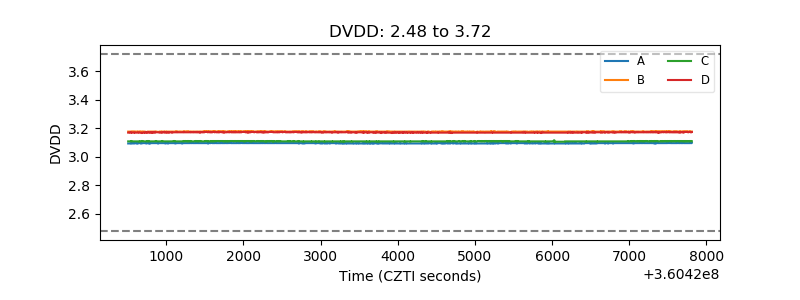 |
| Temperature 1 | 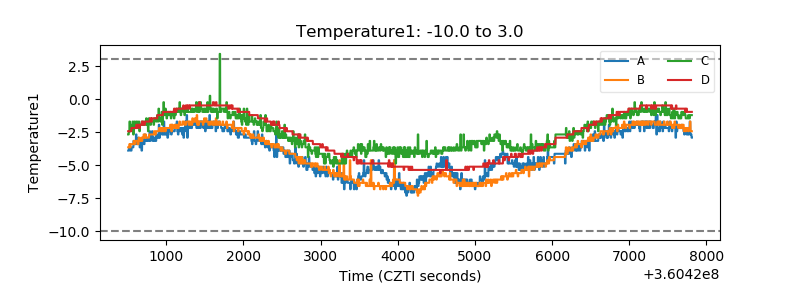 |
| Veto HV Monitor | 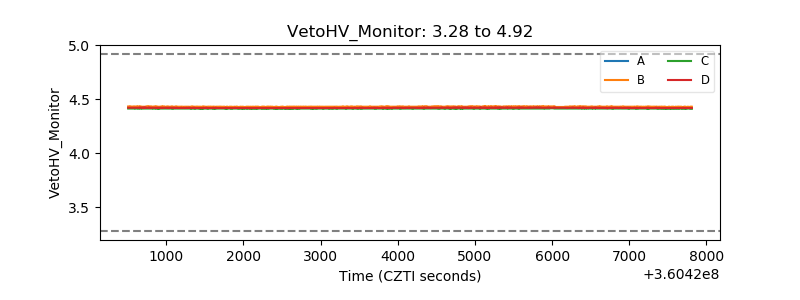 |
| Veto LLD | 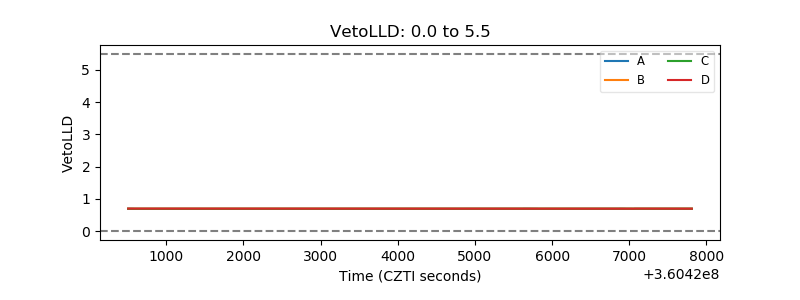 |
| Alpha Counter | 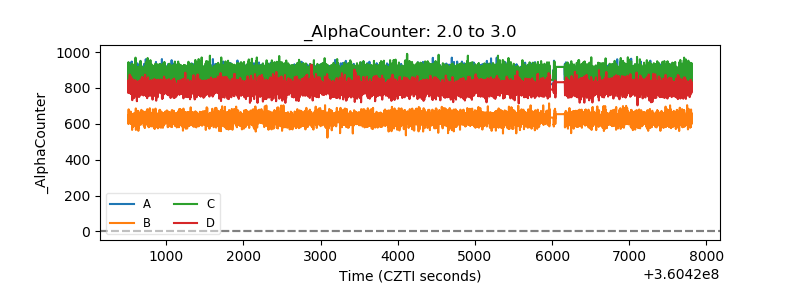 |
| _CPM_Rate | 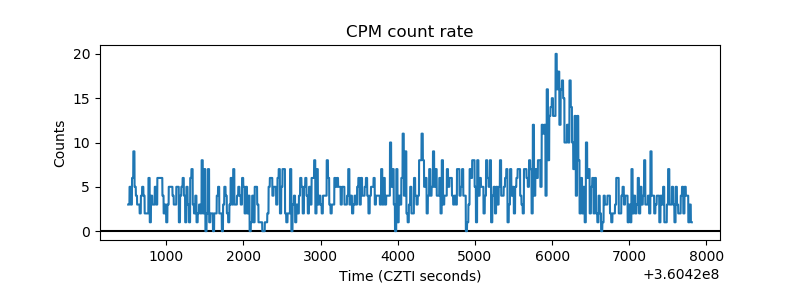 |
| CZT Counter | 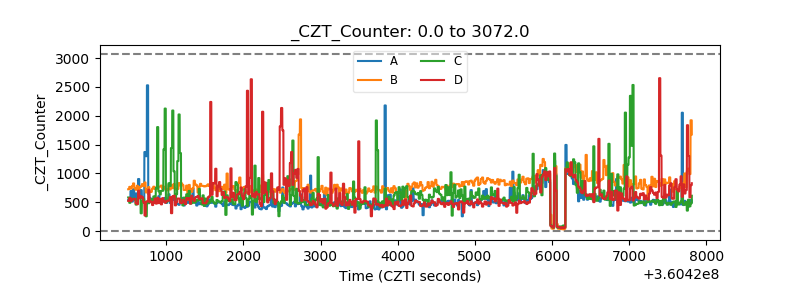 |
| +2.5 Volts monitor | 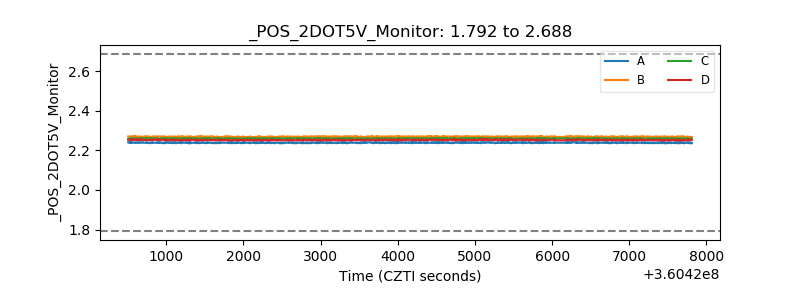 |
| +5 Volts monitor | 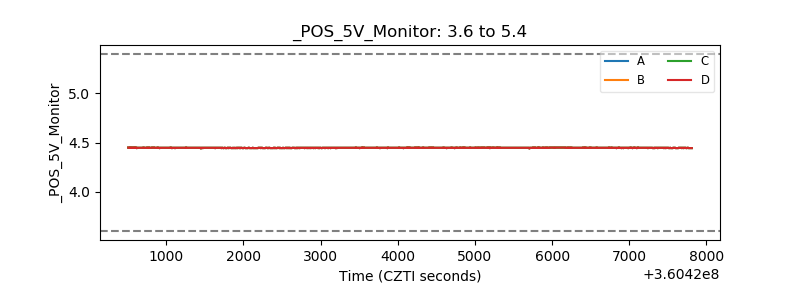 |
| _ROLL_ROT | 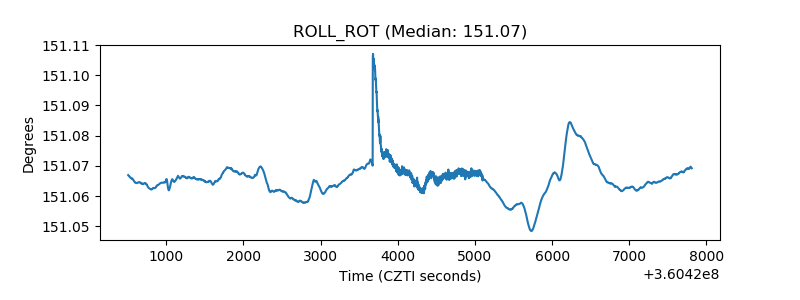 |
| _Roll_DEC | 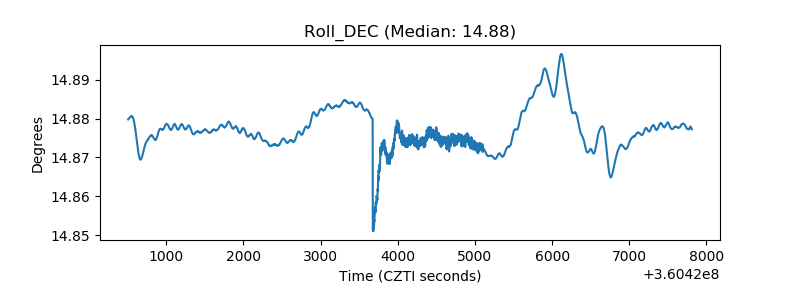 |
| _Roll_RA | 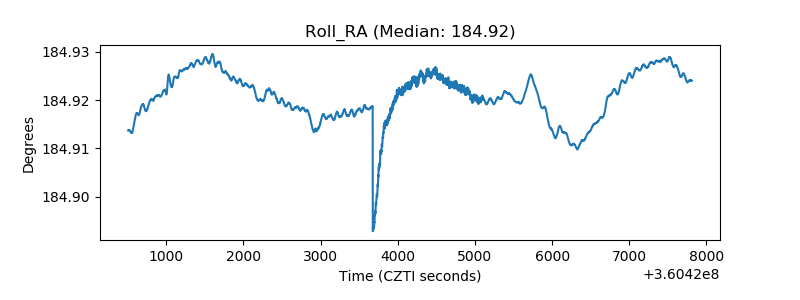 |
| Veto Counter | 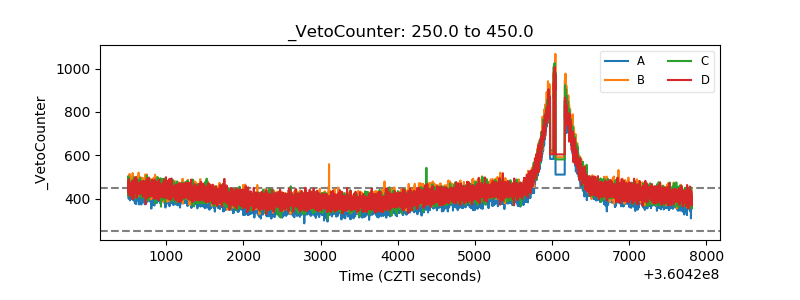 |