| Param | Original file | Final file |
|---|---|---|
| Filename | modeM0/AS1A10_071T44_9000004434_30721cztM0_level2.evt | modeM0/AS1A10_071T44_9000004434_30721cztM0_level2_quad_clean.evt |
| Size (bytes) | 815,135,040 | 113,489,280 |
| Size | 777.4 MB | 108.2 MB |
| Events in quadrant A | 4,263,807 | 757,129 |
| Events in quadrant B | 6,953,173 | 734,091 |
| Events in quadrant C | 4,966,097 | 708,241 |
| Events in quadrant D | 7,969,650 | 686,626 |
| Mode SS | |||
|---|---|---|---|
| Quadrant | BADHDUFLAG | Total packets | Discarded packets |
| A | 0 | 160 | 0 |
| B | 0 | 160 | 0 |
| C | 0 | 160 | 0 |
| D | 0 | 160 | 0 |
| Mode M0 | |||
|---|---|---|---|
| Quadrant | BADHDUFLAG | Total packets | Discarded packets |
| A | 0 | 17536 | 2 |
| B | 0 | 26094 | 2 |
| C | 0 | 19765 | 2 |
| D | 0 | 29283 | 2 |
| Quadrant | Total seconds | Saturated seconds | Saturation percentage |
|---|---|---|---|
| A | 7908 | 297 | 3.755690% |
| B | 7908 | 660 | 8.345979% |
| C | 7908 | 596 | 7.536672% |
| D | 7909 | 581 | 7.346061% |
Noise dominated data is calculated using 1-second bins in cleaned event files. If a bin has >2000 counts, and if more than 50% of those come from <1% of pixels, then it is considered to be noise-dominated and hence unusable.
| Quadrant | # 1 sec bins | Bins with >0 counts | Bins with >2000 counts | High rate bins dominated by noise | Noise dominated (total time) | Noise dominated (detector-on time) | Marked lightcurve |
|---|---|---|---|---|---|---|---|
| A | 7933 | 7909 | 16 | 16 | 0.20% | 0.20% | 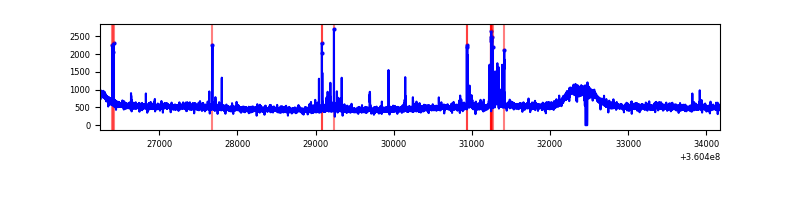 |
| B | 7933 | 7908 | 154 | 154 | 1.94% | 1.95% | 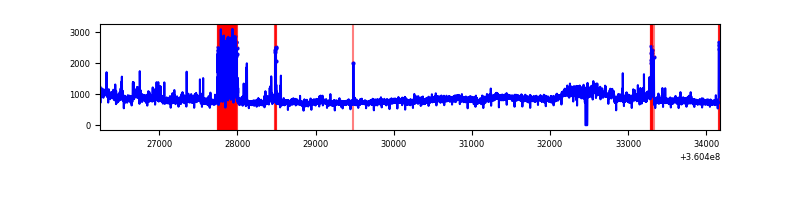 |
| C | 7933 | 7908 | 151 | 151 | 1.90% | 1.91% | 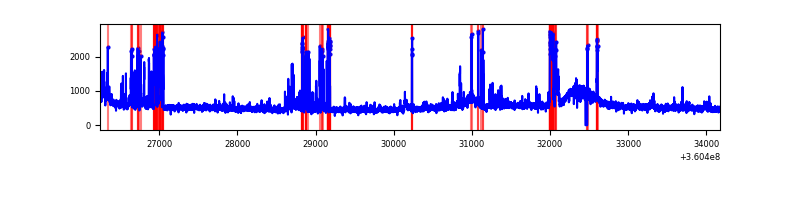 |
| D | 7934 | 7909 | 287 | 287 | 3.62% | 3.63% | 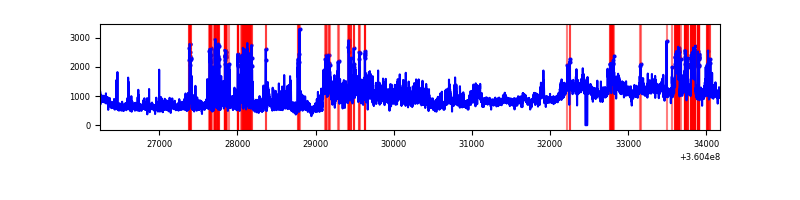 |
Top three noisy pixels from each quadrant. If the there are fewer than three noisy pixels in the level2.evt file, extra rows are filled as -1
| Pixel properties | Quadrant properties | ||||||
|---|---|---|---|---|---|---|---|
| Quadrant | DetID | PixID | Counts | Sigma | Mean | Median | Sigma |
| A | 0 | 13 | 157628 | 742.62 | 1038 | 1014 | 210.9 |
| A | 8 | 192 | 99640 | 467.66 | 1038 | 1014 | 210.9 |
| A | 13 | 254 | 15144 | 67.0 | 1038 | 1014 | 210.9 |
| B | 6 | 159 | 2156201 | 10969.54 | 1002 | 978 | 196.5 |
| B | 5 | 255 | 425719 | 2161.82 | 1002 | 978 | 196.5 |
| B | 6 | 36 | 290237 | 1472.26 | 1002 | 978 | 196.5 |
| C | 10 | 22 | 782894 | 3371.37 | 975 | 979 | 231.9 |
| C | 3 | 233 | 206021 | 884.07 | 975 | 979 | 231.9 |
| C | 14 | 238 | 153686 | 658.42 | 975 | 979 | 231.9 |
| D | 8 | 195 | 3282412 | 13779.13 | 990 | 965 | 238.1 |
| D | 13 | 174 | 266389 | 1114.54 | 990 | 965 | 238.1 |
| D | 13 | 249 | 265192 | 1109.52 | 990 | 965 | 238.1 |
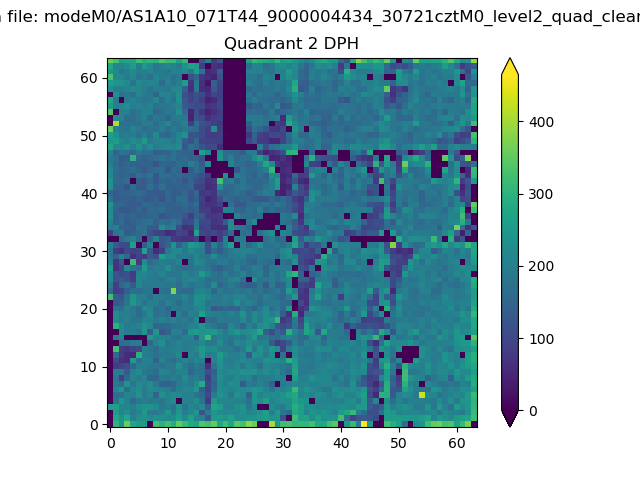
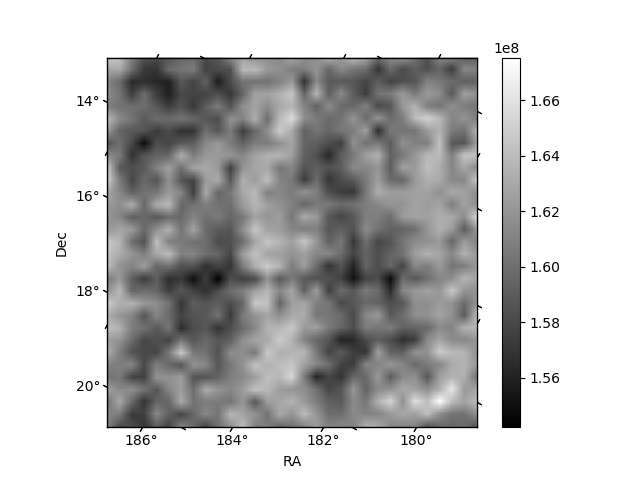
Histogram calculated using DETX and DETY for each event in the final _common_clean file
| Quadrant A |  |
 |
Quadrant B |
|---|---|---|---|
| Quadrant D | 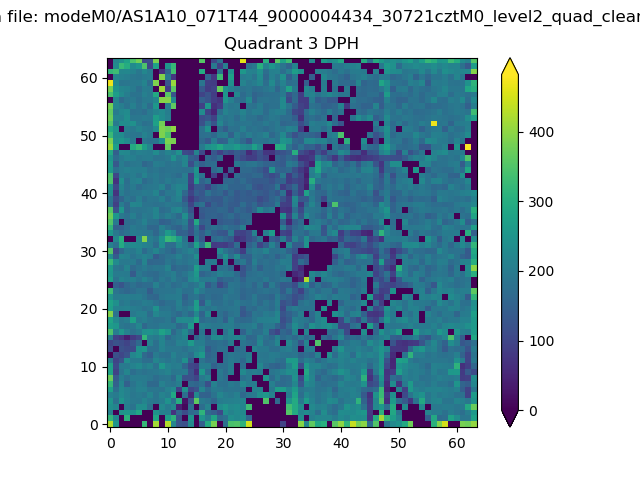 |
 |
Quadrant C |
| Plot type | Count rate plots | Images |
|---|---|---|
| Comparison with Poisson distribution Blue bars denote a histogram of data divided into 1 sec bins. Red curve is a Poisson curve with rate = median count rate of data. |
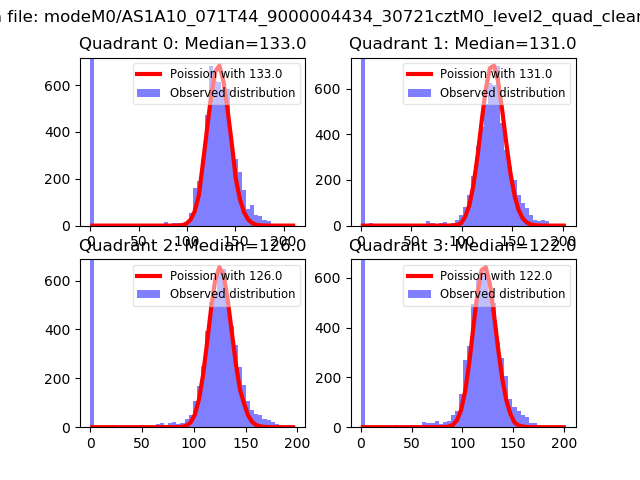 |
 |
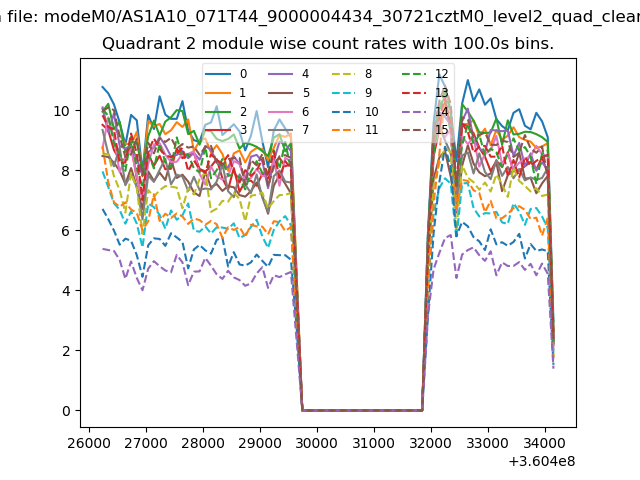
| Quadrant-wise count rates Data is divided into 100 sec bins |
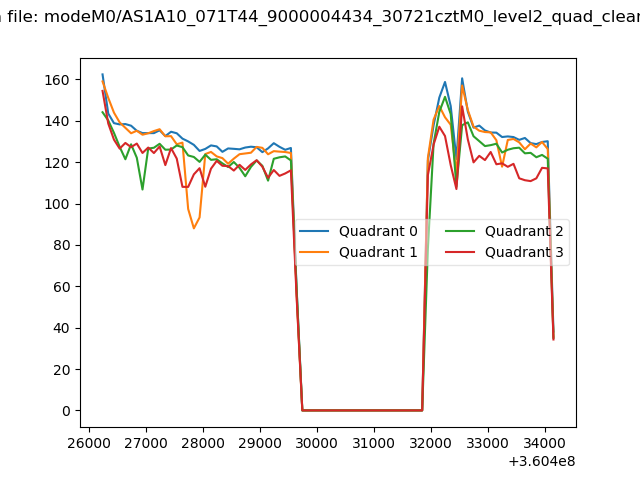 |
|
| Module-wise count rates for Quadrant A Data is divided into 100 sec bins |
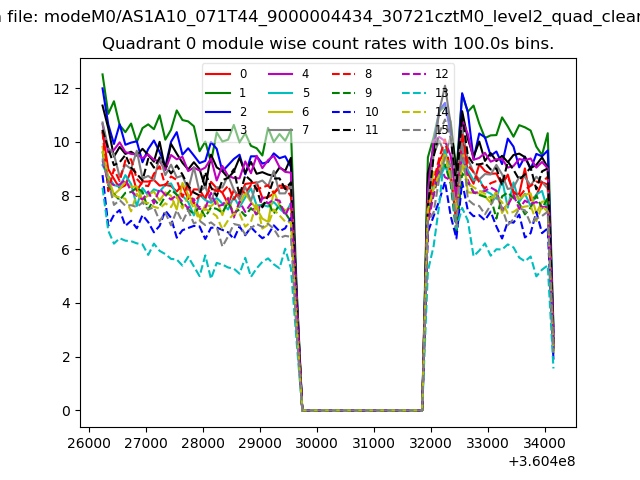 |
 |
| Module-wise count rates for Quadrant B Data is divided into 100 sec bins |
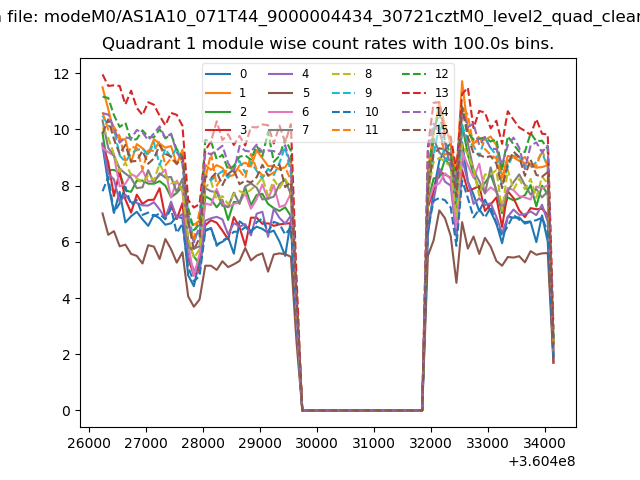 |
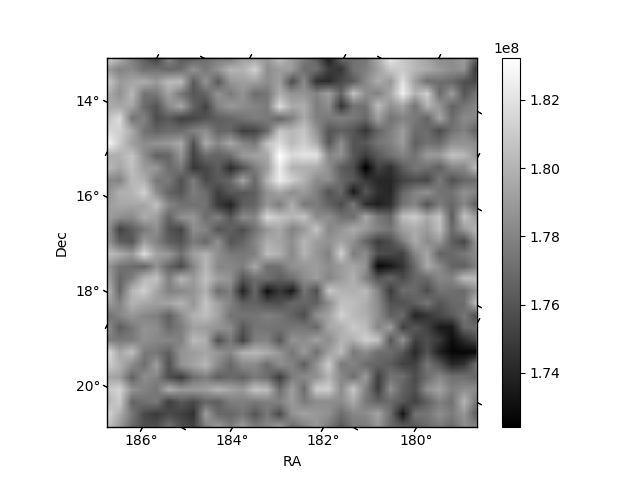 |
| Module-wise count rates for Quadrant C Data is divided into 100 sec bins |
 |
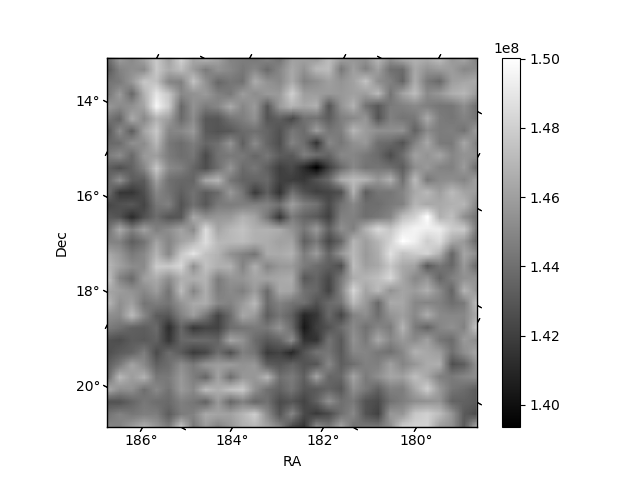 |
| Module-wise count rates for Quadrant D Data is divided into 100 sec bins |
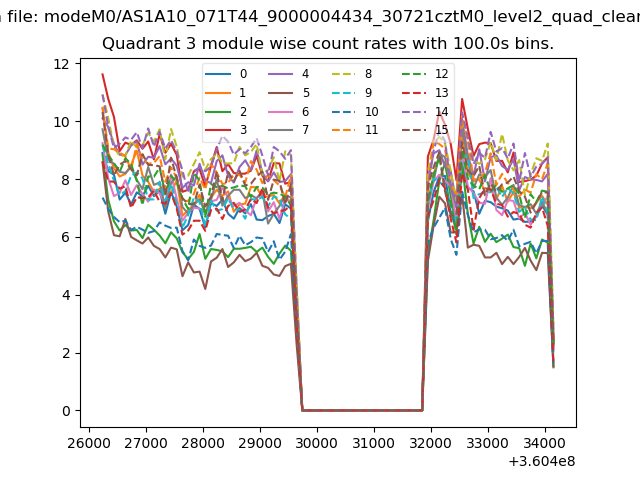 |
 |
| Parameter | Plot |
|---|---|
| CZT HV Monitor | 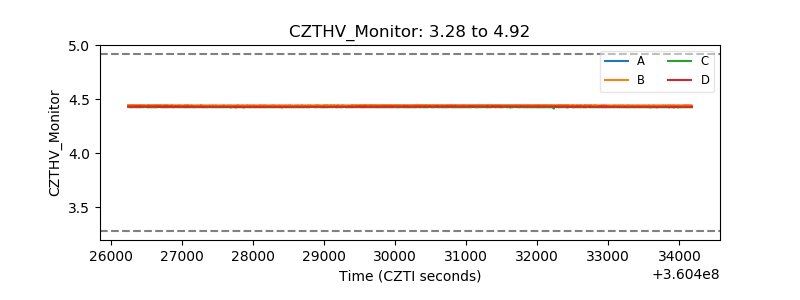 |
| D_VDD | 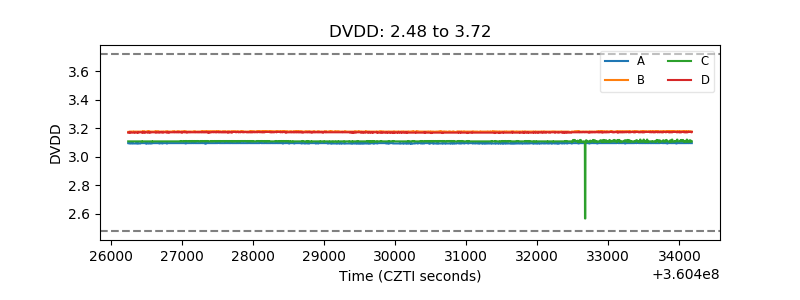 |
| Temperature 1 | 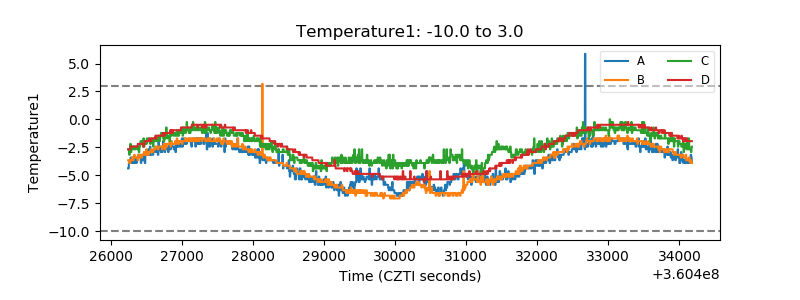 |
| Veto HV Monitor | 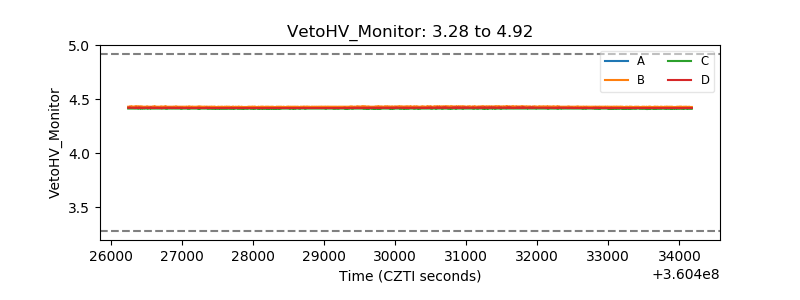 |
| Veto LLD |  |
| Alpha Counter | 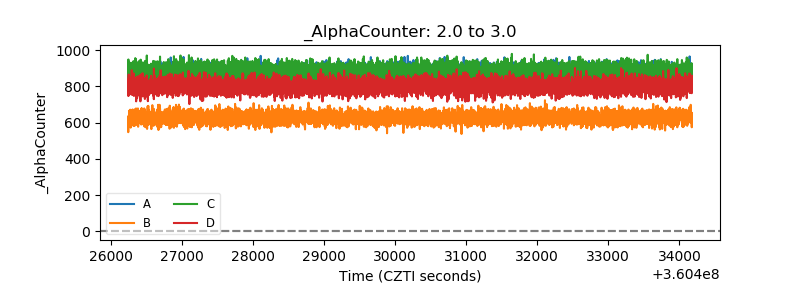 |
| _CPM_Rate | 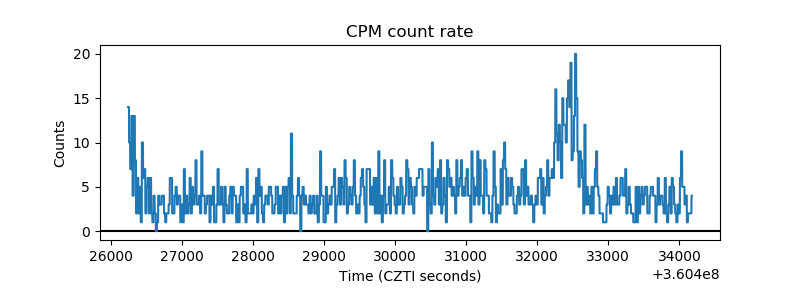 |
| CZT Counter | 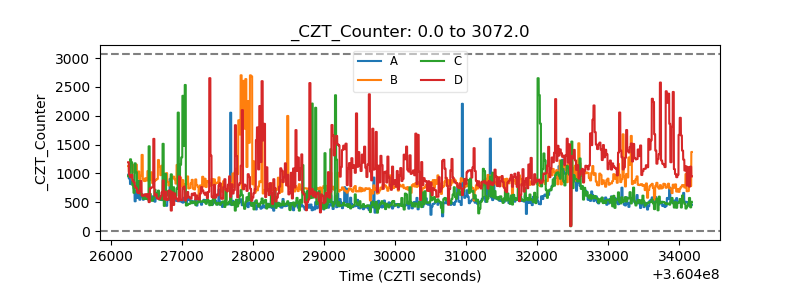 |
| +2.5 Volts monitor |  |
| +5 Volts monitor |  |
| _ROLL_ROT | 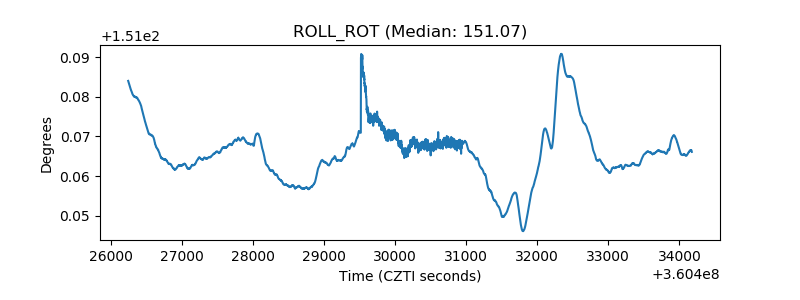 |
| _Roll_DEC | 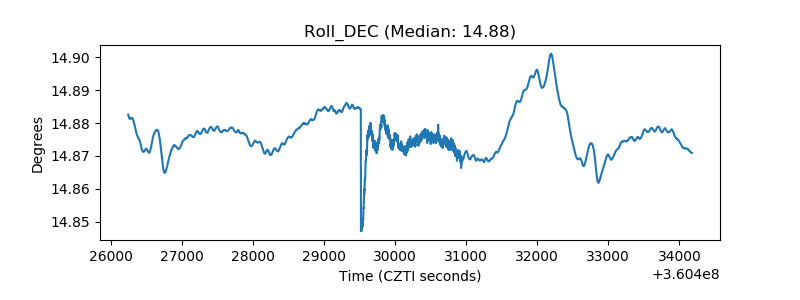 |
| _Roll_RA | 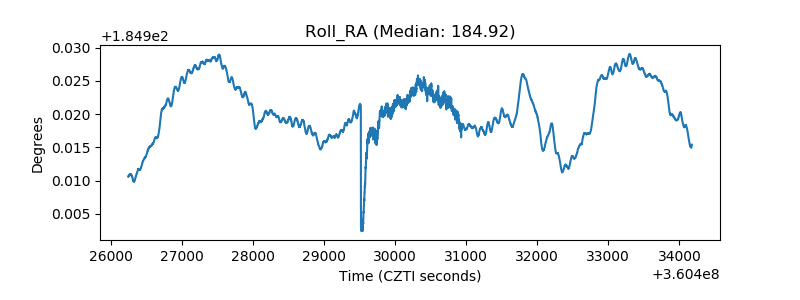 |
| Veto Counter |  |